Power distribution network line loss prediction method and system

A forecasting method and distribution network technology, applied in forecasting, load forecasting in AC networks, electrical components, etc., can solve problems such as low forecasting accuracy, poor objectivity, and difficulty in determining the optimal value of indicators, so as to improve accuracy and improve The effect of efficiency and precision

Pending Publication Date: 2021-03-12
HUNAN UNIV
View PDF7 Cites 17 Cited by
  • Summary
  • Abstract
  • Description
  • Claims
  • Application Information

AI Technical Summary

Problems solved by technology

[0004] With the development of artificial intelligence technology, China has also begun to gradually pay attention to the research on the analysis, mining and prediction of distribution network line loss data. At present, there are relatively mature distribution network load forecasting methods in China, and the research on line loss prediction is still in progress. initial stage
For line loss analysis, the existing intelligent algorithm uses Pearson correlation and gray correlation analysis methods to mine line loss correlation. Pearson correlation coefficient is easy to calculate, but it can only measure variables linearly related to line loss. Gray correlation analysis The relationship is judged by the change trend between variables and line loss, but the optimal value of the index is difficult to determine, and the objectivity is poor
For line loss prediction, the traditional method uses simple mathematical statistics and least squares regression method to analyze and predict distribution network line loss. The prediction accuracy is low and the inner law of line loss cannot be deeply explored.
In addition, the method of using machine learning algorithms such as support vector machine and BP neural network to predict the line loss of distribution network has been gradually proposed by scholars, which can fit the change of line loss in the future to a certain extent, but the model does not combine the contextual characteristics of the time series Forecasting, the prediction accuracy still needs to be improved

Method used


Image

  • Power distribution network line loss prediction method and system
  • Power distribution network line loss prediction method and system
  • Power distribution network line loss prediction method and system

Examples


Embodiment Construction

[0059] In order to make the purpose, technical solutions and advantages of the embodiments of the present application clearer, the embodiments of the present application will be described in detail below with reference to the accompanying drawings. However, those of ordinary skill in the art can understand that in each embodiment of the application, many technical details are provided for readers to better understand the application. However, even without these technical details and various changes and modifications based on the following embodiments, the technical solutions claimed in this application can also be realized. The division of the following embodiments is for the convenience of description, and should not constitute any limitation to the specific implementation of the present application, and the embodiments can be combined and referred to each other on the premise of no contradiction.

[0060] The term "and / or" in the embodiment of the present application is only...


PUM


Abstract

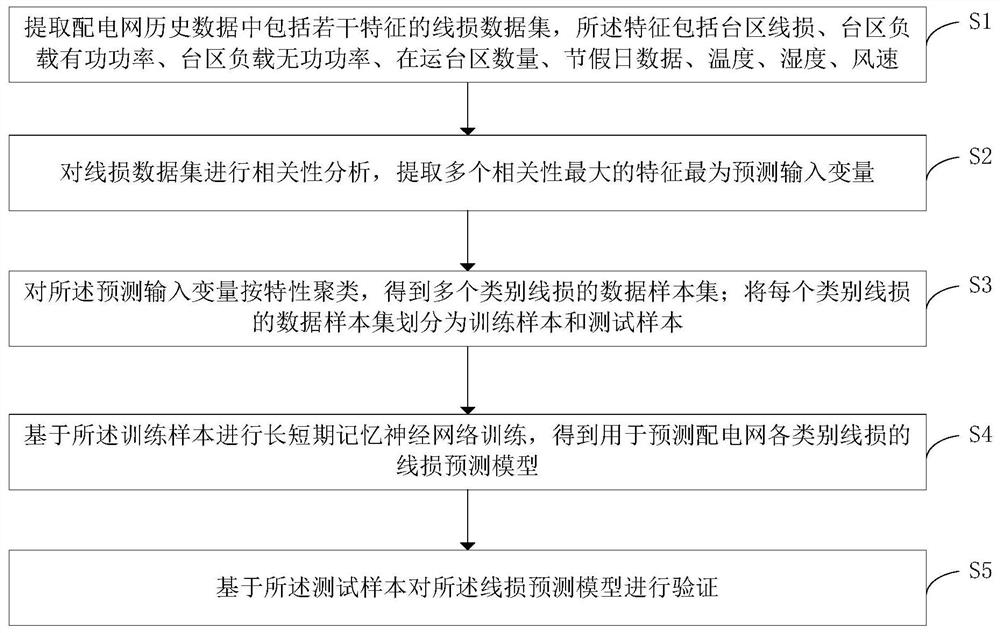
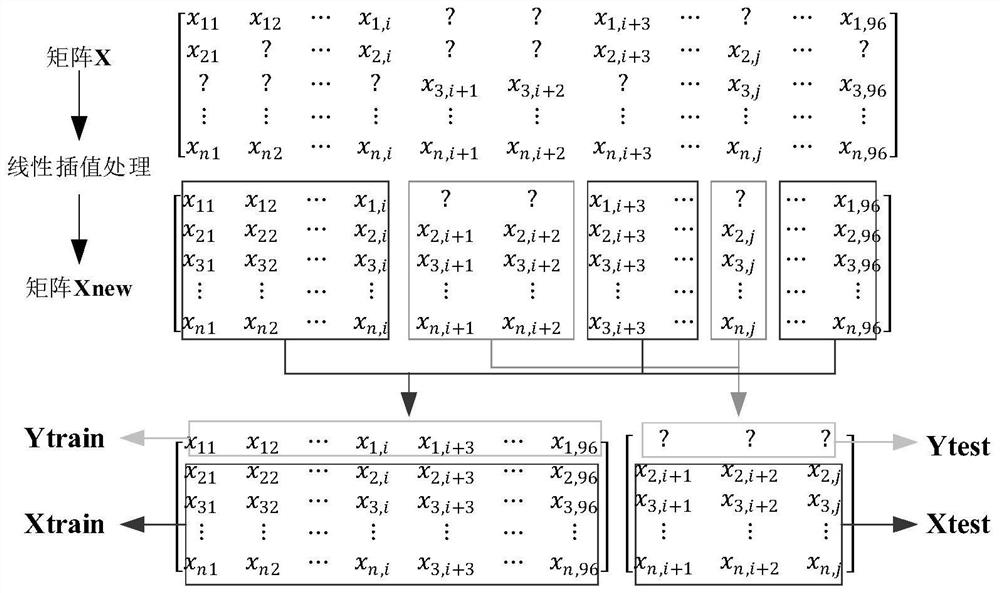
The embodiment of the invention provides a power distribution network line loss prediction method and system, and the method comprises the steps: obtaining and cleaning the time sequence data of eachline and each transformer area in a power distribution network, employing an outlier detection method, detecting and removing the abnormal data of a time sequence, building an interpolation improved random forest model, and filling up the missing data of the time sequence; calculating the maximum mutual information coefficient of each feature and the line loss data according to the change rule ofeach time sequence feature, and selecting the feature with the maximum correlation with the line loss as the input feature of the line loss prediction model; clustering the line loss data with similarcharacteristics by adopting a k-means clustering method according to the time sequence data of the line loss of each transformer area, dividing each type of line loss data set, establishing a long-short-term memory neural network prediction model, and inputting a training sample to train the long-short-term memory neural network to obtain a line loss prediction model. The precision of short-termline loss prediction of a power distribution network can be improved, and the purpose of guiding distribution line loss management and efficiency-improving operation is achieved.

Description

technical field [0001] The embodiments of the present application relate to the technical field of distribution network line loss analysis and management, and in particular to a distribution network line loss prediction method and system. Background technique [0002] In recent years, with the increase of power equipment, the scale of my country's distribution network has continued to increase. However, the problem of distribution loss has become increasingly serious with the continuous increase of load capacity. The increase in the line loss of the distribution network will lead to an increase in the capacity of power generation and transmission equipment, so Resulting in increased power costs and waste of power resources. The development structure of my country's distribution network is irrational, and the management of distribution loss lacks guidance. At present, the loss of medium and low voltage distribution lines accounts for about 50% of the total power line loss. The...

Claims


Application Information

Patent Timeline
Patent Type & Authority Applications(China)
IPC IPC(8): G06Q10/04G06Q10/06G06Q50/06G06K9/62H02J3/00
CPCG06Q10/04G06Q10/0639G06Q50/06H02J3/003G06F18/23213
Inventor 李勇郭钇秀乔学博周王峰段义隆
Owner HUNAN UNIV
Why Eureka
Try Eureka