

Webshell detection method based on image analysis, terminal equipment and storage medium
A technology of image analysis and detection methods, applied in image analysis, image data processing, instruments, etc., which can solve the problem of detection of false negative rate and false positive rate that cannot cross domains, bottlenecks, well-defined behavioral characteristics and complete coverage of risk models and other issues to achieve the effect of improving detection performance, avoiding manual maintenance, and avoiding linear growth
- Summary
- Abstract
- Description
- Claims
- Application Information
AI Technical Summary
Problems solved by technology
Method used
Image

Examples
Embodiment 1
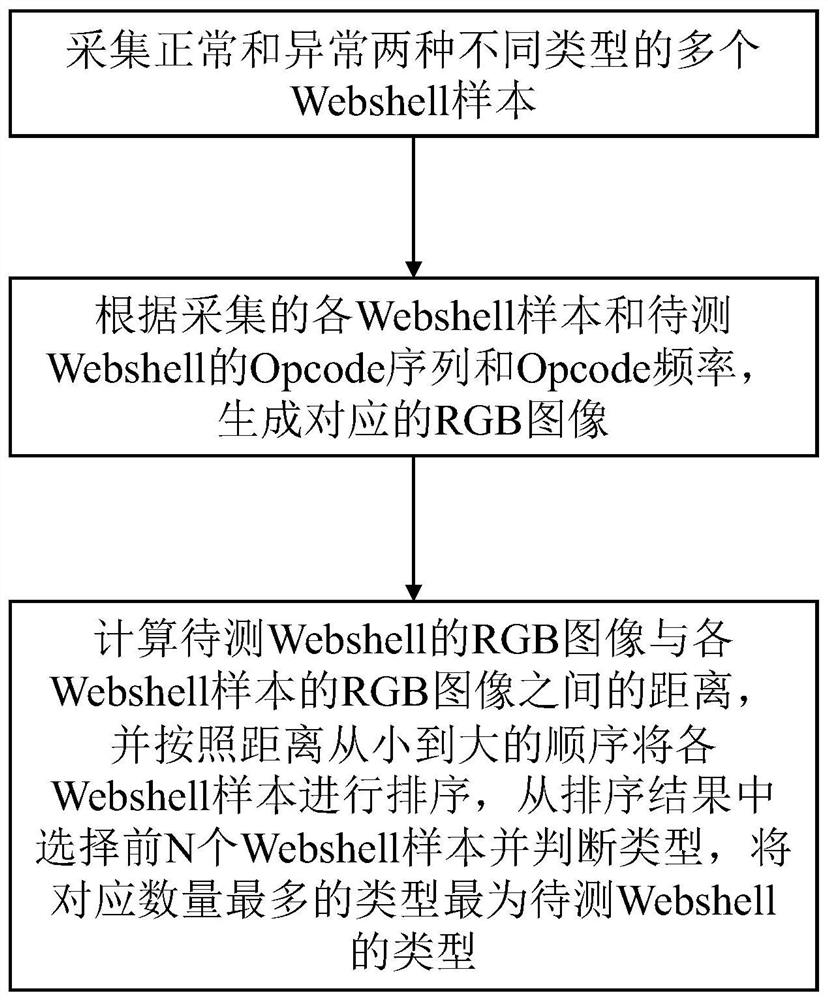
[0031] The embodiment of the present invention provides a Webshell detection method based on image analysis, such as figure 1 As shown, the method includes the following steps:
[0032] S1: Collect multiple webshell samples of two different types, normal and abnormal.
[0033] S2: Generate a corresponding RGB image according to the collected Webshell samples and the Opcode sequence and Opcode frequency of the Webshell to be tested.
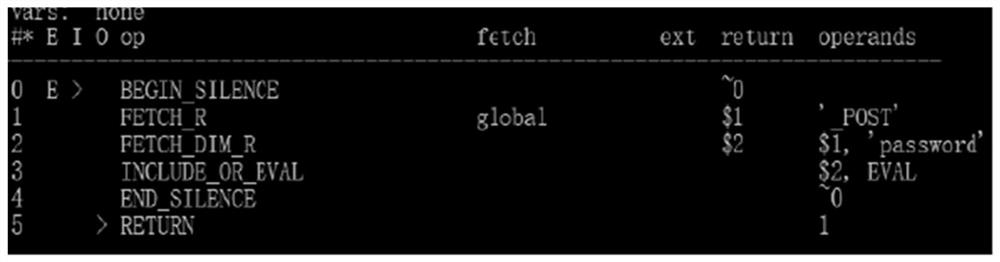
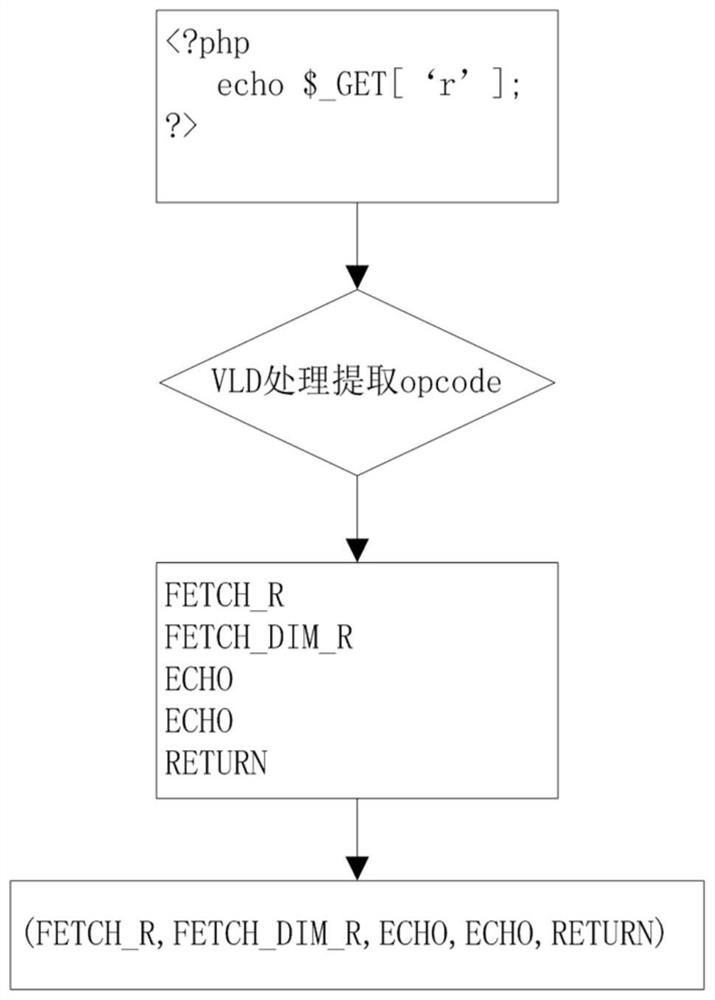
[0034] In this embodiment, the Webshell in the form of php code is taken as an example for illustration. When the Zend virtual machine executes a piece of php code, it generally goes through the following four steps:
[0035] 1) Scanning (Lexing), which converts PHP code into language fragments (Tokens);
[0036] 2) Parsing, which converts language fragments into simple and meaningful expressions;
[0037] 3) Compilation, which compiles expressions into Opcodes;
[0038] 4) Execution, that is, the Zend engine executes Opcodes in sequence.
...
Embodiment 2
[0073] The present invention also provides a Webshell detection terminal device based on image analysis, including a memory, a processor, and a computer program stored in the memory and operable on the processor, when the processor executes the computer program The steps in the above method embodiment of Embodiment 1 of the present invention are implemented.
PUM
 Abstract
Description
Claims
Application Information