
Gastrointestinal stromal tumor prediction method and system based on XGBoost algorithm
A gastrointestinal stromal tumor and prediction method technology, applied in the field of gastrointestinal stromal tumor prediction based on XGBoost algorithm, can solve the problem of high misdiagnosis rate of GIST preoperative diagnosis
- Summary
- Abstract
- Description
- Claims
- Application Information
AI Technical Summary
Problems solved by technology
Method used
Image

Examples
example 1
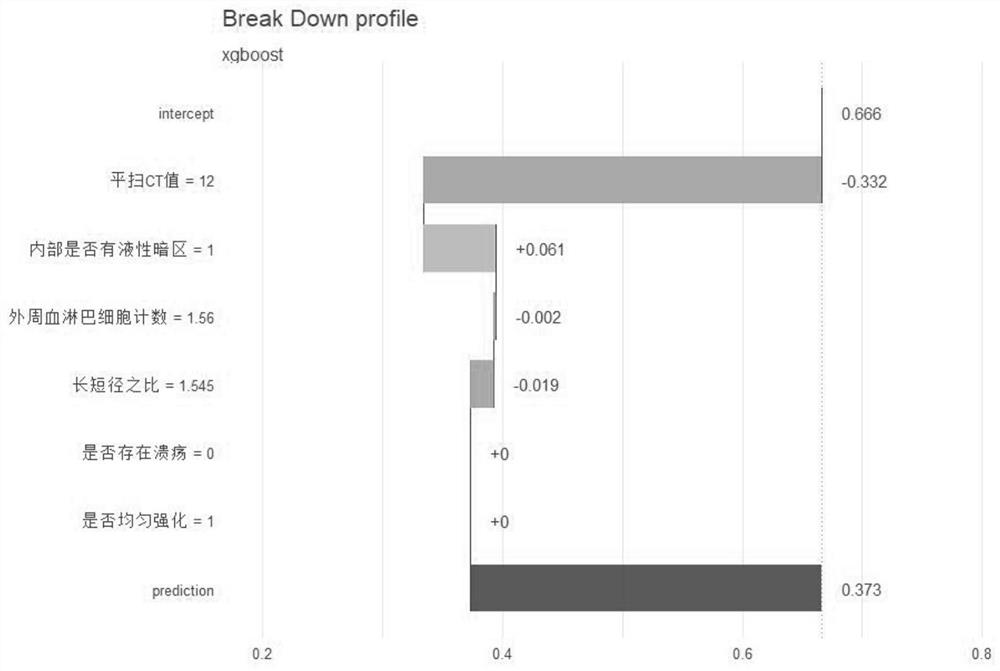
[0099] Create a data frame and input the above six indicators of patient A to be predicted. For example, the ratio of the long and short diameters of his input tumor is 1.5454545, the plain scan CT value of the tumor is 12, the tumor is uniformly enhanced under enhanced CT, and endoscopic ultrasonography shows that there is no ulcer on the surface of the tumor and there is a liquid dark area inside. The peripheral lymphocyte count was 1.56 (×10 9 / L). As follows: datanewpatient<-data.frame(Long.Short.Diameter=1.5454545, CT.Value=12, Homogeneously.Enhanced=1, Ulcer=0, Liquid.Area=1, Lymphcte.Count=1.56)
[0100] Next, input the above data into the XGBoost prediction model and adjust the data format. After the calculation of the model, the final prediction result is output. like image 3 As shown, it can be seen that the calculated patient prediction value is 0.373, which is smaller than the measured value 0.666 (intercept value) predicted by the model, so the model output r...
example 2
[0102] Create a data frame and input the above six indicators of patient B to be predicted. For example, the ratio of the long and short diameters of his tumor is 1.053, the plain scan CT value of the tumor is 33, the tumor is unevenly enhanced under enhanced CT, and endoscopic ultrasonography shows that there is no ulcer on the surface of the tumor and there is a liquid dark area inside. The peripheral lymphocyte count was 1.7 (×10 9 / L). The following table: datanewpatient<-data.frame(Long.Short.Diameter=1.053, CT.Value=33, Homogeneously.Enhanced=0, Ulcer=0, Liquid.Area=1, Lymphcte.Count=1.7)
[0103] Next, input the above data into the XGBoost prediction model and adjust the data format. After the calculation of the model, the final prediction result is output. like Figure 4 As shown, it can be seen that the calculated patient prediction value is 0.898, which is larger than the model prediction measurement value of 0.666 (intercept value), so the model output result is...
PUM
 Abstract
Description
Claims
Application Information