Raster data visualization method and system based on three-dimensional earth model

A technology of 3D earth and raster data, applied in the field of data visualization, can solve the problem of high complexity of 3D earth model re-creation, and achieve the effect of improving performance

Pending Publication Date: 2022-04-22
SUN YAT SEN UNIV
View PDF0 Cites 0 Cited by
  • Summary
  • Abstract
  • Description
  • Claims
  • Application Information

AI Technical Summary

Problems solved by technology

[0003] The present invention provides a raster data visualization method and system based on a three-dimensional earth model to solve the technical problem of high complexity in recreating the three-dimensional earth model when the resolution of the input data changes

Method used


Image

  • Raster data visualization method and system based on three-dimensional earth model
  • Raster data visualization method and system based on three-dimensional earth model
  • Raster data visualization method and system based on three-dimensional earth model

Examples


Embodiment 1

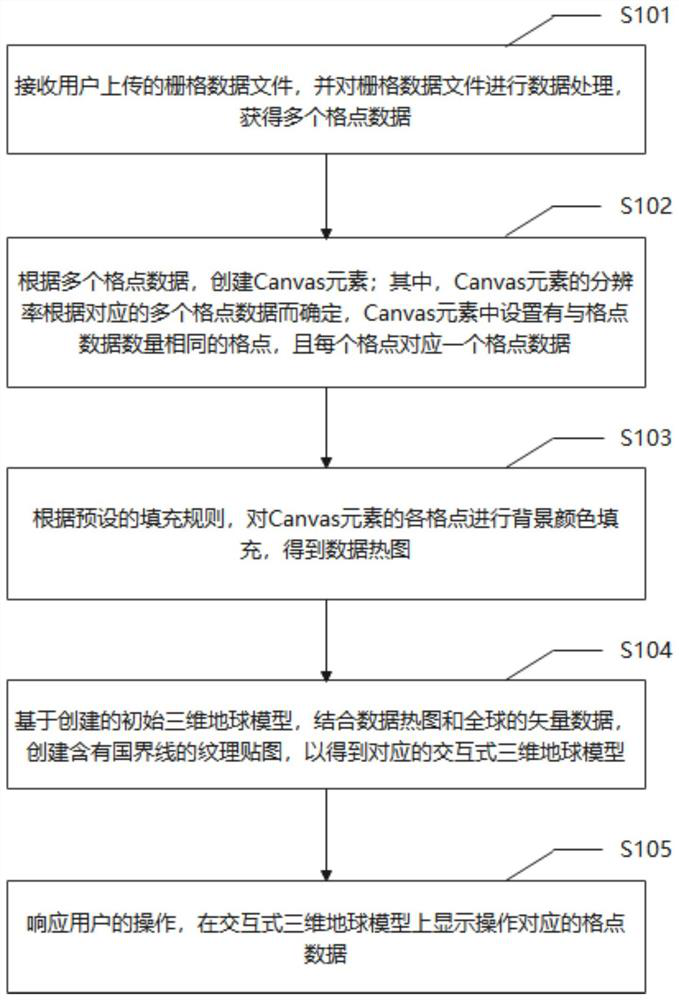
[0055] Please refer to figure 1 , a raster data visualization method based on a three-dimensional earth model provided in an embodiment of the present invention, including:

[0056] Step 101: Receive a raster data file uploaded by a user, and perform data processing on the raster data file to obtain multiple grid point data.

[0057] In this embodiment, the papaparse.js library is used to convert the raster data file in CSV format uploaded by the user into a two-dimensional Array object that is easy to handle in JavaScript, wherein the two-dimensional Array object includes multiple grid point data, which is convenient for subsequent data use. It is also possible to use other methods or software to convert the raster data file into a two-dimensional Array object containing multiple grid point data.

[0058] Step 102: Create a Canvas element according to multiple grid point data; wherein, the resolution of the Canvas element is determined according to the corresponding multipl...


PUM


Abstract

The invention discloses a raster data visualization method and system based on a three-dimensional earth model, and the method comprises the steps: receiving a raster data file uploaded by a user, and carrying out the data processing of the raster data file, and obtaining a plurality of pieces of lattice point data; according to the multiple pieces of lattice point data, Canvas elements are created, background color filling is carried out on all lattice points of the Canvas elements, and a data heat map is obtained; based on the created initial three-dimensional earth model, in combination with the data heat map and global vector data, creating a texture map containing a national boundary line to obtain a corresponding interactive three-dimensional earth model; and responding to the operation of the user, and displaying corresponding lattice point data on the interactive three-dimensional earth model. According to the method, the Canvas elements are created and subjected to background color filling by utilizing the lattice point data corresponding to the raster data file, then the texture map of the interactive three-dimensional earth model is obtained by combining the global vector data, and the visualization of the raster data is realized by responding to the user operation and displaying the corresponding lattice point data.

Description

technical field [0001] The invention relates to the technical field of data visualization, in particular to a grid data visualization method and system based on a three-dimensional earth model. Background technique [0002] With the rapid development of network communication technology and multimedia technology, a concept of three-dimensional earth that can embed geographical data and multi-resolution emerges as the times require. For a long time, for different research backgrounds and application purposes, people have established many visualization models based on various data types, algorithms, and mathematical theories based on the existing computer development level to display the earth, the earth's environment, and the activities on the earth in three dimensions. , to visualize the data. In the existing technology, based on the elevation data and image data processed by data layering and block processing, triangulation 3D earth models with different resolutions are cre...

Claims


Application Information

Patent Timeline
IPC IPC(8): G06T17/20G06T19/20G06T7/40G06F16/29
CPCG06T17/20G06T19/20G06T7/40G06F16/29
Inventor 朱丽叶吴臻
Owner SUN YAT SEN UNIV
Why Eureka
Try Eureka