Power consumption probability prediction method based on neural network

A probabilistic prediction and neural network technology, applied in the field of neural network-based power consumption probability prediction, can solve problems such as weak ability to capture time series features, unquantifiable prediction results, and inability to simultaneously process power consumption data of multiple users. The effect of improving accuracy and high-precision forecasting

Pending Publication Date: 2022-07-29
GUANGDONG UNIV OF TECH
View PDF0 Cites 0 Cited by
  • Summary
  • Abstract
  • Description
  • Claims
  • Application Information

AI Technical Summary

Problems solved by technology

[0006] In order to overcome the defects of the above-mentioned existing power consumption prediction technology, such as the weak ability to capture time series features, the inability to process the power consum

Method used


Image

  • Power consumption probability prediction method based on neural network
  • Power consumption probability prediction method based on neural network
  • Power consumption probability prediction method based on neural network

Examples


Example Embodiment

[0064] Example 1

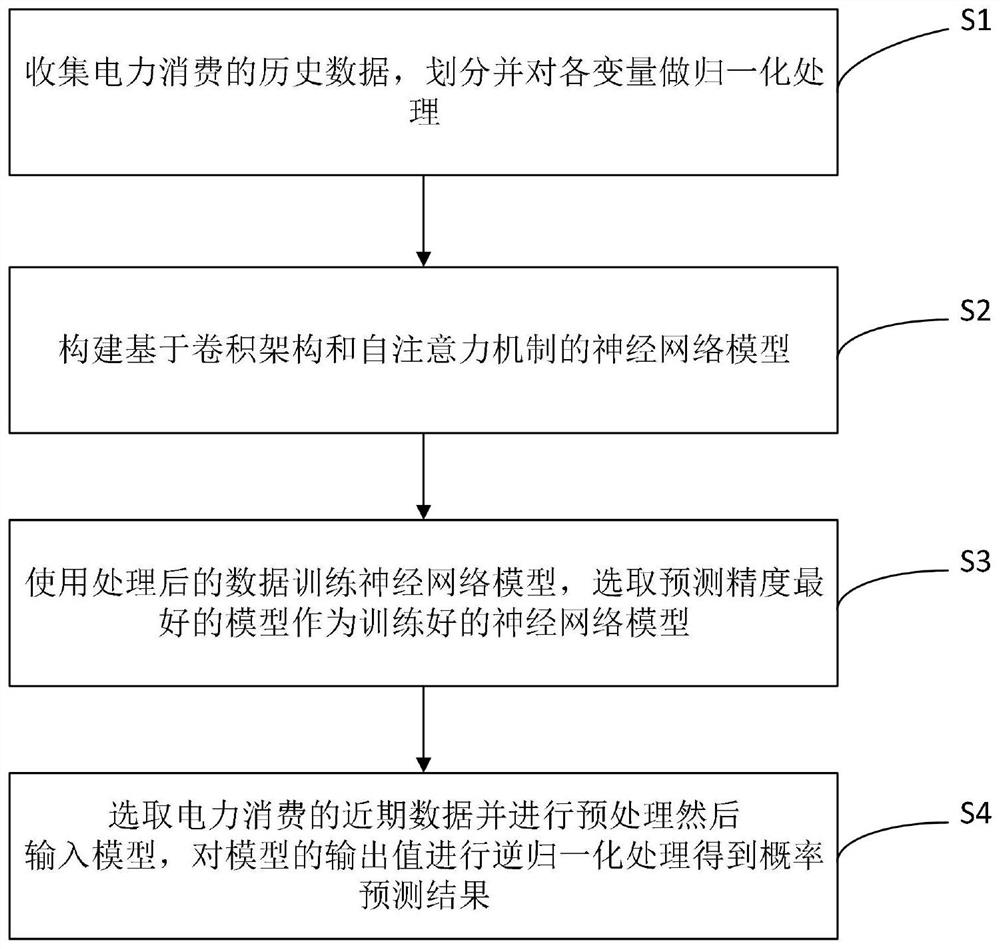
[0065] like Figure 1-Figure 2 As shown, the present invention provides a method for predicting power consumption probability based on a neural network, which specifically includes the following steps:

[0066] S1. Collect historical data of power consumption, divide it into a training set and a test set, and normalize the variables in the historical data.

[0067] S2. Build a neural network model based on a convolutional architecture and a self-attention mechanism.

[0068] S3. Use the processed training set data to train the neural network model, and use the test set to select the model with the best prediction accuracy as the trained neural network model.

[0069] S4: Select recent data of power consumption and perform preprocessing, input the preprocessed recent data into the trained neural network model, and perform inverse normalization on the output value of the model to obtain a probability prediction result.

[0070] Further, in step S1, the hist...

Example Embodiment

[0113] Example 2

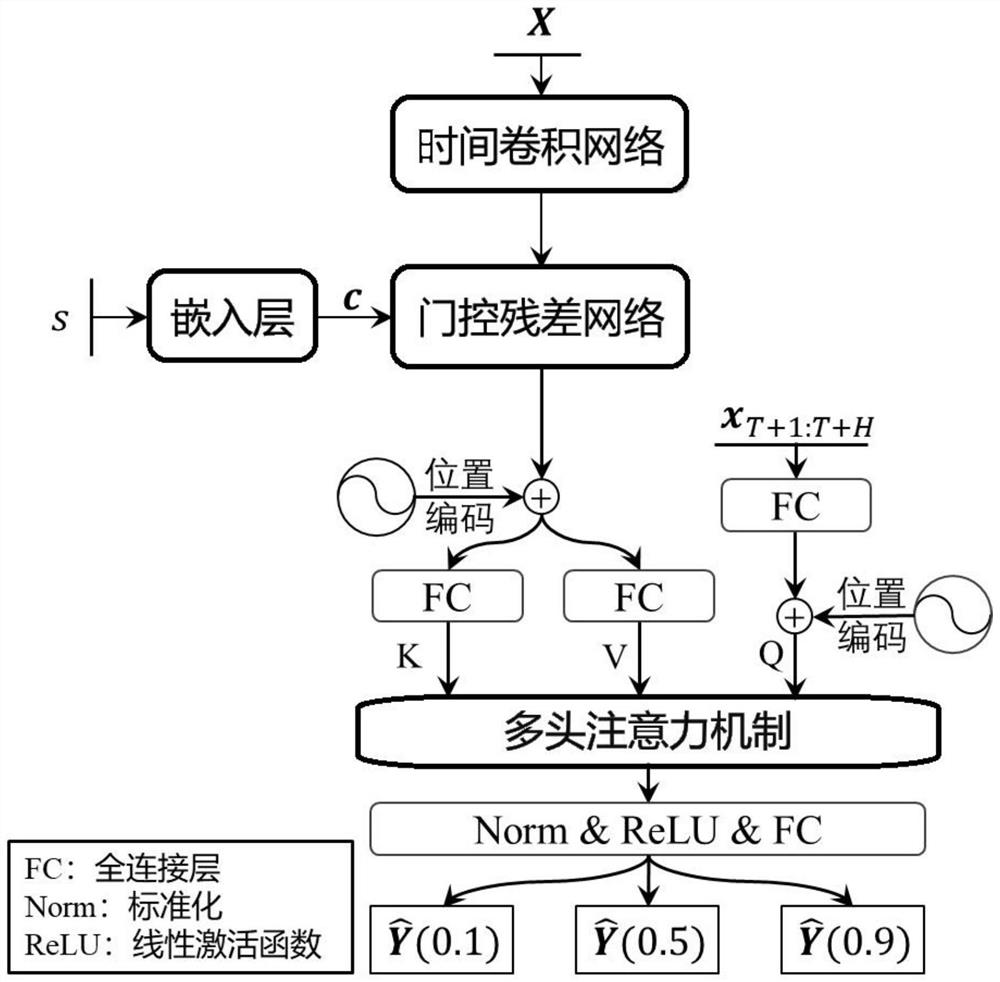
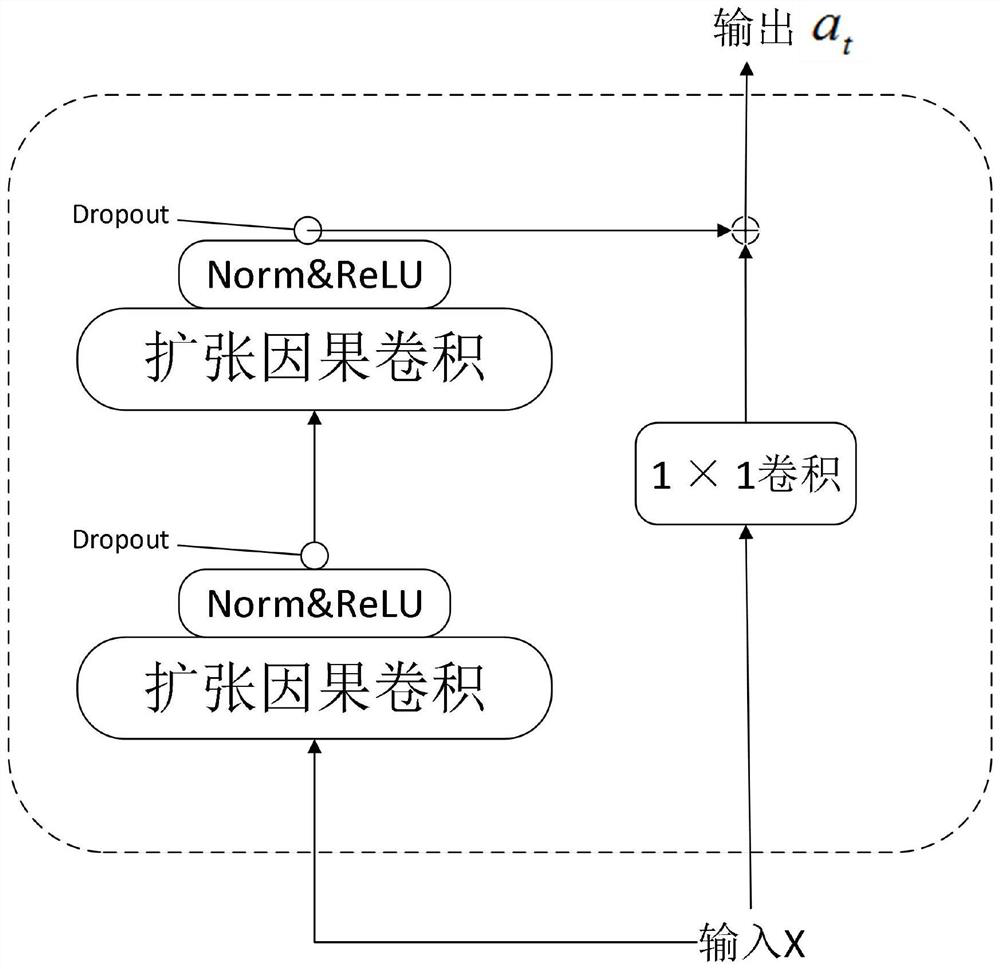
[0114] Based on the above embodiment 1, combined with Figure 2-Figure 4 This embodiment describes the specific content of the neural network model in detail.

[0115] For temporal convolutional network TCN, combining image 3 , in this embodiment, the size of the convolution kernel of the dilated causal convolution is set to 7, and the number of channels of the convolution kernel is 25, that is, the output dimension size after convolution processing is 25, and N is set to 4, that is, the total use of 8 layers of dilated causal convolution. Among them, the expansion factor of the i-th layer of dilated convolution is d=2 i .

[0116] In a specific embodiment, the input data X∈R 4×T , here represents a matrix data with 4 rows and T columns, the number of convolution kernel channels is 25, and the output matrix h∈R is obtained through the calculation of dilated causal convolution 25×T , and then perform the layer normalization operation Norm, and finally ...

Example Embodiment

[0140] Example 3

[0141] Based on the above Embodiment 1, this embodiment tests the prediction accuracy of the model based on the public data set ElectricityLoadDiagrams20112014, and the prediction task is set to predict the electricity consumption data of the next 24 hours based on the electricity consumption data of the past 168 hours.

[0142] The cleaned dataset contains hourly electricity usage data for 321 users from 2012 to 2014. In this simulation, the data from January 1, 2012 to June 7, 2014 is used as the training set, and the data from June 8, 2014 to December 31, 2014 is used as the test set to verify the prediction accuracy of the model. .

[0143] In order to more intuitively reflect the prediction effect of the model, a sample is randomly selected and its prediction result is visualized, such as Figure 5 As shown, the solid curve represents the true value, and the dashed curve represents the prediction result of the model location The gray range area indi...


PUM


Abstract

The invention discloses an electric power consumption probability prediction method based on a neural network, and the method comprises the following steps: collecting historical data of electric power consumption, dividing the historical data into a training set and a test set, and carrying out the normalization processing of all variables; constructing a neural network model based on a convolutional architecture and a self-attention mechanism; training a neural network model by using the processed training set data, and selecting a model with the best prediction precision as a trained neural network model by using the test set; recent data of power consumption are selected and preprocessed, the preprocessed recent data are input into the model, and an output value of the model is subjected to inverse normalization processing to obtain a probability prediction result. Compared with a traditional power load prediction method, the method has the advantages that modeling of power consumption data of different users in a power grid is achieved at the same time by means of the constructed neural network model, short-term and long-term modes in a time sequence can be captured, high-precision prediction of the time sequence is achieved, and a point prediction result and a probability prediction result are output.

Description

technical field [0001] The invention relates to the field of power consumption probability prediction, and more particularly, to a power consumption probability prediction method based on a neural network. Background technique [0002] In recent years, with the rapid development of deep learning, many methods based on neural network for time series prediction have appeared one after another: DeepAR model based on long short-term memory network (LSTM), temporal convolution based on convolutional neural network (CNN) Network (Temporal Convolution Networks, TCN), Transformer model based on attention mechanism (Attention). These existing deep learning-based methods have achieved good forecasting accuracy on time series forecasting tasks. [0003] The above deep learning-based time series prediction architecture also has some problems. The recurrent neural network (RNN) has the problem of gradient disappearance and gradient explosion, and LSTM cannot model too long sequences. F...

Claims


Application Information

Patent Timeline
IPC IPC(8): G06Q10/04G06Q30/02G06Q50/06G06N3/04G06N3/08
CPCG06Q10/04G06Q30/0201G06Q30/0202G06Q50/06G06N3/049G06N3/08G06N3/045
Inventor 叶佳锐刘德荣王永华
Owner GUANGDONG UNIV OF TECH
Why Eureka
Try Eureka