

Method of predicting oil product quality using chromatography mass spectrometry combined method
A property and predictive model technology, applied in the direction of measuring devices, material inspection products, instruments, etc., can solve the problems of cumbersome modeling and value selection methods, and achieve the effects of short measurement time, simple modeling method, and shortened analysis time
- Summary
- Abstract
- Description
- Claims
- Application Information
AI Technical Summary
Problems solved by technology
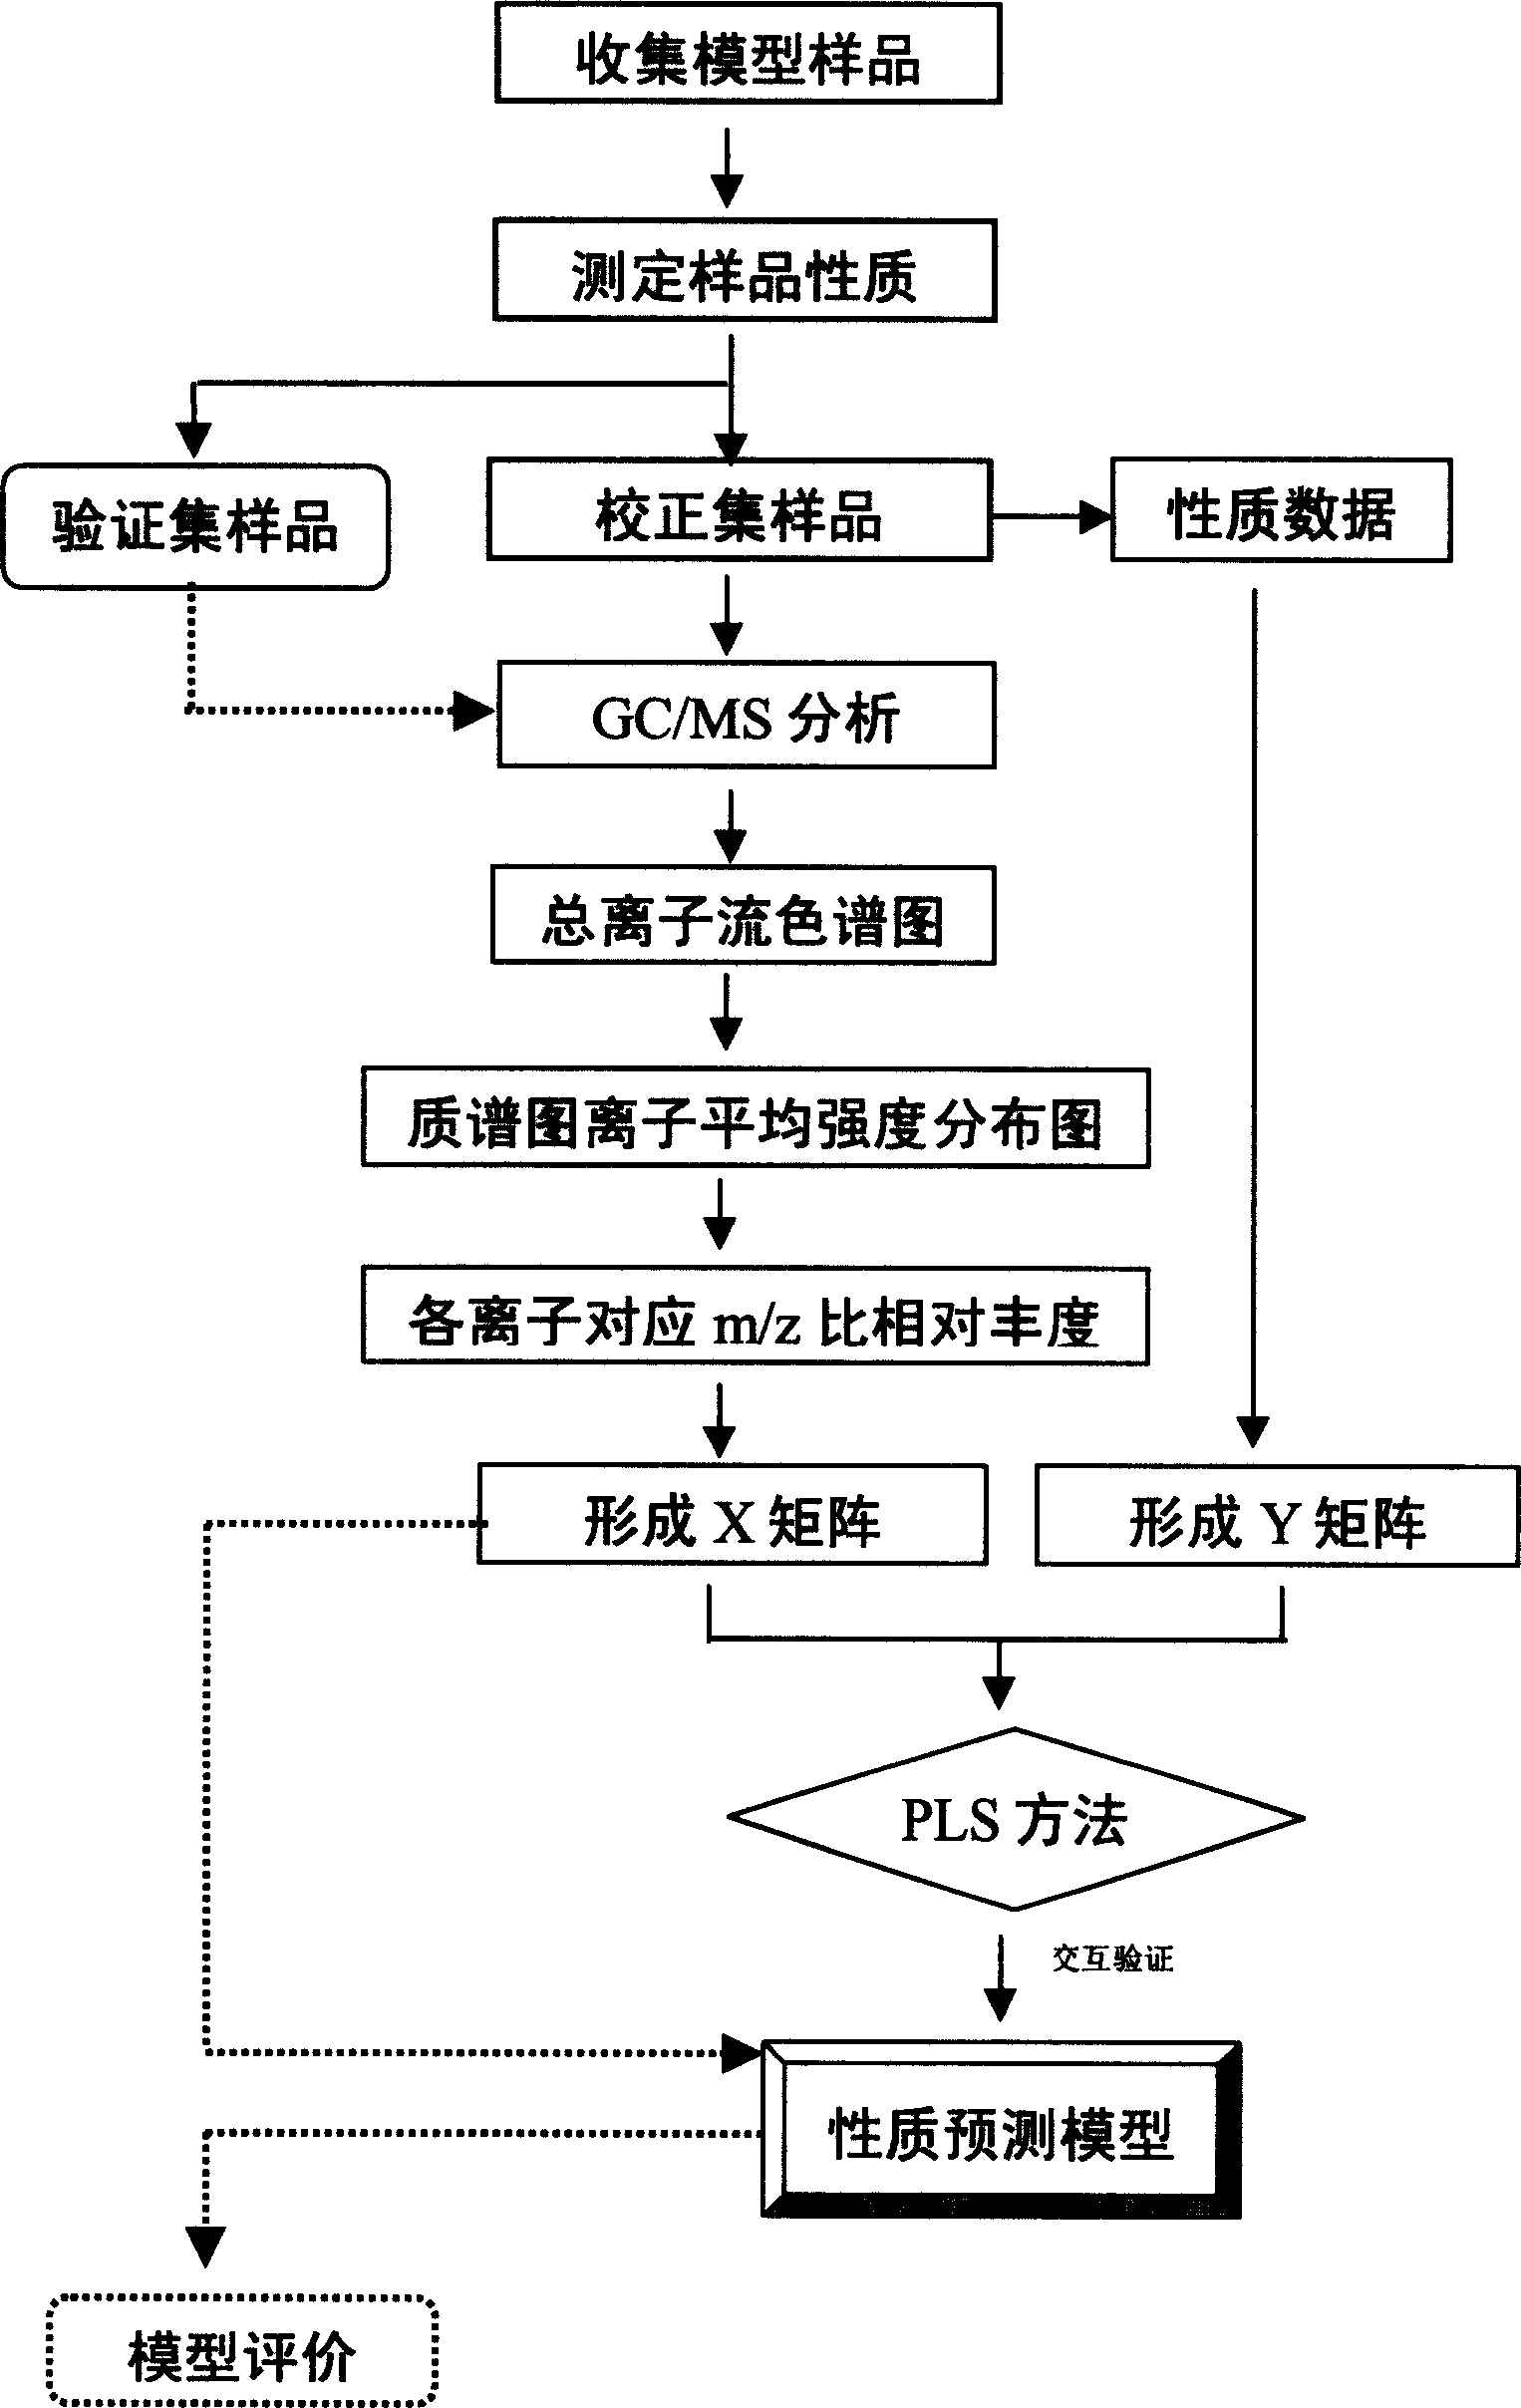
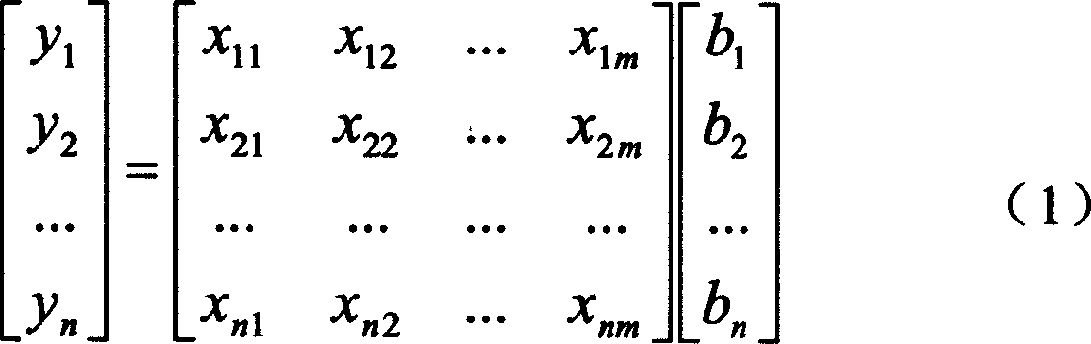
Method used
Image

Examples
example 1
[0056] A prediction model for straight-run diesel aniline point was established.
[0057] (1) Establishment of diesel sample set and measurement of aniline point properties
[0058] Taking straight-run diesel oil with a boiling point range of 200-350°C as samples, 68 typical samples were collected as model samples of aniline point, and the aniline point was determined by GB / T262-88 method. Among them, there are 56 samples in the calibration set and 12 samples in the validation set.
[0059] (2) Establish a prediction model and verify it
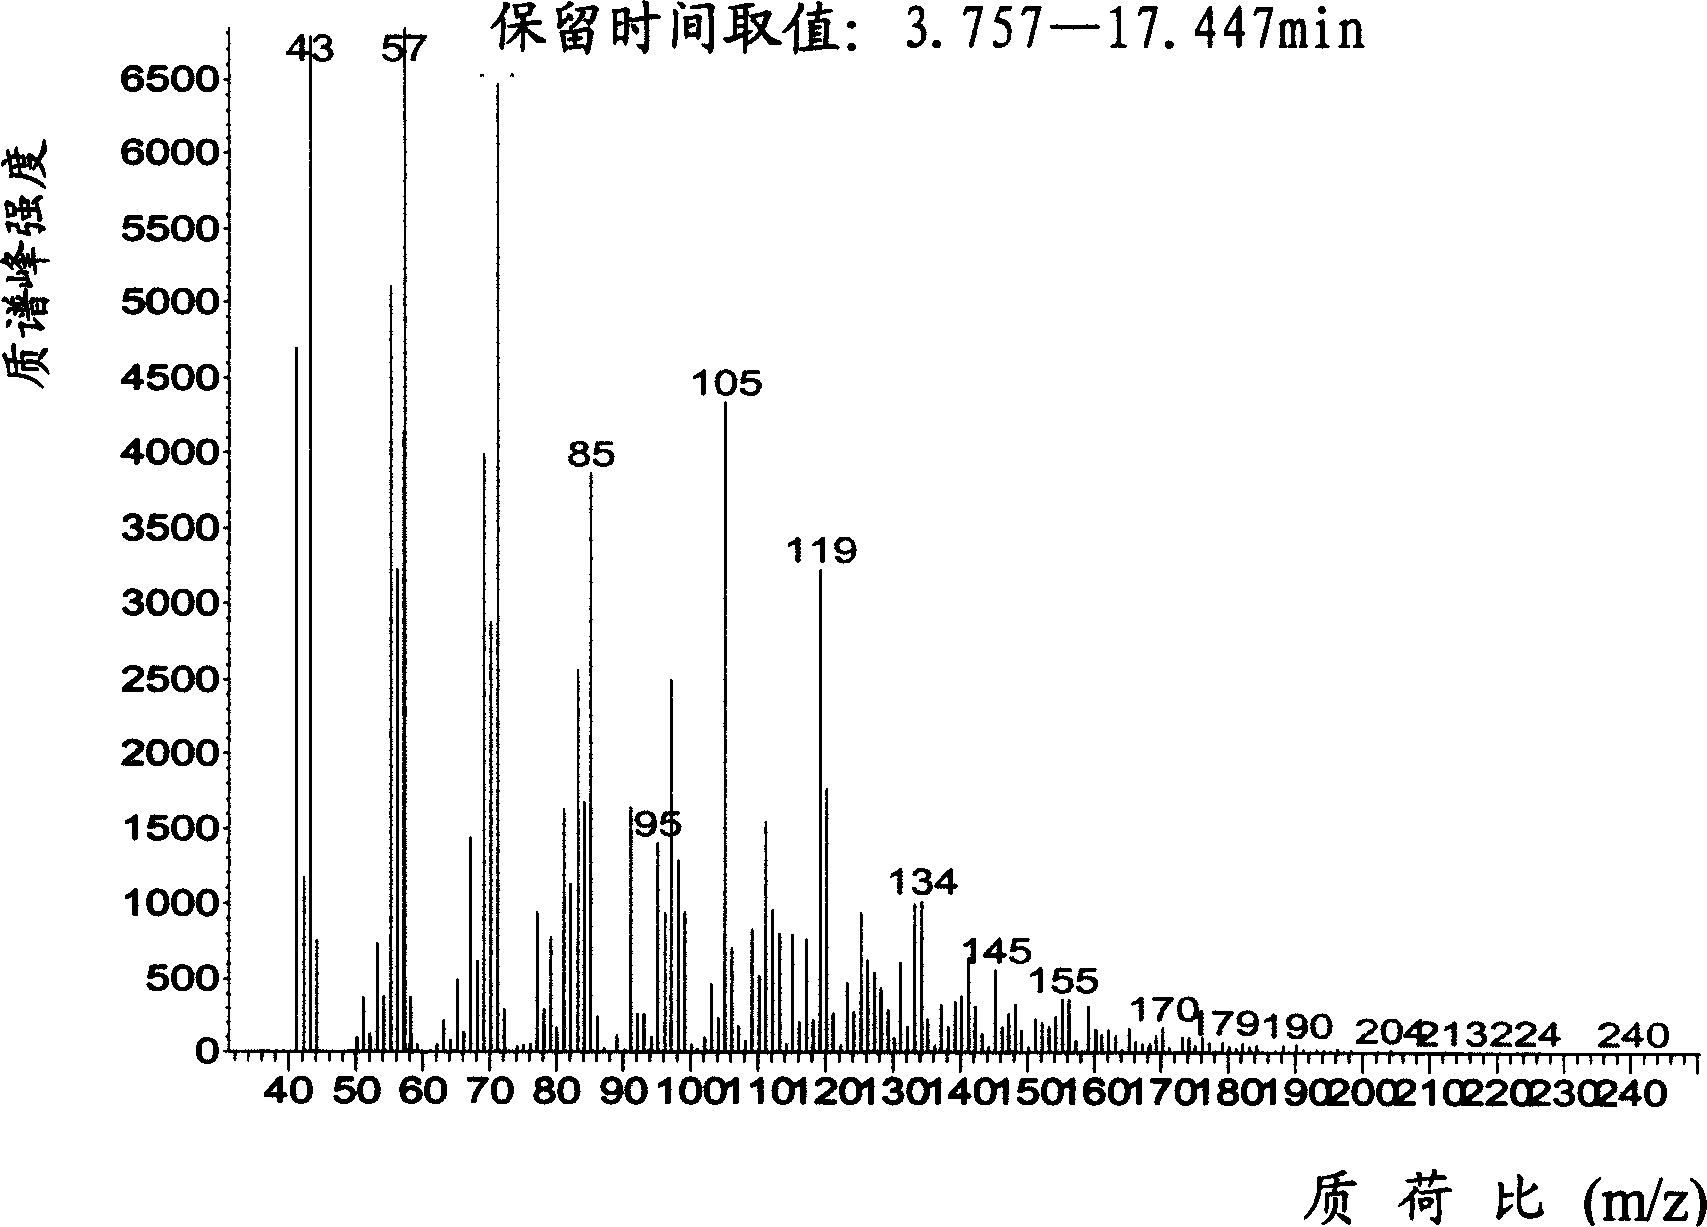
[0060] The temperature program of the chromatographic instrument is controlled as follows: initial 50°C, then rise to 280°C at 10°C / min; inject 0.1 microliter of the calibration set sample into the chromatographic injector, and then pass it into the mass spectrometer after chromatographic separation. The retention time range of the diesel fraction was determined from the total ion chromatogram of the color-mass spectrometer. The distributi...
example 2
[0067] A prediction model for straight-run kerosene viscosity (20°C) was established.
[0068] (1) Establish a kerosene sample set and measure the viscosity of kerosene at 20°C
[0069] Taking straight-run diesel oil with a boiling point range of 150-250°C as samples, 47 typical samples were collected as 20°C viscosity model samples, and the 20°C viscosity of each sample was measured by GB / T265-88 method. Take 36 samples as the calibration set, and 11 randomly selected samples as the validation set.
[0070] (2) Establish a prediction model and verify it
[0071] Obtain the mass spectrogram of each sample in the calibration set according to the method of Example 1, the difference is that the temperature program of the chromatograph is controlled as follows: initial 50°C, then rise to 220°C at 10°C / min, when calculating the relative abundance of the sample, the selected The MS scanning range is 41.0-250.0 aum.
[0072] The relative abundance values of the mass spectrograms...
example 3
[0077] A prediction model for straight-run gasoline density (20°C) was established.
[0078] (1) Establish gasoline density sample set and measure gasoline viscosity at 20°C
[0079] Using straight-run gasoline with a boiling point ranging from initial boiling point to 200°C as samples, 77 samples were collected as 20°C density model samples, and the density of each sample was determined by the method GB1884-83. Take 53 samples as the calibration set, and 14 randomly selected samples as the validation set.
[0080] (2) Establish a prediction model and verify it
[0081] Obtain the mass spectrum of each sample in the calibration set according to the method of Example 1, the difference is that the temperature program of the chromatograph is controlled as follows: initial 50°C, then rise to 180°C at 10°C / min, when calculating the relative abundance of the sample, the selected The MS scan range is 41.0-200.0 aum.
[0082] The relative abundance values of the mass spectra of e...
PUM
 Abstract
Description
Claims
Application Information