Systems and methods for lossy data compression using key artifacts and dynamically generated cycles

a lossy data and key artifact technology, applied in the field of data processing, can solve the problems of high turbulence of data streams and repetition of similar data, and achieve the effects of reducing the size of data, high signal to noise ratio, and high turbulen

Active Publication Date: 2019-12-17
GUPTA DEV
View PDF9 Cites 0 Cited by
  • Summary
  • Abstract
  • Description
  • Claims
  • Application Information

AI Technical Summary

Benefits of technology

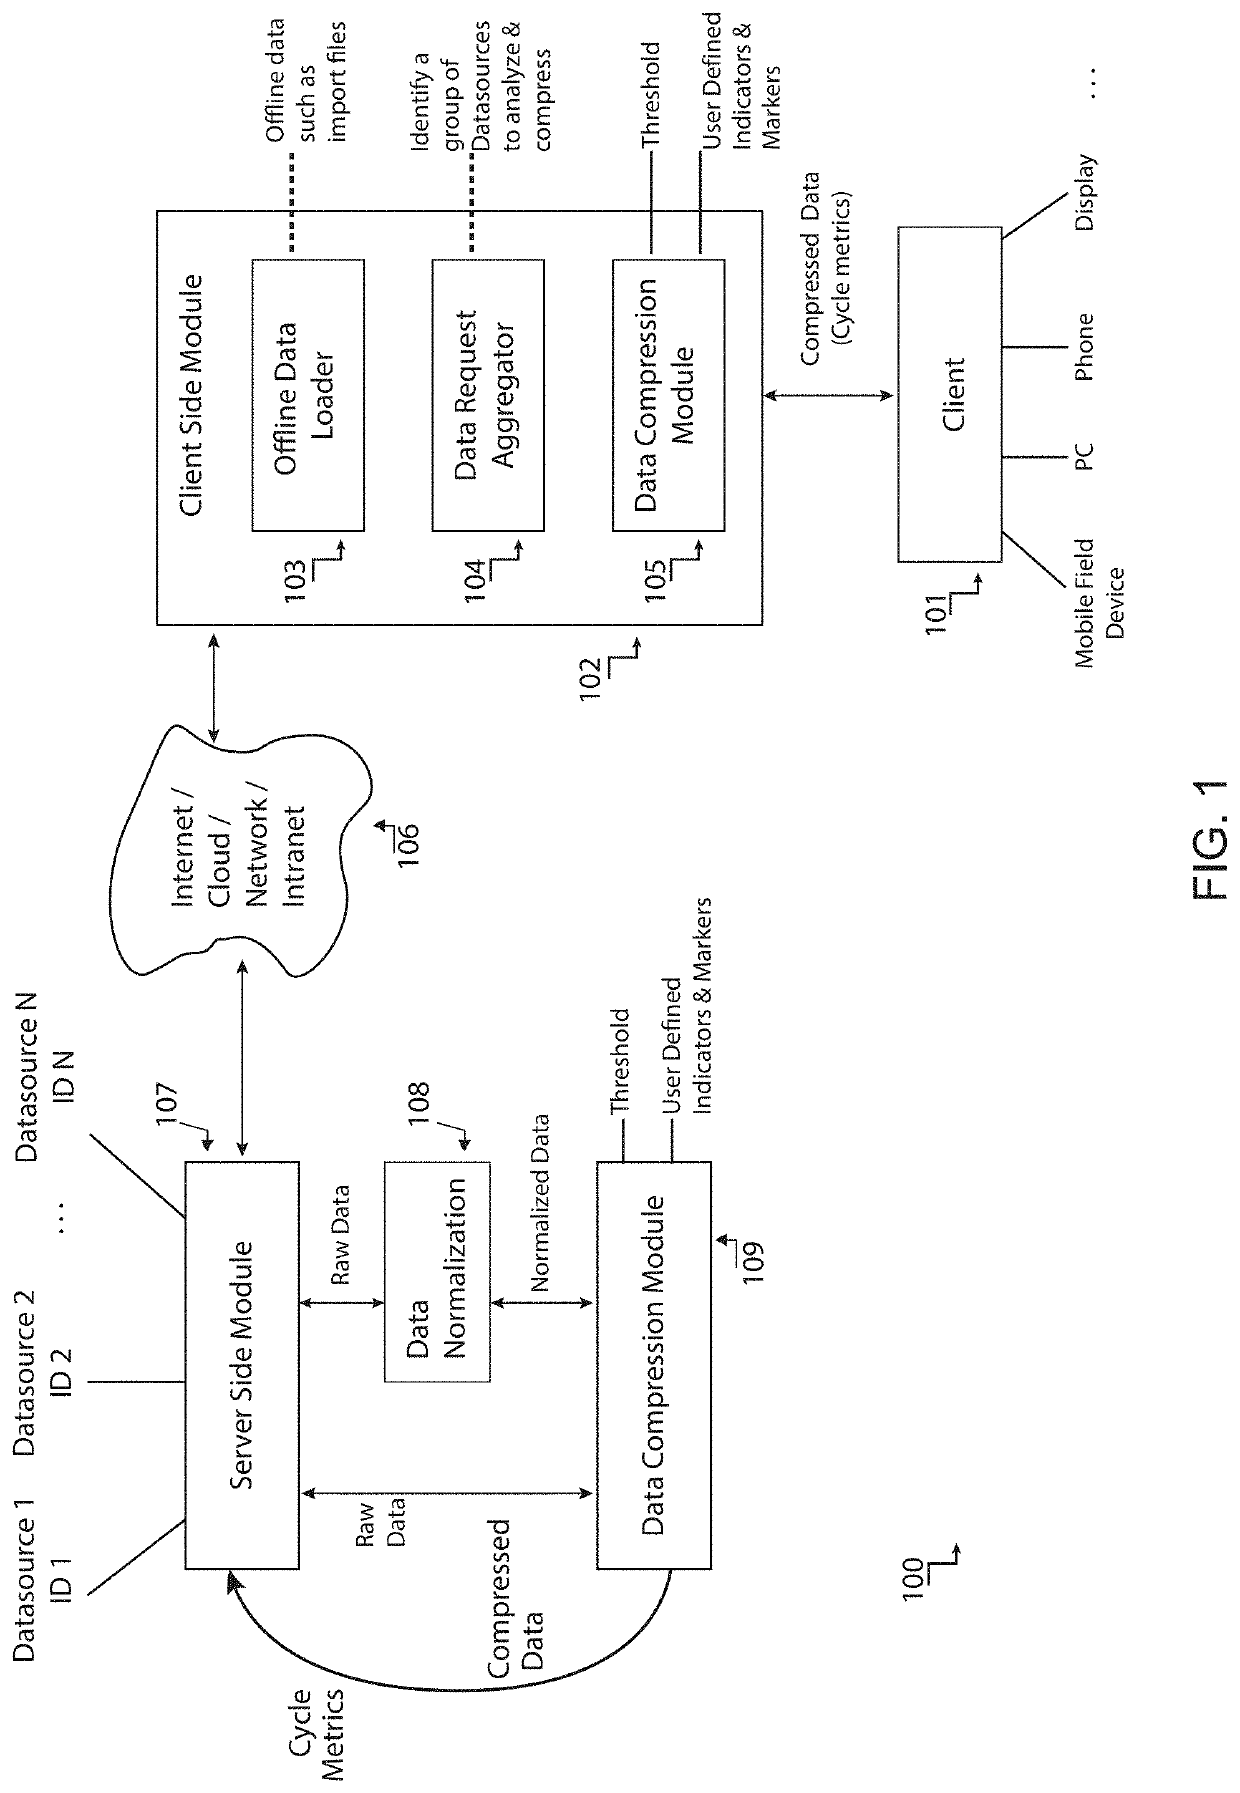
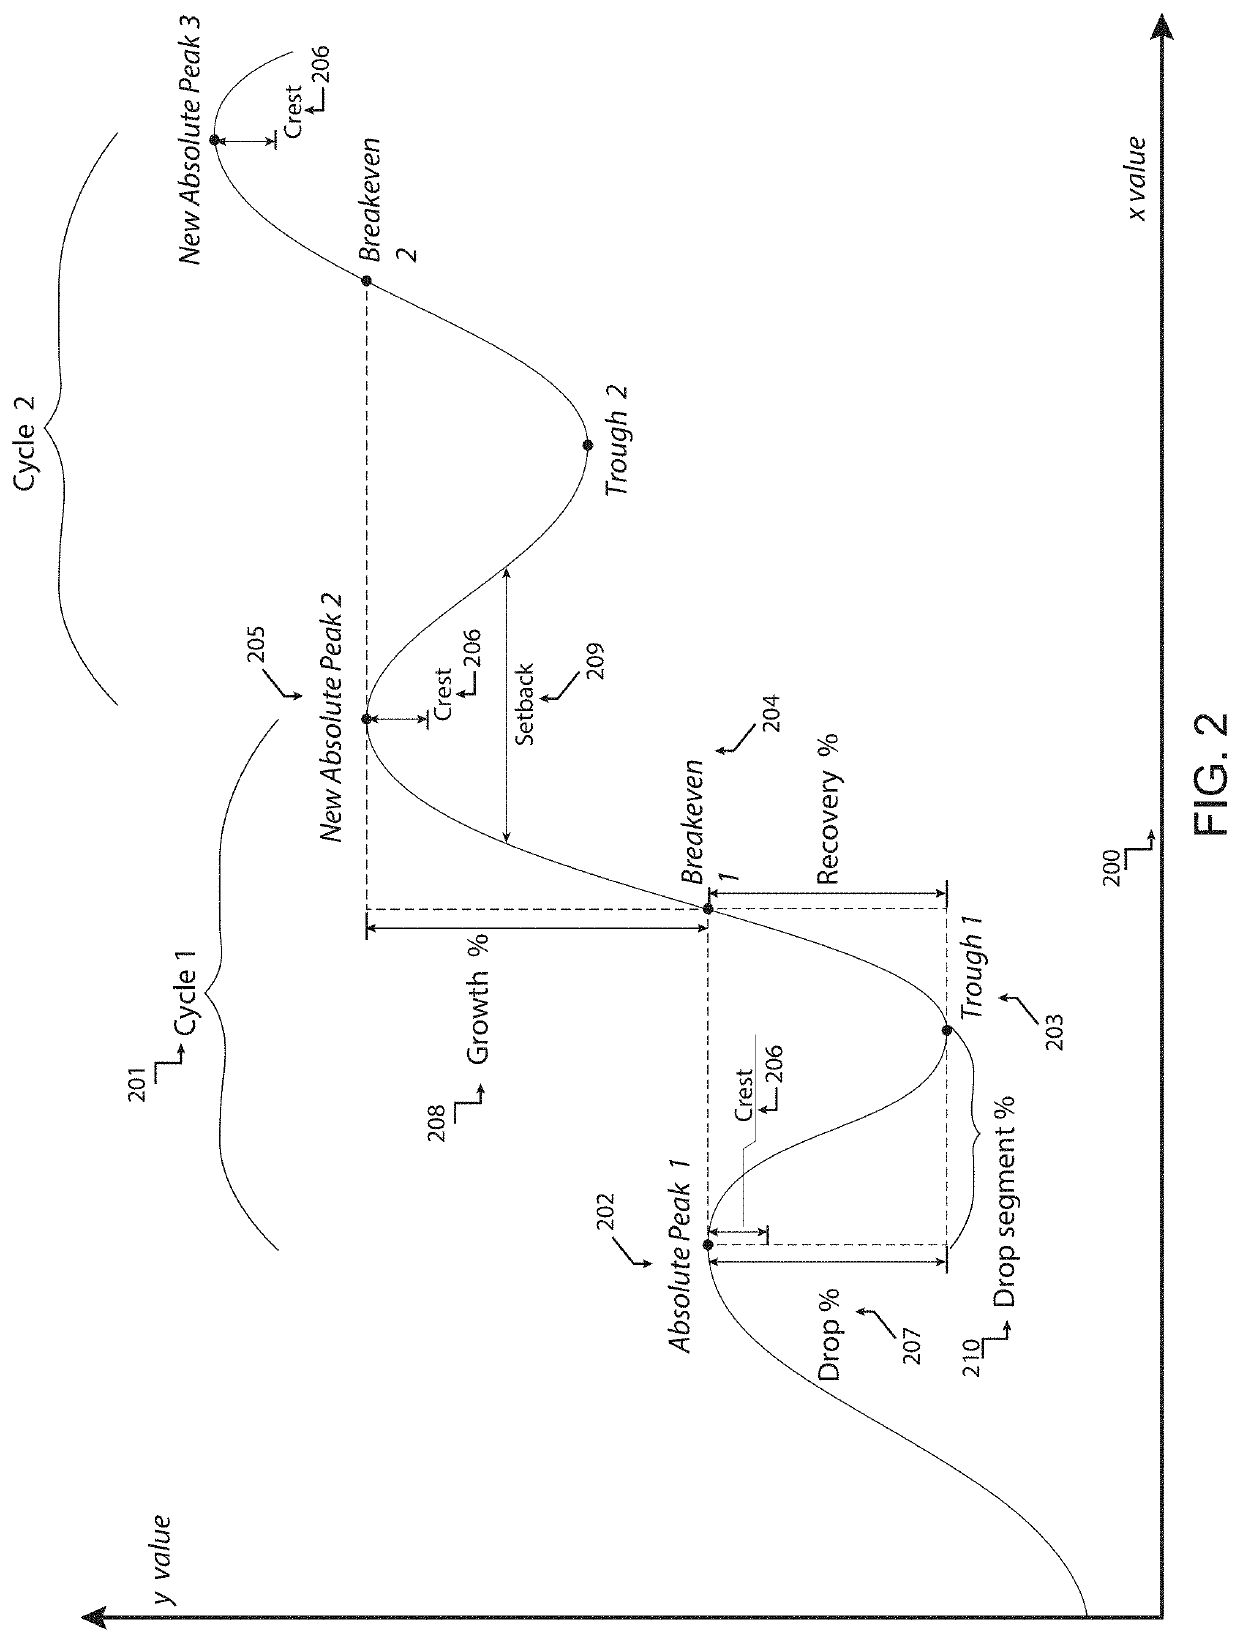
[0006]The subject matter discussed herein includes methods for compressing data streams into a series of metrics including, but not limited to, dynamically finding key artifacts such as high points (peak points), low points (trough points), breakeven points, interval points, user defined points and generating the percentage difference between these artifacts, which is called cycle metrics. Many data streams have a high signal to noise ratio, and the lossy compression scheme discussed herein can take advantage of this by filtering out the noisy data that may be unimportant to the user, and keep the data that may be relevant to the user. Data streams can have high turbulence and repetition of similar data. The change in the turbulence can sometimes be the most relevant signal in the data. This data processing mechanism can identify and characterize changes in the turbulence and can vastly reduce the size of the data and also may enhance the signal quality to the user.
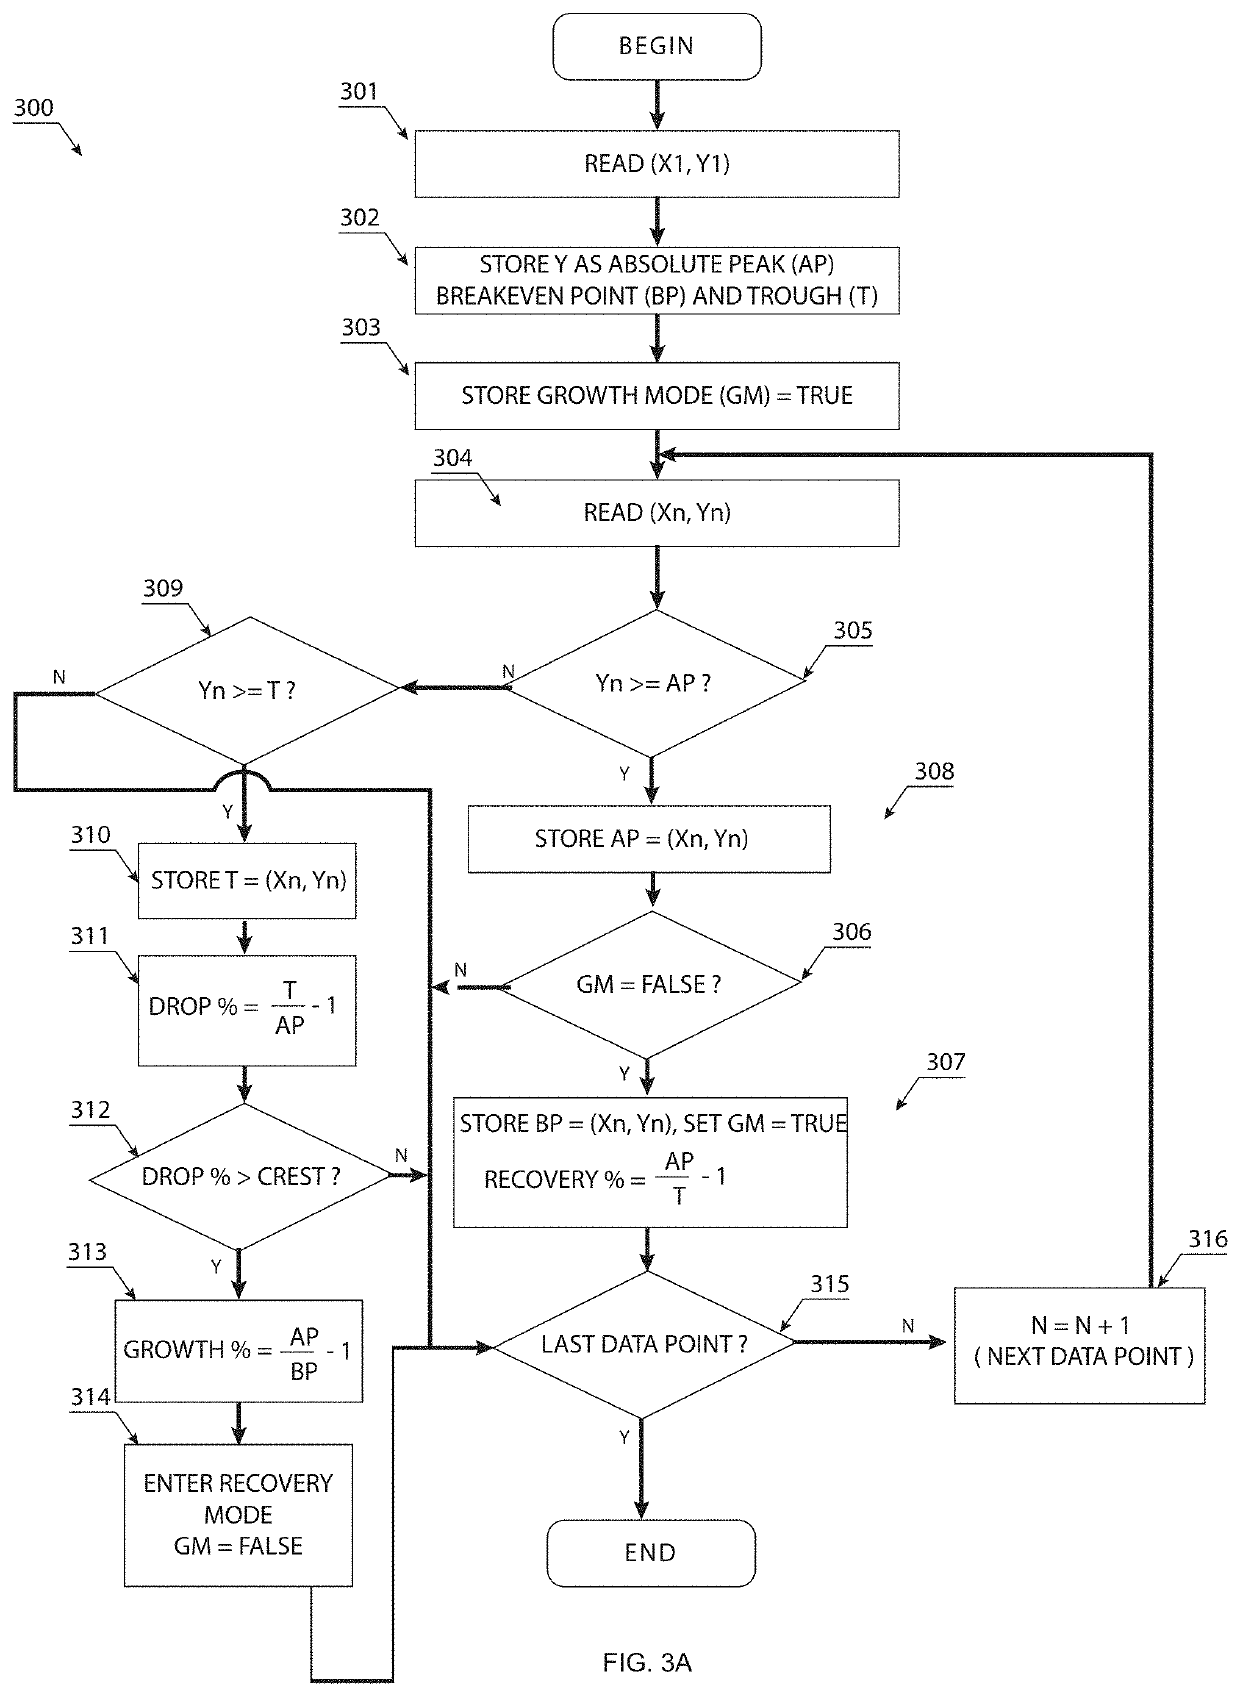
[0008]The subject matter includes methods for implementing compression to generate a series of cycle metrics including receiving a data stream of relational data; detecting a key artifact in the data stream associated with a critical point in the relational data; analyzing the key artifact to determine a set of artifacts associated with a complex event where the critical point is an endpoint of the complex event; calculating one or more cycle metrics based on the set of artifacts; generating a data structure to describe the complex event and cycle metrics; and providing the data structure for marking a display of the relational data with the complex event based on the cycle metrics. The compressed data can be efficiently processed, transferred, analyzed, compared, stored and visualized. The computational effort to compress the data stream at various resolutions can be divided between the client and server, and load balanced as needed.

Problems solved by technology

However, the design of data compression schemes involves trade-offs among various factors.
Data streams can have high turbulence and repetition of similar data.

Method used


Image

  • Systems and methods for lossy data compression using key artifacts and dynamically generated cycles
  • Systems and methods for lossy data compression using key artifacts and dynamically generated cycles
  • Systems and methods for lossy data compression using key artifacts and dynamically generated cycles

Examples


example application

[0105]EKG Potential Data Stream

[0106]FIG. 9 shows an EKG Potential data stream where potential is on the Y axis and time is on the X axis. An absolute peak is indicated on the chart at point 901, followed by trough at 902, a breakeven point at 903, and a new absolute peak at 904. Using these key artifacts, the cycle metrics can be computed, including drop, recovery, and growth percentages.

[0107]The threshold is reset when the data stream crosses the threshold reset level at 905. At this point, the previous absolute peak is ignored and it is assumed the data stream may not recover to that level. Normally, the point at 906 would be classified as an intermediate peak; however, since the threshold was reset at the 905, the peak at 906 is reclassified to an absolute peak.

[0108]A heart attack can be associated with either an elevated drop percentage from the absolute peak 904 to the trough 908, or an elongated (larger than normal) drop segment percentage at 907. In comparing EKG data stre...


PUM


Abstract

Systems and methods for lossy data compression using key artifacts and dynamically generated cycles are described, including receiving a data stream of relational data; detecting an artifact in the data stream associated with a critical point in the relational data; analyzing, by a processing device, the artifact to determine a set of artifacts associated with a complex event where the critical point is an endpoint of the complex event; calculating one or more cycle metrics based on the set of artifacts; generating a data structure associated with the complex event and cycle metrics; providing the data structure for marking a display of the relational data with the complex event based on the cycle metrics.

Description

BACKGROUND[0001]Field[0002]Aspects of the example implementations discussed herein relate generally to data processing and, more particularly, to the summarization, distribution, compression, storage, and visualization of compressed data using a series of dynamically generated cycles.[0003]Related Art[0004]Related art data sources are analyzed and compressed at a networked server device or a client device. Compression is used in the related art to process data and / or transfer the data with fewer bits than the original representation. Typically, compression helps to optimize resources, including transmission, latency, capacity, power, and data storage. However, the design of data compression schemes involves trade-offs among various factors. In lossy data compression schemes, the tradeoff can involve dropping detail from the data source to improve central processing unit (CPU) utilization, improve network transmission, and permit quick comparisons and visualizations. Comparisons may ...

Claims


Application Information

Patent Timeline
Patent Type & Authority Patents(United States)
IPC IPC(8): G06F16/2455G06F16/25G06F16/248
CPCG06F16/24568G06F16/248G06F16/258G06Q20/08H04L61/00H04L67/60H04L67/1001
Inventor GUPTA, DEV
Owner GUPTA DEV
Why Eureka
Try Eureka