Systems and processes for labeling hydraulic fracture data using acoustic emitters for supervised learning algorithm mapping and classifying of hydraulic fractures in wells

a technology of hydraulic fracture and labeling system, applied in seismology for waterlogging, borehole/well accessories, instruments, etc., can solve the problems of inability to substitute, inability to accurately predict the half-length error of the propped fracture, and inability to carry indelible uncertainty, so as to reduce the quantity of acoustic micro-emitters, reduce the cost of oil and gas operators, and efficiently determin

Active Publication Date: 2020-02-25
WILLINGER JONATHAN R
View PDF1 Cites 6 Cited by
  • Summary
  • Abstract
  • Description
  • Claims
  • Application Information

AI Technical Summary

Benefits of technology

The fiber optic seismic sensor, acoustic micro-emitters and electromagnetic induction process and apparatus to measure conductive proppant are great, developing improvements, but they did not show any development of a stage by stage, granular, conditional testing analysis protocol that maps the rate of the propped fracture dimension growth in real-time as measured from these new, improved sensing technologies and proppant-form-factor diagnostics for widely-used, industry-standard proppants. That is, the prior art omits a solution for directly, accurately and rapidly monitoring the rate of growth of the primary control on hydraulically fractured, multi stage, unconventional wells—the propped fracture half length (Warpinski & Wolhart, 2016). Moreover, because the prior art does not exhibit a solution to monitor all of the propped fracture dimensions in real-time, their direct contribution to phenomena such as fracture height containment, stress shadowing and so forth is vague on a per well basis (Warpinski & Wolhart, 2016). Thirdly, it is desirable to reduce the quantity of acoustic micro-emitters necessary to analyze and distinguish the propped fracture dimensions from the unpropped fracture dimensions in order to reduce costs to the oil and gas operator. Thus, the embodiments of this process and apparatus invention provide a real-time labeling protocol so that the propped fracture growth can be measured and analyzed in real time as it occurs—not just merely the final dimensions at the end of the pumped stage—so that stage by stage, conditional testing may be performed and the results visualized during pumping. These embodiments of this invention enable the stage spacing of a hydraulically fractured well to be optimized as the pump rate, proppant density, proppant mesh size, fluid viscosity, treating pressure and other treatment parameters can be varied and their effect on the propped fractures' dimensions measured from microseisms recorded by highly sensitive seismic sensors and processed in real time through a machine learning algorithm that was trained from previously labeled stage data. This enables oil and gas operators to test stage spacing granularly in real-time, and for the first time in the industry's history, to use a direct, distinct signal delineating the propped fracture dimensions to initialize a machine learning process that directly maps the propped fracture network growth with certainty obtained from labeled input features of (a) prior stage(s). Thus, these embodiments will almost certainly enable operators realize multi-million dollar savings per field in stage spacing design and implementation since they re-evaluate their selection of pump rates, proppant densities, proppant mesh sizes, fluid viscosities, treating pressures and other treatment parameters. Operators will much more efficiently determine if it is more economical to design fewer, larger stage treatments and create larger volumes of high fracture conductivity, producing reservoir rock or instead design more, smaller, lower cost stage treatments that yield comparable production.
Moreover, these embodiments also enable well spacing to be optimized for the same reasons, and these embodiments enable operators to correlate the observed propped fracture growth to the acquired input features and conduct a post treatment analysis of the effective fracture lengths of the propped fracture lengths. This will allow the operators to plan new well tests which can measure the propped fracture dimensions with sufficient accuracy and precision to evaluate the loss of the conductivity in the propped fracture dimensions due to proppant crushing, proppant embedment, gel damage and so forth. This will ultimately lead to a lower completion and production cost per hydraulically fractured well per volume of hydrocarbon production, and it will stimulate more innovation.

Problems solved by technology

Therefore, the state of the art process for determining the propped fracture dimensions in a fractured well contains indelible uncertainty and easily may have a propped fracture half-length error greater than one hundred feet due to a lack of direct measurement and questionable modelling assumptions.
These incremental improvements are useful; however, they cannot substitute for the ability to yield a distinct signal that can delineate the propped fracture dimensions from the total fracture dimensions.
However, these hardware and processing improvements in the signal fidelity and speed at which the microseisms can be identified are still limited and cannot map the propped fracture region—the primary control on production in multi-fractured, horizontal wells in unconventional resource plays (Warpinski & Wolhart, 2016).
Therefore, due to the assumptions of the DFN and fracture-propagation modelling workflows and post-treatment history matching methods, there lies large uncertainty in the propped fracture dimensions and complexity for each stage despite these hardware and processing improvements.
These proppant-form-factor diagnostics are currently being developed and pose great value; however, there currently remains no real-time analysis protocol to map the propped fracture dimensions with certainty and delineate them from the total fracture network as the propped fractures propagate in the subsurface—a process that often exceeds two hours—for industry-standard proppants.
However, perhaps due to the high noise floor that occurs during treatment and the physical limit of the magnitude of the signal a proppant-form-factor diagnostic can yield, industry has not perceived how to improve on the prior and current art successfully.
However, these modelling techniques are clearly not sufficient to reliably reduce the propped fracture half-length estimate error to less than 100 feet because there was not a direct diagnostic technology to provide a unique measurement of the propped fracture length.
However, a real time analysis methodology of the propped dimensions using these proppant-form-factor diagnostics in conjunction with repeatedly-used, economical, conventional proppants has not been developed despite the tremendous effort to 1) understand the propped fracture dimensions and 2) create a workflow to optimize well completion design from propped fracture dimensions and contact within the reservoir.

Method used


Image

  • Systems and processes for labeling hydraulic fracture data using acoustic emitters for supervised learning algorithm mapping and classifying of hydraulic fractures in wells
  • Systems and processes for labeling hydraulic fracture data using acoustic emitters for supervised learning algorithm mapping and classifying of hydraulic fractures in wells
  • Systems and processes for labeling hydraulic fracture data using acoustic emitters for supervised learning algorithm mapping and classifying of hydraulic fractures in wells

Examples


first embodiment

Operation of FIGS. 3A-3S, 4A & 4B, and 5.

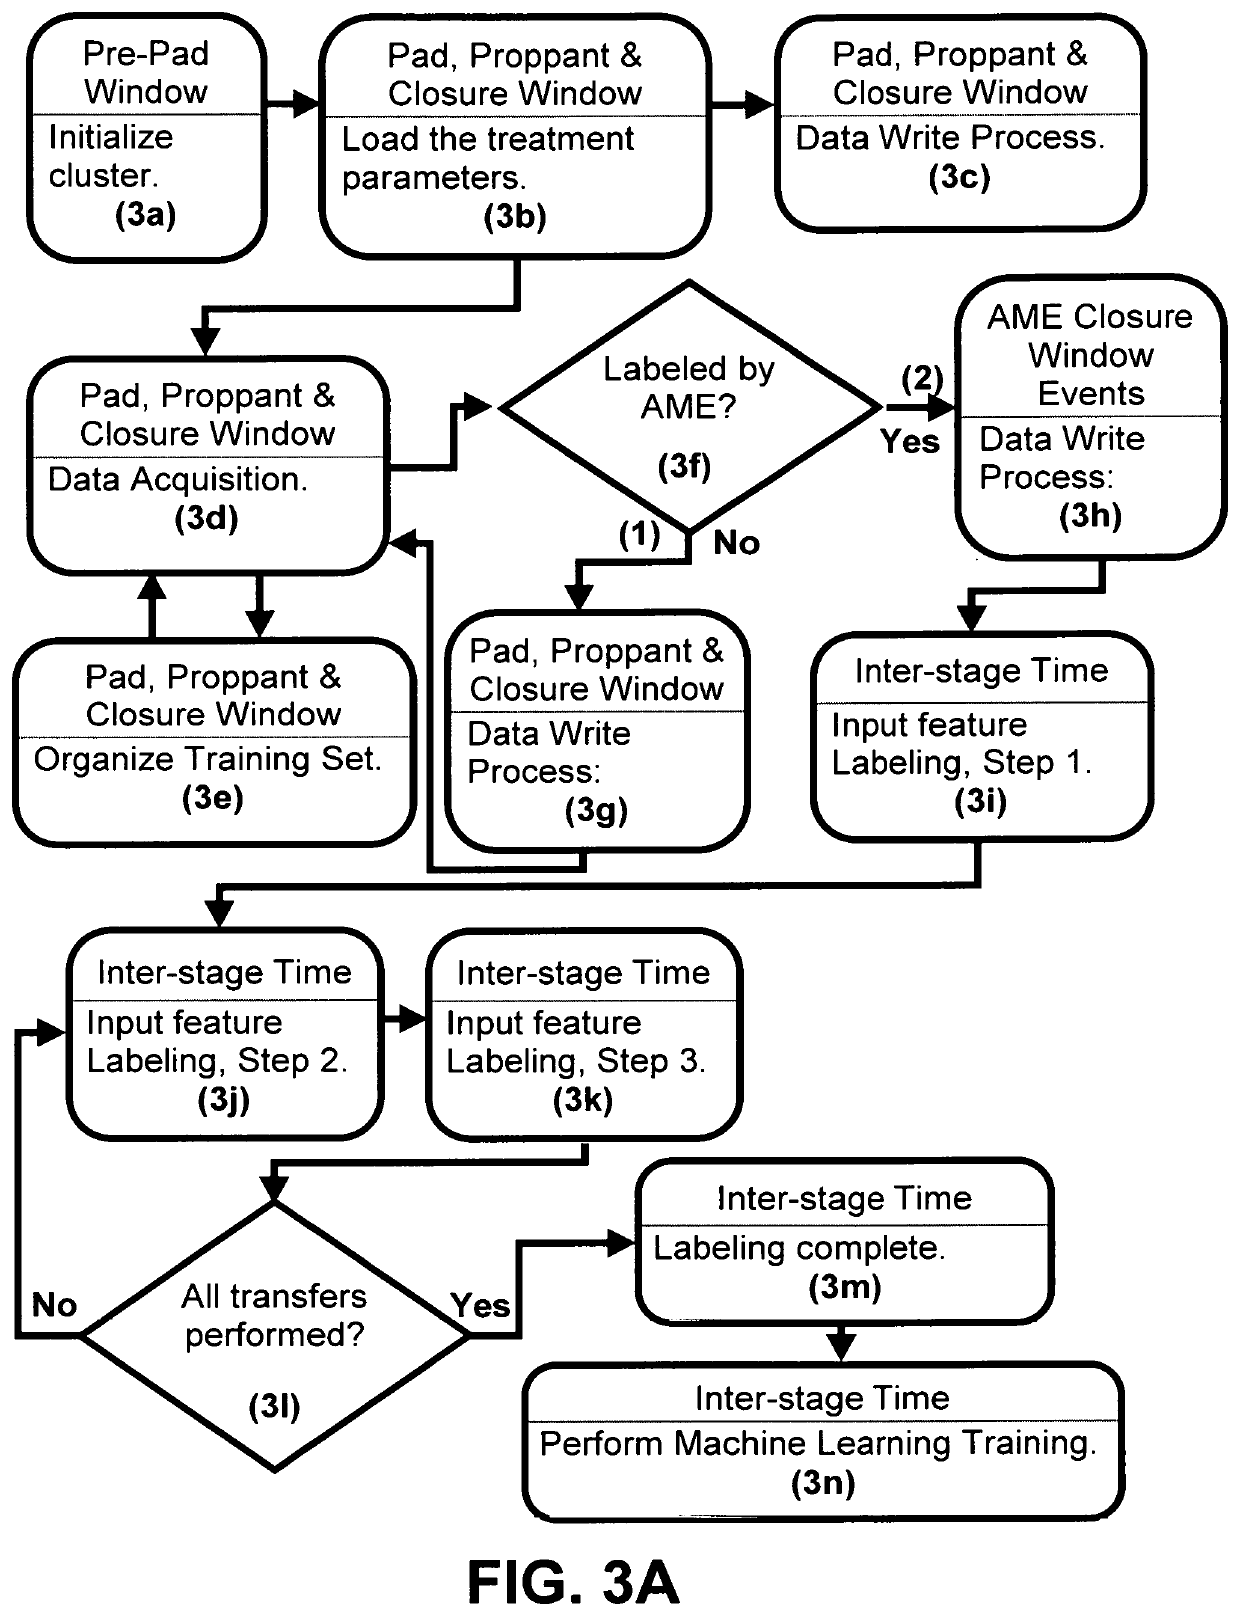
FIG. 3A presents a small-scale view of FIGS. 3B-3I. As illustrated in FIG. 3B, the cluster is first initialized (3a) ensuring the computing resources and hardware are sufficient for the job's 1) designed stage data volumes and bandwidth for the pad-, proppant- and closure-window, and 2) the data volume and bandwidth of AME closure labels. The cluster may be designed to have double the volume of data to be collected in the three windows and for the AME closure labels detected in the closure-window. This embodiment is designed for 100 TB data for the total job and a maximum of 1 TB of AME labels. At a predetermined real-time data input, (this embodiment uses 550 MBps), the treatment parameters are acquired and loaded (3b) into the system first memory which has been predetermined from the job data volume and bandwidth, provisioned and initialized in the previous step. The system first memory is comprised of registered memory provisioned from the...

second embodiment

Operation of FIGS. 6A-6M, 7A & 7B and 8.

As illustrated in FIG. 6B, the cluster is first initialized (6a) ensuring the computing resources and hardware are sufficient for the job's 1) designed stage data volumes and bandwidth for the pad-, proppant- and closure-window, and 2) the data volume and bandwidth of AME closure labels. The cluster may be designed to have double the volume of data to be collected in the three windows and for the AME closure labels detected in the closure-window. This embodiment is designed for 100 TB data for the total job and a maximum of 2 TB of AME labels. At a predetermined real-time data input, (this embodiment uses 550 MBps), the treatment parameters are acquired and loaded (6b) into the system first memory which has been predetermined from the job data volume and bandwidth, provisioned and initialized in the previous step. The system first memory is comprised of registered memory provisioned from the memory modules which may include (FIGS. 7A & 7B) 700...

third embodiment

Operation of FIGS. 9A-9T, 10A-10C and 11A-11G.

As illustrated in FIG. 9B, the cluster is first initialized (9a) ensuring the computing resources and hardware are sufficient for the job's 1) designed stage data volumes and bandwidth for the pad-, proppant- and closure-window, and 2) the data volume and bandwidth of AME closure labels. The cluster may be designed to have double the volume of data to be collected in the three windows and for the AME closure labels detected in the closure-window. This embodiment is designed for 100 TB data for the total job and a maximum of 1 TB of AME labels. At a predetermined real-time data input, (this embodiment uses 550 MBps), the treatment parameters are acquired and loaded (9b) into the system first memory which has been predetermined from the job data volume and bandwidth, provisioned and initialized in the previous step. The system first memory is comprised of registered memory provisioned from the memory modules which may include (FIGS. 10A-10...


PUM


Abstract

The new art includes a system, process and means to label microseisms generated by hydraulic fracture operations and detected by acoustic sensors so a that machine learning process may be trained to perform mapping of propped hydraulic fracture dimensions in real-time or near-real time. This labeling process creates a labeled training set that enables any supervised machine learning process to be tested and trained whereby the process may perform real-time mapping of propped and unpropped fractures in subsequent treatment stage(s).

Description

APPLICANT INFORMATIONCitizenship: U.S. CitizenResidence: Moore, Okla.TECHNICAL FIELDThe present invention relates to hydraulic fracturing in oil and gas wells, and more particularly to hydraulic fracturing diagnostics.BACKGROUND ARTThe following is a tabulation of some prior art that presently appears relevant:U.S. Patent Application PublicationsPublication NumberKind CodePubl. DateApplicant2012 / 0257475A12012 Oct. 11Luscombe et al.2003 / 0217886A12003 Nov. 27Bjorn PaulssonNonpatent Literature DocumentsBarree, R. D., Fisher, M. K., & Woodroof, R. A. (2002 Jan. 1). A Practical Guide to Hydraulic Fracture Diagnostic Technologies. Society of Petroleum Engineers. doi:10.2118 / 77442-MSBosman, K., Preiksaitis, M., Baig, A., & Urbancic, T. (2015 Dec. 17). From Microseismic to Induced Seismicity: Monitoring the Full Band of Reservoir Seismicity. Society of Exploration Geophysicists.Ghanizadeh, A., Clarkson, C. R., Deglint, H., Vahedian, A., Aquino, S., & Wood, J. M. (2016 Aug. 1). Unpropped / Pro...

Claims


Application Information

Patent Timeline
Patent Type & Authority Patents(United States)
IPC IPC(8): G06N20/00E21B49/00G01V1/28G01V1/34E21B43/267E21B43/26
CPCG06N20/00G01V1/34G01V1/288E21B49/00G01V2210/646E21B43/26G01V2210/72G01V2210/1234E21B43/267G01V1/42G01V1/308G01V2210/1429G01V2210/644E21B2200/20
Inventor WILLINGER, JONATHAN R
Owner WILLINGER JONATHAN R
Why Eureka
Try Eureka