System and method to diagnose and predict different systemic disorders and mental states
a system and mental state technology, applied in the field of system and method to diagnose and predict different systemic disorders, can solve the problems of not being very sensitive and specific for different diseases, no objective quantitative test for evaluating baseline brain function,
- Summary
- Abstract
- Description
- Claims
- Application Information
AI Technical Summary
Benefits of technology
Problems solved by technology
Method used
Image
Examples
example 1
Sampling of EEG Data of Subjects
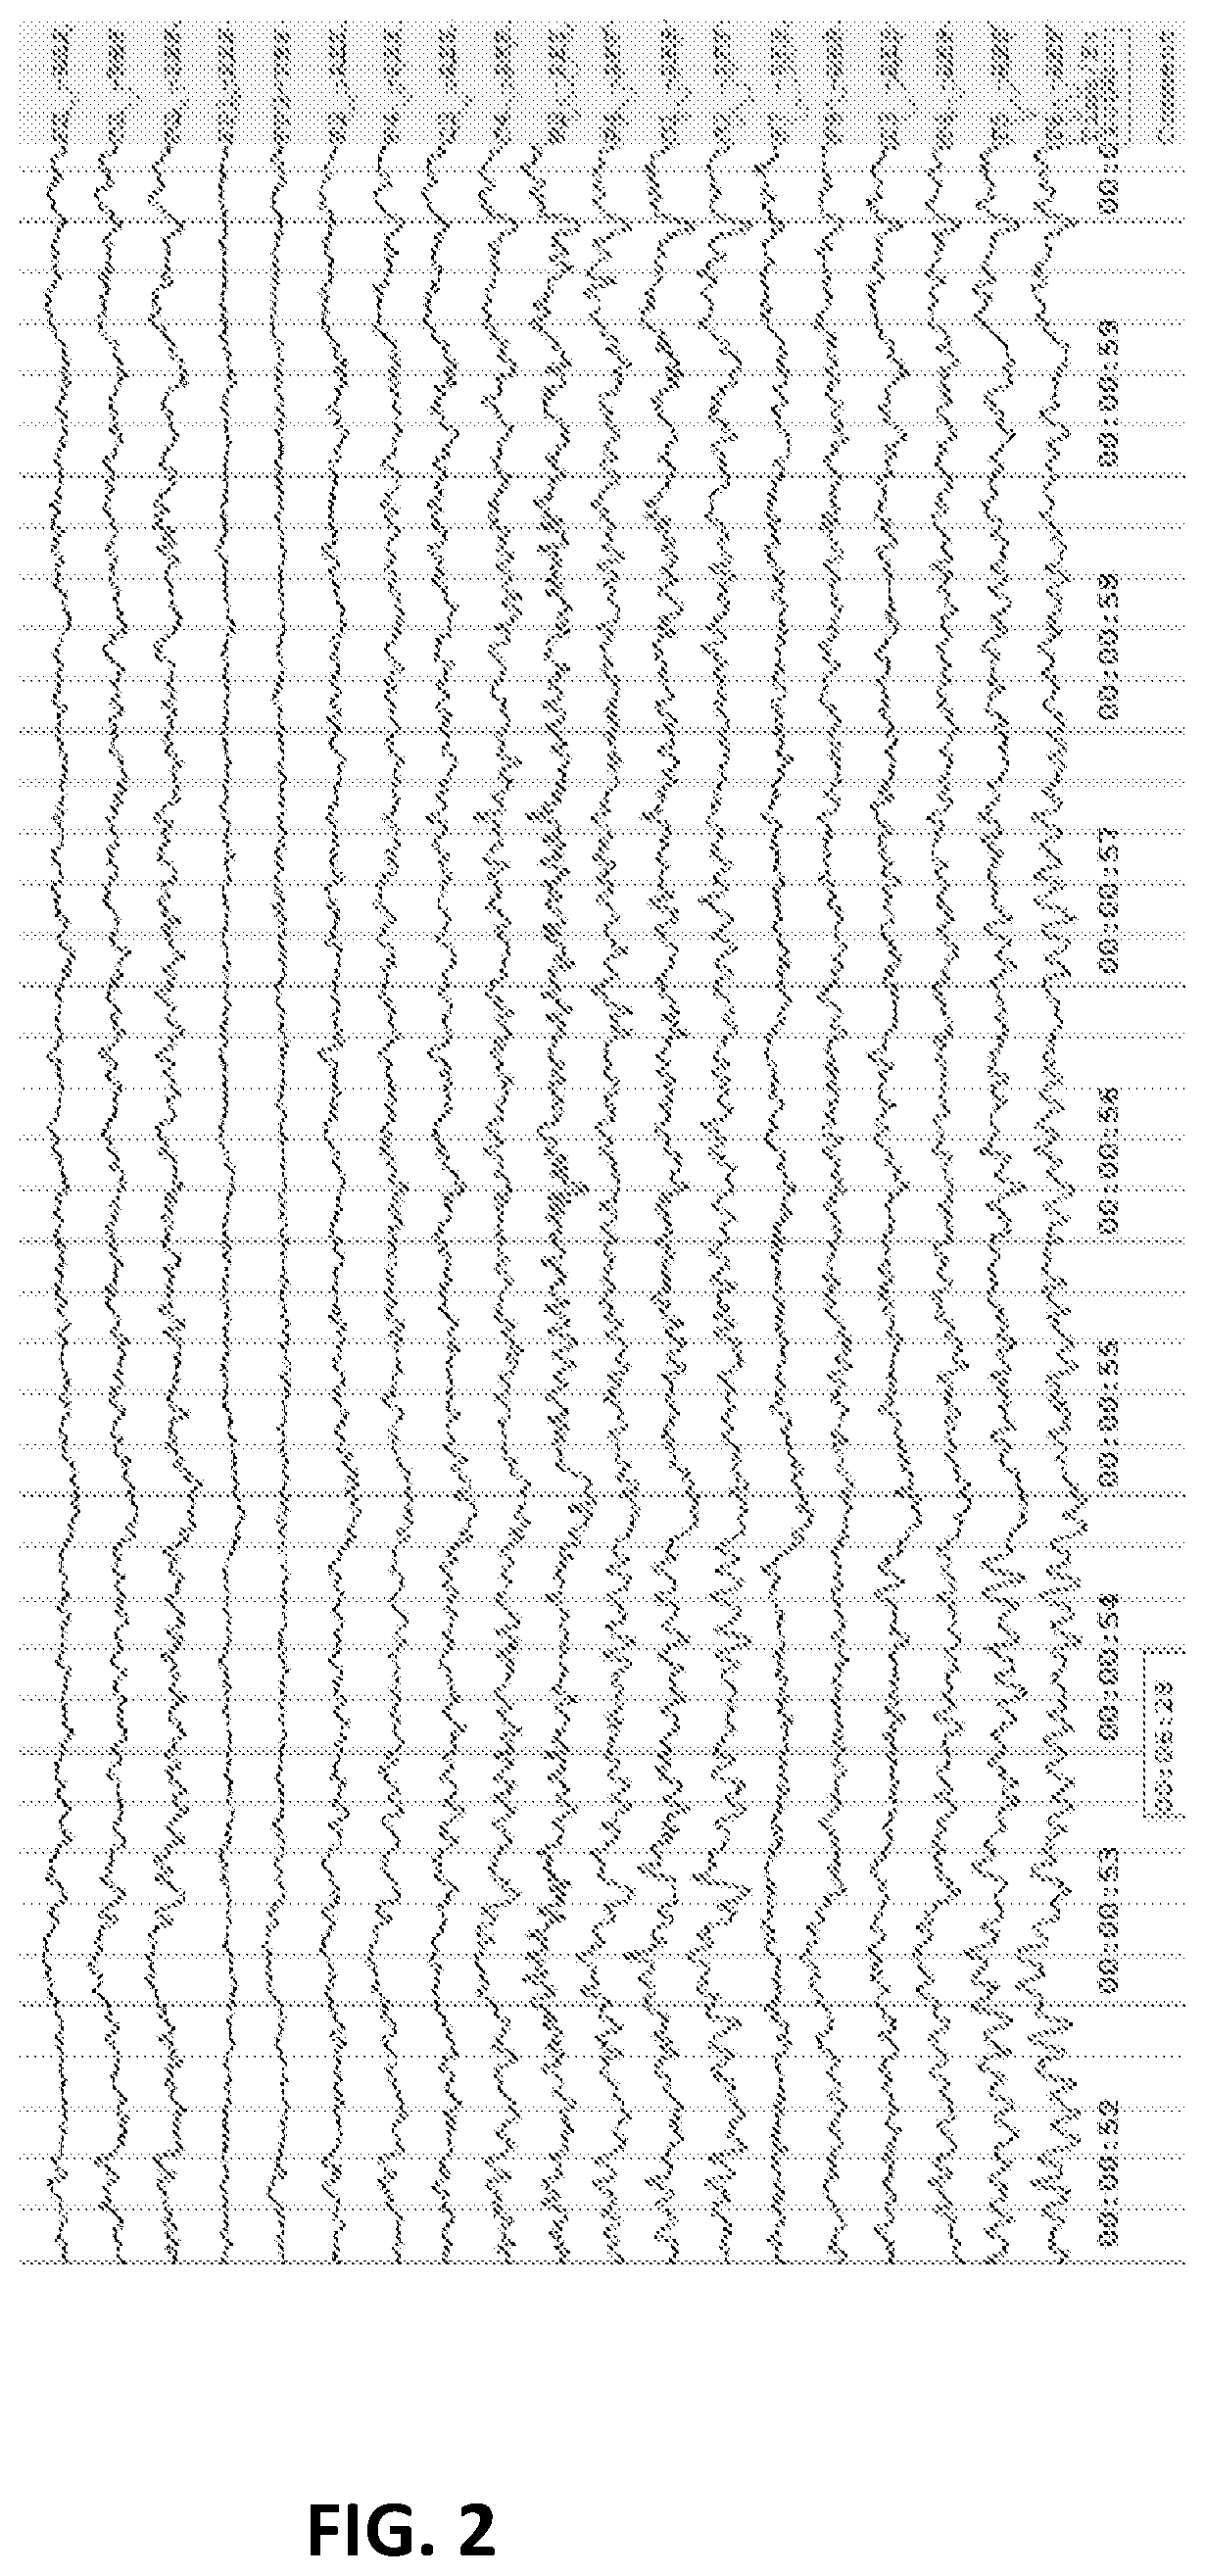
[0076]The internationally recognized 10-20 system is used to place the sensors on the scalp and record the EEG signals. FIG. 2 shows a sample of the EEG signals recorded from a healthy subject. The name of each signal recorded is mentioned along with it on the extreme right of FIG. 2. First three signals, namely, Fz, Cz, Pz, lie along the line running at the centre of the scalp from the front to the back of the head. The signals ending with an odd number, for example, C3, lie on the left side of the scalp and those ending with an even number, for example, P4, lie on right side of the scalp.
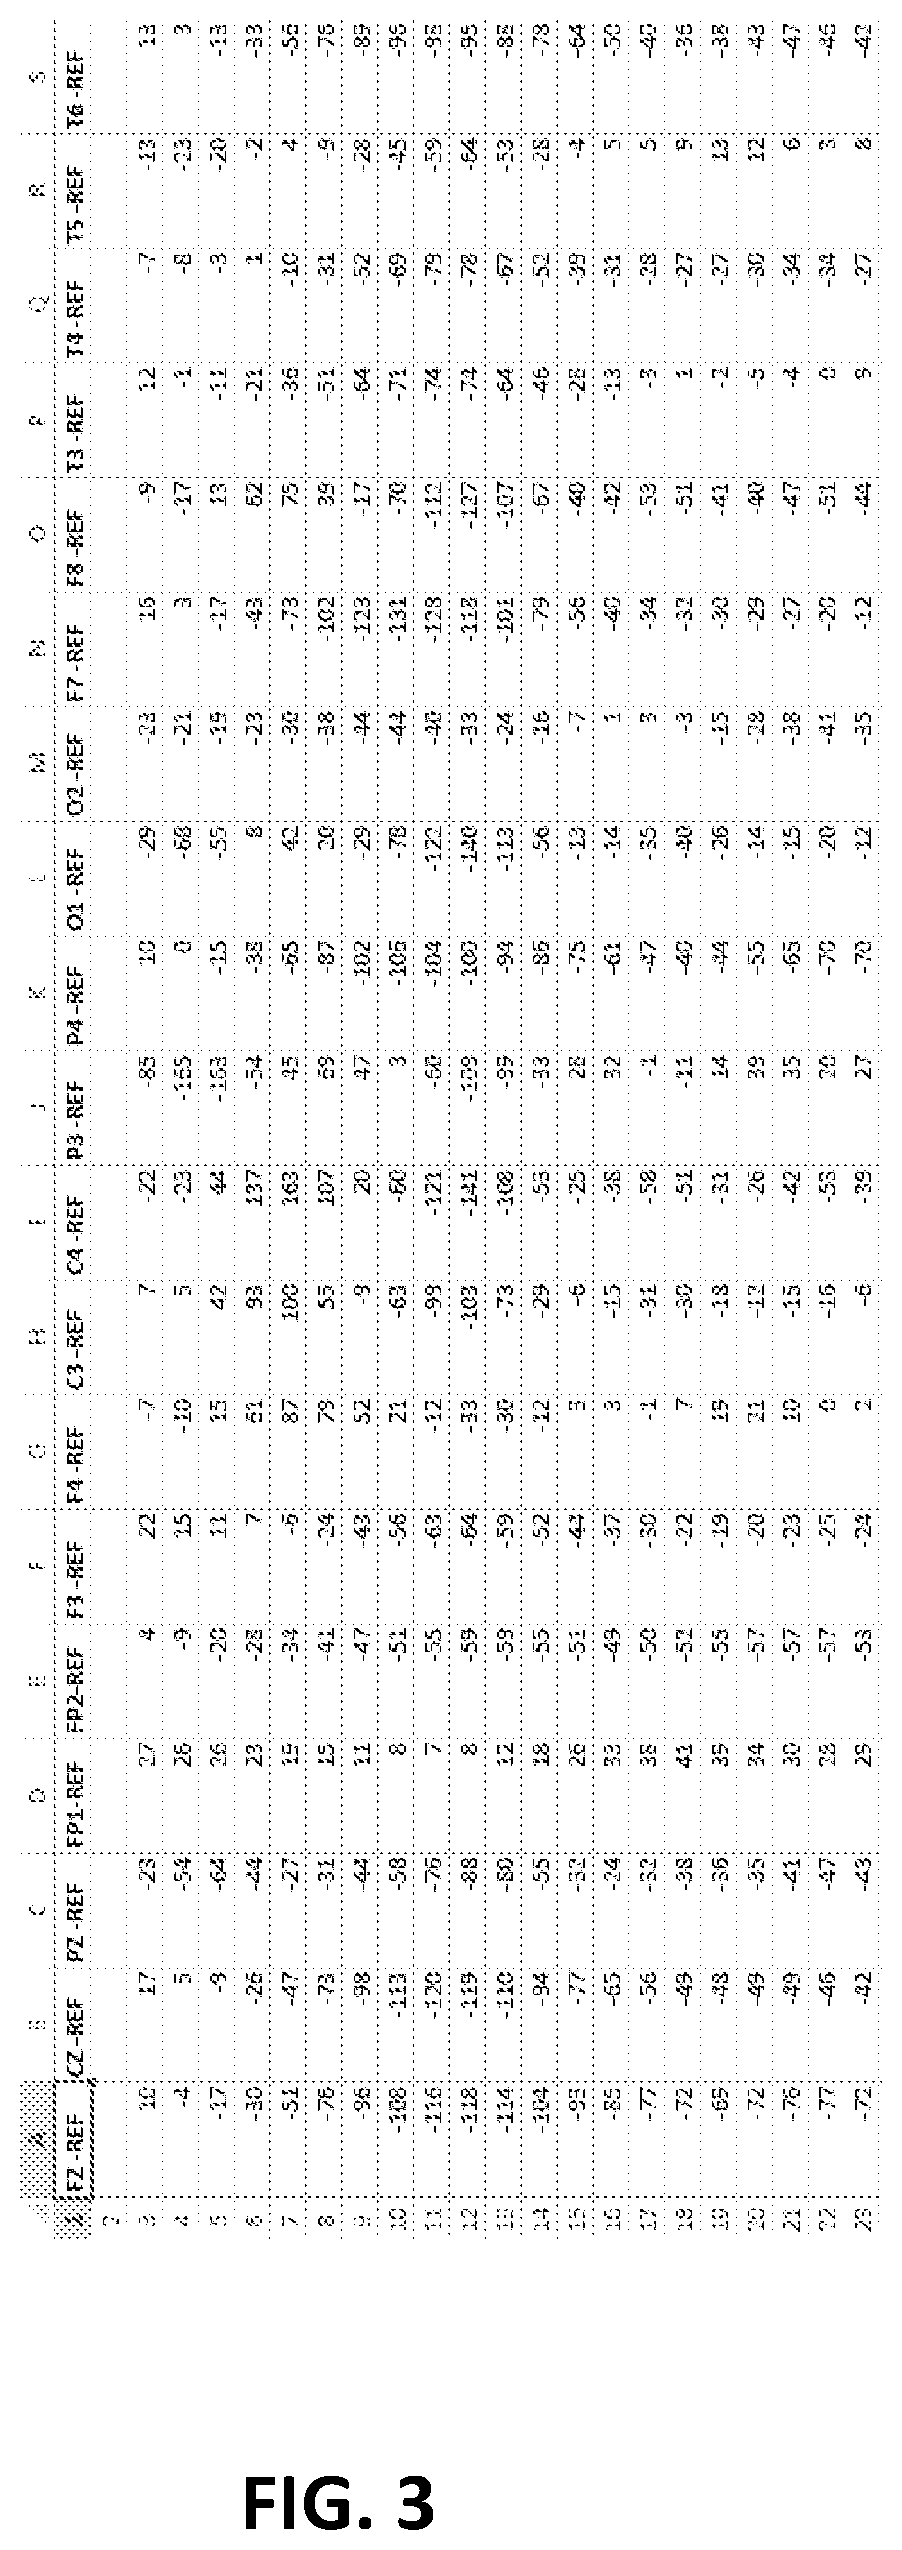
[0077]In this example, once the signals are recorded, they are separated into two groups, namely, left and right. The left group has all the signals that are obtained from the left side of the scalp, along with the signal Cz, and the right group has all the signals obtained from the right side of the scalp along with signal Cz. Therefore, each side has 9 signals eac...
example 2
Constructing Covariance Matrix of Sample EEG Data of Subjects
[0081]A covariance matrix is constructed with the 9 signals and 256 samples for each signal. FIG. 4 shows this covariance matrix. It is a symmetric 9×9 matrix that is populated with the covariance values of each signal with every other signal, computed using the 256 samples we have for all 9 signals. One can obtain the covariance between any two EEG signals by going to the row and column, with their respective names written next to each row and column of the matrix, and reading off that value from the matrix. For example, the covariance between F4 and C4 is 1301.435, and its location is at the 5th column-3rd row and also, since the matrix is symmetric, 3rd column-5th row.
[0082]With covariance matrix constructed we then proceed to compute its eigenvectors and eigenvalues. An eigenvector of a matrix is a vector which when multiplied by that matrix results in a scaled version of the original vector itself, i.e., Axi=λixi, whe...
example 3
Identifying Response Vector
[0083]With all 9 eigenvectors and eigenvalues obtained, we first multiply each eigenvalue with its eigenvector and then add all the eigenvectors together, i.e., Σi(λivi), to give what we call the responsevectorΛ of the covariance matrix. The eigenvectors corresponding to higher eigenvalues represent the slow changing aspect of the brain like unique brain signature of individual person, different chronic diseases and the eigenvectors with small eigenvalues represent the fast changing aspects of the brain like thought process, different diseases including mental diseases. If one needs to focus on one specific activity of the brain then individual eigenvectors are used instead of the response vectors, which represent the overall activity. FIG. 6 shows the computation of the response vector of the covariance matrix in FIG. 4 from its eigenvectors and eigenvalues. The response vector is of the same size as the eigenvectors, i.e., 9×1 and its elements can be rea...
PUM
 Abstract
Description
Claims
Application Information
 - R&D
- Intellectual Property
- Life Sciences
- Materials
- Tech Scout
- Unparalleled Data Quality
- Higher Quality Content
- 60% Fewer Hallucinations
Browse by: Latest US Patents, China's latest patents, Technical Efficacy Thesaurus, Application Domain, Technology Topic, Popular Technical Reports.
© 2025 PatSnap. All rights reserved.Legal|Privacy policy|Modern Slavery Act Transparency Statement|Sitemap|About US| Contact US: help@patsnap.com


