Display apparatus and vehicle including the same

a technology for display apparatuses and vehicles, applied in battery/fuel cell control arrangements, electric devices, instruments, etc., can solve the problems of increased internal resistance or lowering of the full charge capacity of the secondary battery, insufficient representation, and calculated degree of deterioration, so as to reduce the time required for charging the secondary battery accordingly, the effect of reducing the retention ra

Active Publication Date: 2021-11-23
TOYOTA JIDOSHA KK
View PDF5 Cites 0 Cited by
  • Summary
  • Abstract
  • Description
  • Claims
  • Application Information

AI Technical Summary

Benefits of technology

[0008]According to the configuration, the display of the display apparatus shows a deterioration degree range, with a margin of the calculated degree of deterioration being allowed. The range includes, for example, an error margin of the calculated degree of deterioration. The display shows a degree of deterioration as a deterioration degree range covering a certain extent. A user can thus recognize that the degree of deterioration shown on the display has the certain extent. Therefore, even though the shown degree of deterioration may be varied under the influence by an error, the variation is within user's expectations. Therefore, the user is less likely to feel strange about the variation. Therefore, occasions of strange feeling felt by the user about the degree of deterioration shown on the display can be decreased.
[0010]As deterioration of the secondary battery proceeds, influence by an error in a degree of deterioration may become great. For example, when a capacity retention representing a percentage of a full charge capacity at the current time point to a full charge capacity in an initial stage (at the time of manufacturing) of the secondary battery is employed as the degree of deterioration, influence by an error in a capacity retention is greater as the capacity retention is lower. According to the configuration, for example, a degree of deterioration of the secondary battery is calculated by what is called a current integration method. When the full charge capacity lowers due to deterioration of the secondary battery in charging from a prescribed SOC to full charge, time required for charging of the secondary battery accordingly decreases. Then, the number of pieces of data used for calculating the degree of deterioration decreases, and hence accumulated errors also decrease. Therefore, as deterioration of the secondary battery proceeds, the error decreases and influence by the error in the degree of deterioration can be lessened.

Problems solved by technology

It has been known that a secondary battery deteriorates over time, which leads to increase in internal resistance or lowering in full charge capacity of the secondary battery.
The calculated degree of deterioration, however, may contain a detection error in various sensors used for measurement of the secondary battery or an error in a calculated model.
In this case, proper representation is not provided and the user may feel strange about the shown degree of deterioration.
As deterioration of the secondary battery proceeds, influence by an error in a degree of deterioration may become great.
Then, the number of pieces of data used for calculating the degree of deterioration decreases, and hence accumulated errors also decrease.

Method used


Image

  • Display apparatus and vehicle including the same
  • Display apparatus and vehicle including the same
  • Display apparatus and vehicle including the same

Examples


first modification

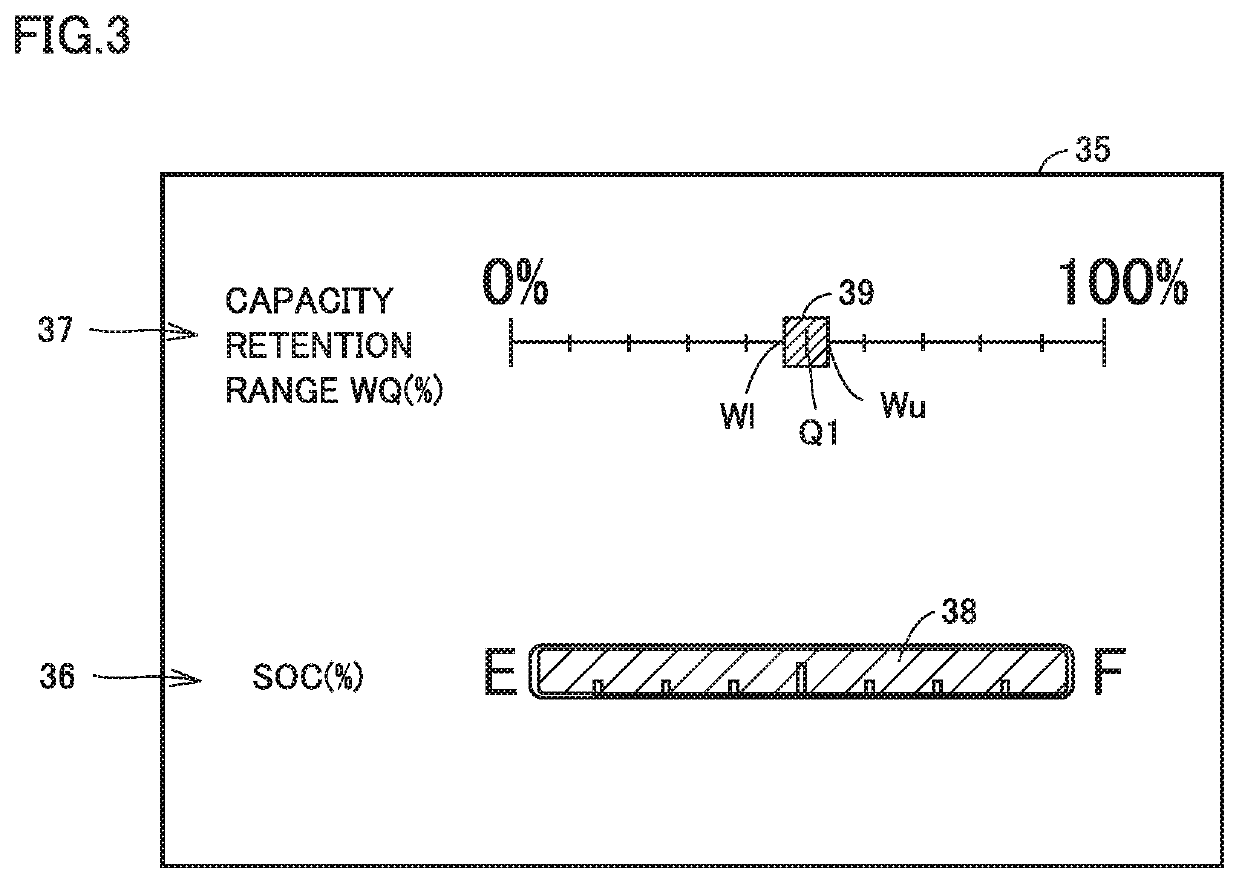
[0077]FIG. 5 is a diagram showing another exemplary screen shown on display 35 of vehicle 100. An example in which capacity retention range WQ of main battery 10 is shown as a plot over a range (extent) between numeric values is described in the embodiment. A manner of representation, however, is not limited as above, and capacity retention range WQ of main battery 10 may be shown, for example, by a numeric value (percent) as shown in FIG. 5.

[0078]Instead of or in addition to representation of capacity retention range WQ of main battery 10 on display 35, for example, auditory notification or indication based on the number of turned-on lights may be provided.

second modification

[0079]An example in which capacity retention Q is calculated each time of external charging is described in the embodiment. Capacity retention Q, however, may be calculated every prescribed cycle including a period during which vehicle 100 is running. In this case, though an error margin of capacity retention Q does not decrease with lowering in capacity retention Q as in the embodiment, strange feeling felt by a user can be lessened by showing capacity retention range WQ.

[0080]FIG. 6 is a flowchart showing one example of processing performed by controller 30 according to a second modification. The flowchart in FIG. 6 is different from the flowchart in FIG. 4 in that S1 and S5 are not performed but S4, S6, and S9 are added. Description of the steps given with reference to FIG. 4 will not be repeated. Each step in the flowchart shown in FIG. 6 is repeatedly performed by controller 30 every prescribed cycle.

[0081]When a prescribed cycle comes, controller 30 starts execution of the flo...

third modification

[0088]The embodiment describes a capacity retention (an electric current capacity retention) as representing a degree of deterioration with a unit “Ah” of the full charge capacity of main battery 10. A capacity retention (a power capacity retention), however, may represent a degree of deterioration, for example, with a unit “Wh” of the full charge capacity of main battery 10.


PUM


Abstract

A vehicle includes a controller and a display. The controller is configured to calculate a capacity retention (a degree of deterioration) based on measurement data of a main battery. The controller estimates an upper limit value and a lower limit value of an error (range) of the calculated capacity retention. The controller calculates a capacity retention range including the upper limit value Wu and the lower limit value. The controller has the display show the calculated capacity retention range.

Description

[0001]This nonprovisional application is based on Japanese Patent Application No. 2018-197635 filed with the Japan Patent Office on Oct. 19, 2018, the entire contents of which are hereby incorporated by reference.BACKGROUNDField[0002]The present disclosure relates to a display apparatus and a vehicle including the same, and particularly to a display apparatus configured to show a degree of deterioration of a secondary battery and a vehicle including the same.Description of the Background Art[0003]A secondary battery as a driving power supply (motive power source) for a motor is mounted on a vehicle such as an electric vehicle. It has been known that a secondary battery deteriorates over time, which leads to increase in internal resistance or lowering in full charge capacity of the secondary battery. Therefore, various techniques for estimating a degree of deterioration of a secondary battery have been proposed. For example, Japanese Patent Laying-Open No. 2018-029430 has disclosed a...

Claims


Application Information

Patent Timeline
Patent Type & Authority Patents(United States)
IPC IPC(8): H02J7/00B60L58/16B60L58/25B60L58/13
CPCB60L58/16B60L58/13B60L58/25B60L2250/16B60L3/12B60L58/10B60L58/12G01R31/367G01R31/3842Y02T10/70
Inventor KUBO, KAZUKIIZUMI, JUNTAUCHIDA, YOSHIHIROUCHIYAMA, MASAKI
Owner TOYOTA JIDOSHA KK
Why Eureka
Try Eureka