
Reliable and automatic mass spectral analysis

a mass spectral analysis, automatic technology, applied in the field of mass spectrometry, can solve the problems of inability to accurately detect the mass of the most commonly used unit mass resolution ms system, the inability to recover the integrity of the ms data, and the systematic and random errors of either strong or weak mass spectral peak, so as to increase the identification confidence

Active Publication Date: 2022-08-02
CERNO BIOSCI
View PDF13 Cites 0 Cited by
  • Summary
  • Abstract
  • Description
  • Claims
  • Application Information

AI Technical Summary

Benefits of technology

This method provides accurate and reliable identification and quantification of analytes, reduces systematic errors, and enables consistent comparison of MS data across instruments, improving the integrity and reliability of mass spectral data, especially in complex samples.

Problems solved by technology

While highly efficient in terms of data storage, this is a process plagued by many adjustable parameters that can make an isotope appear or disappear with no objective measures of the centroiding quality, due to the many interfering factors mentioned above and the intrinsic difficulties in determining peak areas in the presence of other peaks and / or baselines.
Unfortunately for many MS systems, especially quadrupole MS systems, this MS peak detection and centroiding are conventionally set up by default as part of the MS method to occur during data acquisition down at the firmware level, leading to irreparable damages to the MS data integrity, even for pure component mass spectral data in the absence of any spectral interferences from other co-existing compounds or analytes.
As pointed out in U.S. Pat. No. 6,983,213, these damages or disadvantages include:a. Lack of mass accuracy on the most commonly used unit mass resolution MS systems.
Centroiding without full mass spectral calibration including MS peak shape calibration suffers from uncertainty in mass spectral peak shape, its variability, the isotope peaks, the baseline and other background signals, the random noise, leading to both systematic and random errors for either strong or weak mass spectral peaks.c. Large isotope abundance error.
Separating the contributions from various closely located isotopes (e.g., A and A+1) on conventional MS systems with unit mass resolution either ignores the contributions from neighboring isotope peaks or over-estimates them, resulting in errors for dominating isotope peaks and large biases for weak isotope peaks or even complete elimination of the weaker isotopes.d.
Systematic errors (biases) are generated at each stage and propagated down to the later stages in an uncontrolled, unpredictable, and nonlinear manner, making it impossible for the algorithms to report meaningful statistics as measures of data processing quality and reliability.e.
Unfortunately, the typical centroiding process currently in use create a source of systematic error even larger than the random noise in the raw data, thus becoming the limiting factor in instrument sensitivity.f.
The many empirical approaches currently used in centroiding make the whole processing inconsistent either mathematically or statistically.
In order words, the results of the peak centroiding are not robust and can be unstable depending on a particular experiment or data acquisition.g.
It has usually been difficult to directly compare raw mass spectral data from different MS instruments due to variations in the mechanical, electromagnetic, or environmental tolerances.
With the typical centroiding applied to the actual raw profile mode MS data, it not only adds to the difficulty of quantitatively comparing results from different MS instruments due to the quantized nature of the centroiding process and centroid data, but also makes it difficult, if not impossible, to track down the source or possible cause of the variability once the MS data have been reduced to centroid data.
For a well separated analyte with pure mass spectrum and without any spectral interferences, MS centroiding is quite problematic as is due to the above listed reasons.
For unresolved or otherwise co-eluting analytes or compounds in complex samples (e.g., petroleum products or essential oils) even after extensive chromatographic separation (e.g., 1-hr GC separation of essential oils or LC separation of biological samples with post translational modification such as deamidation), the above centroid processing problem would only be further aggravated due to the mutual mass spectral interferences present and the quantized nature of the MS centroids, which makes mass spectral data no longer linearly additive.
This necessarily makes the MS centroid spectrum of a mixture different from the sum of MS centroids obtained from each individual pure spectrum, making the nonlinear and systematic centroiding error worse and even intractable.
Anal. Chem. 77 (8): 2297-2302, the mass spectrum may become so complex that there may not be visually separable mass spectral peaks for either detection or centroiding, leading possibly to the outright total failure of conventional mass spectral data acquisition, processing, and analysis.

Method used


Image

  • Reliable and automatic mass spectral analysis
  • Reliable and automatic mass spectral analysis
  • Reliable and automatic mass spectral analysis

Examples


Embodiment Construction

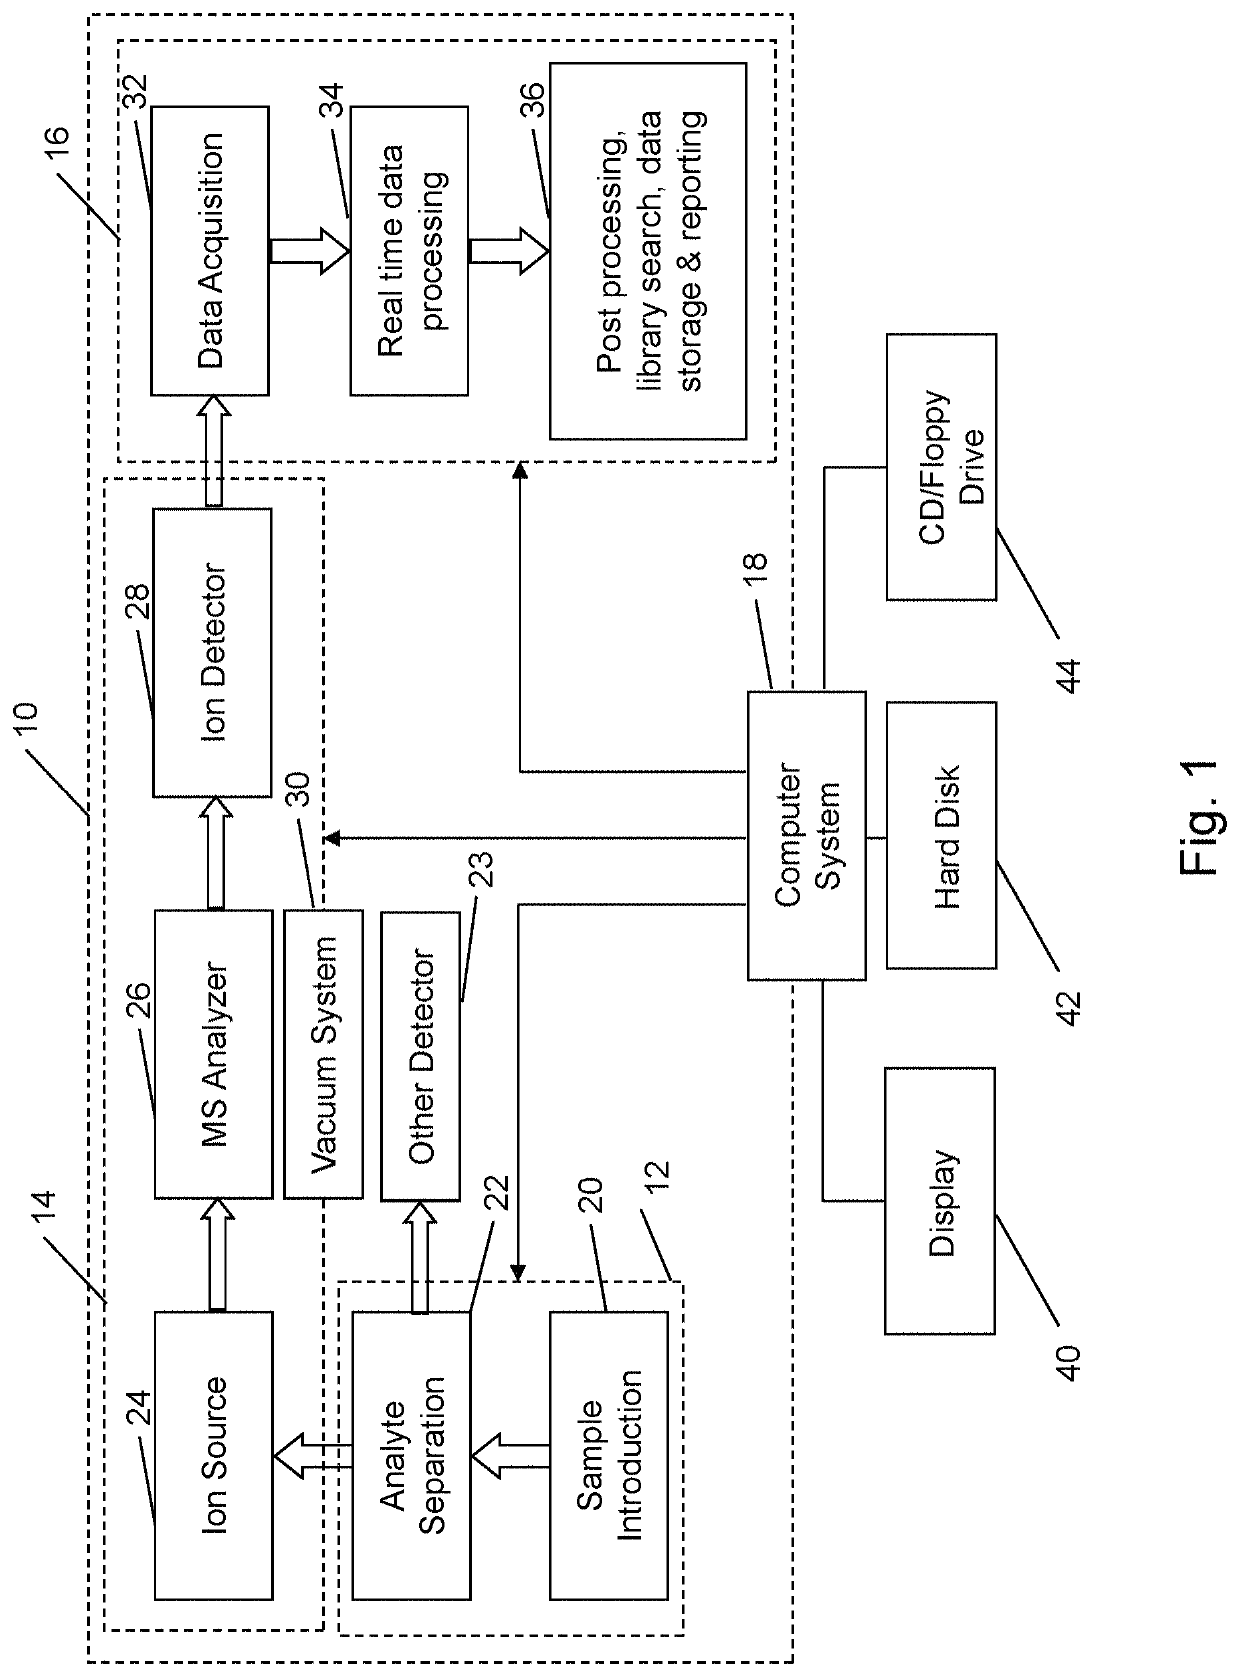
[0040]Referring to FIG. 1, there is shown a block diagram of an analysis system 10, that may be used to analyze proteins or other molecules, as noted above, incorporating features of the present invention. Although the present invention will be described with reference to the single embodiment shown in the drawings, it should be understood that the present invention can be embodied in many alternate forms of embodiments. In addition, any suitable types of components could be used.

[0041]Analysis system 10 has a sample preparation portion 12, other detector portion 23, a mass spectrometer portion 14, a data analysis system 16, and a computer system 18. The sample preparation portion 12 may include a sample introduction unit 20, of the type that introduces a sample containing proteins, peptides, or small molecule drug of interest to system 10, such as LCQ Deca XP Max, manufactured by Thermo Fisher Scientific Corporation of Waltham, Mass., USA. The sample preparation portion 12 may also...


PUM

PropertyMeasurementUnit
mass erroraaaaaaaaaa

Abstract

A method, mass spectrometer and computer readable medium for acquiring mass spectral data in raw profile; detecting presence of compounds and relevant time window; performing multivariate statistical analysis of raw profile data in a time window to determine compounds; obtaining separation time profiles for detected compounds containing respective time locations in a time window; and computing pure mass spectra for compounds based on separation time profiles or time locations. A method, mass spectrometer and computer readable medium for acquiring mass spectral data in raw profile of a known and unknown sample; combining mass spectral scans for a sample into a single mass spectrum across a separation time window; performing multivariate statistical analysis of the acquired mass spectral data and computing a distance measure between the known and unknown sample; and using the distance measure as an indication for an unknown sample belonging to a known sample or sample group.

Description

CROSS REFERENCE TO RELATED PATENT APPLICATIONS / PATENTS[0001]U.S. Pat. Nos. 6,983,213, 7,493,225 and 7,577,538; International Patent Application PCT / US2004 / 013096, filed on Apr. 28, 2004; U.S. Pat. No. 7,348,553; International Patent Application PCT / US2005 / 039186, filed on Oct. 28, 2005; U.S. Pat. No. 8,010,306, International Patent Application PCT / US2006 / 013723, filed on Apr. 11, 2006; U.S. Pat. No. 7,781,729, International Patent Application PCT / US2007 / 069832, filed on May 28, 2007; and U.S. provisional patent application Ser. No. 60 / 941,656, filed on Jun. 2, 2007 and as International Patent Application PCT / US2008 / 065568 published as WO 2008 / 151153.[0002]The entire teachings of these patent documents are hereby incorporated herein by reference, in their entireties, for all purposes.FIELD OF THE INVENTION[0003]The present invention generally relates to the field of Mass Spectrometry (MS) and, more particularly, to methods for acquiring, processing, and analyzing MS data.BACKGROUND O...

Claims


Application Information

Patent Timeline
Patent Type & Authority Patents(United States)
IPC IPC(8): H01J49/00G16B40/00G01N30/72G01N30/86G01N33/68
CPCH01J49/0036G01N30/72G01N30/8631G01N30/8644G01N30/8675G01N33/6848G16B40/00G01N30/8693
Inventor KUEHL, DONSIMONOFF, STACEYWANG, YONGDONG
Owner CERNO BIOSCI
Learn More