
Computer systems and methods for the query and visualization of multidimensional databases

a database and computer system technology, applied in the field of interactive visual exploration tools, can solve the problems of unfavorable interactive calculations that require visiting each record, inability of analysts to reason about or view the entire data set at its finest level of detail, and the shear size of these data sets complicates the task of exploratory analysis, so as to facilitate exploratory analysis of databases

Active Publication Date: 2004-12-02
THE BOARD OF TRUSTEES OF THE LELAND STANFORD JUNIOR UNIV
View PDF45 Cites 202 Cited by
  • Summary
  • Abstract
  • Description
  • Claims
  • Application Information

AI Technical Summary

Benefits of technology

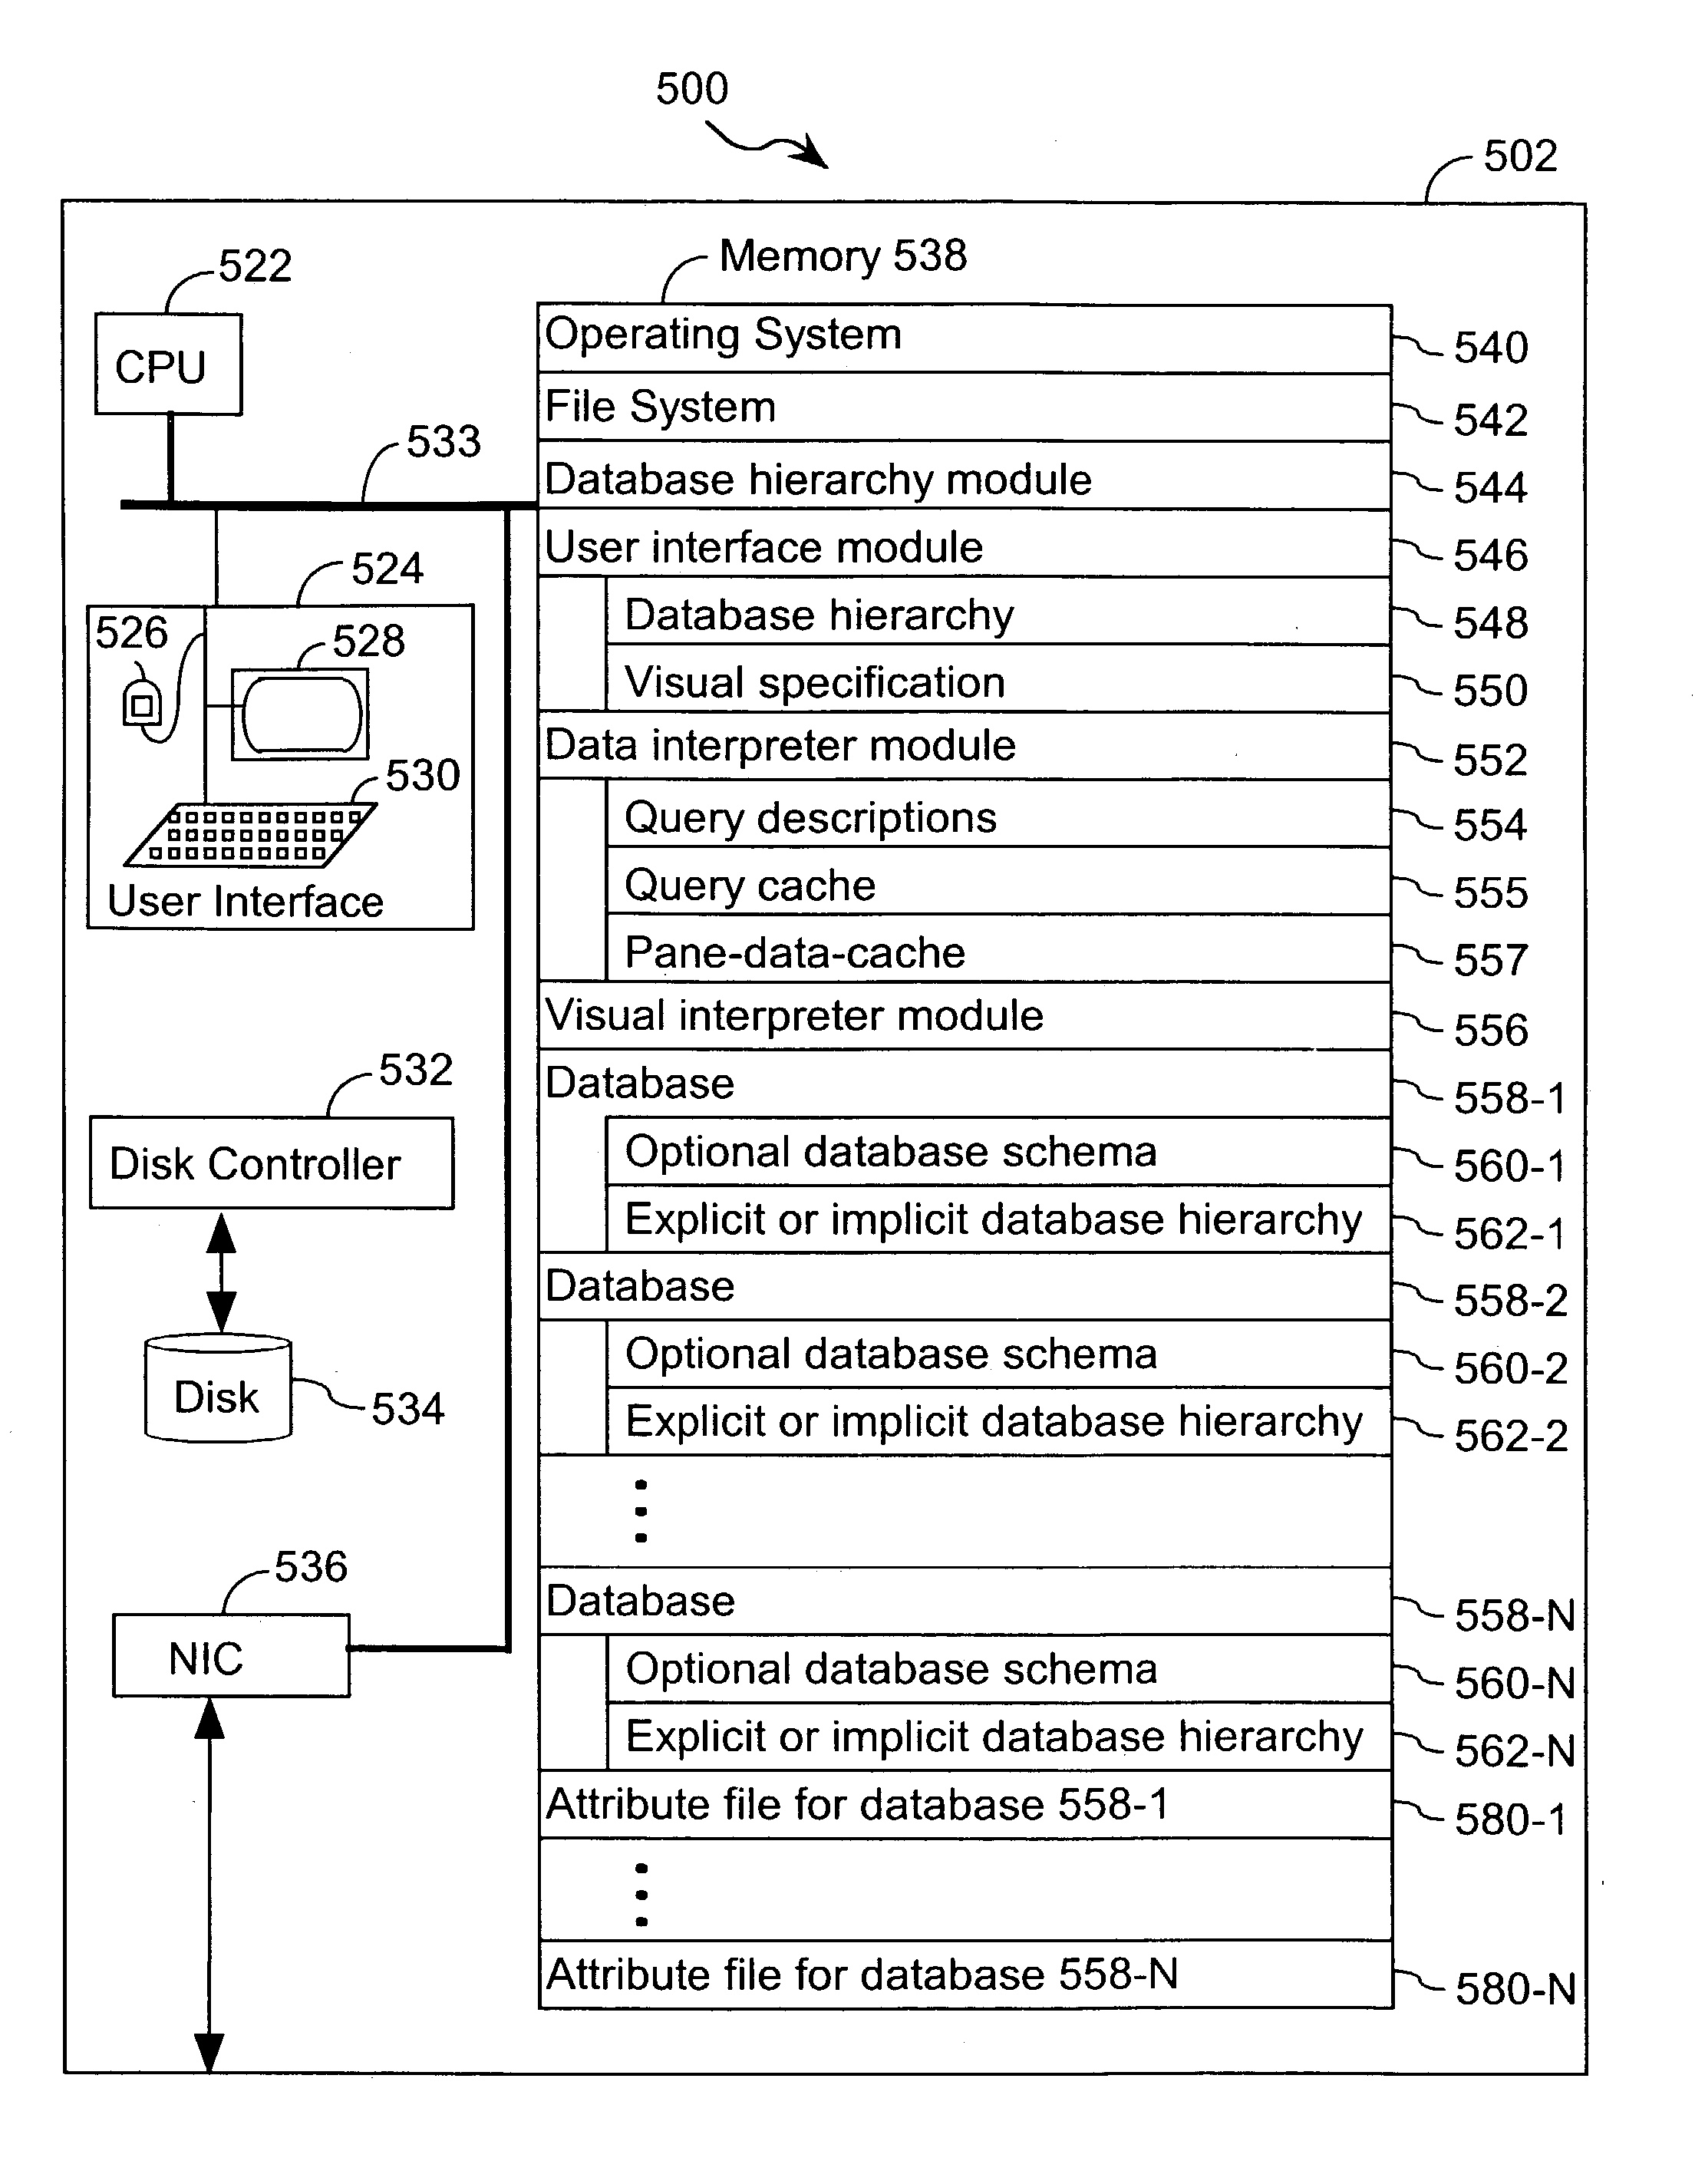
[0172] The algorithm described in lines 201 through 215 assumes that each query of 558 is available in a pane-data-cache 557. Recall that an important advantage of the present invention is that queries are typically grouped across several panes. Thus, queries need to be partitioned into a separate table for each pane and then placed in the pane-data-cache 557. While the present invention imposes no limitation on which software module performs this grouping transformation, in one embodiment of the present invention, the grouping transformation is performed by data interpreter module 552 as part of a generalized algorithm for querying databases 558. See, for example, the algorithm described in step 606, above.
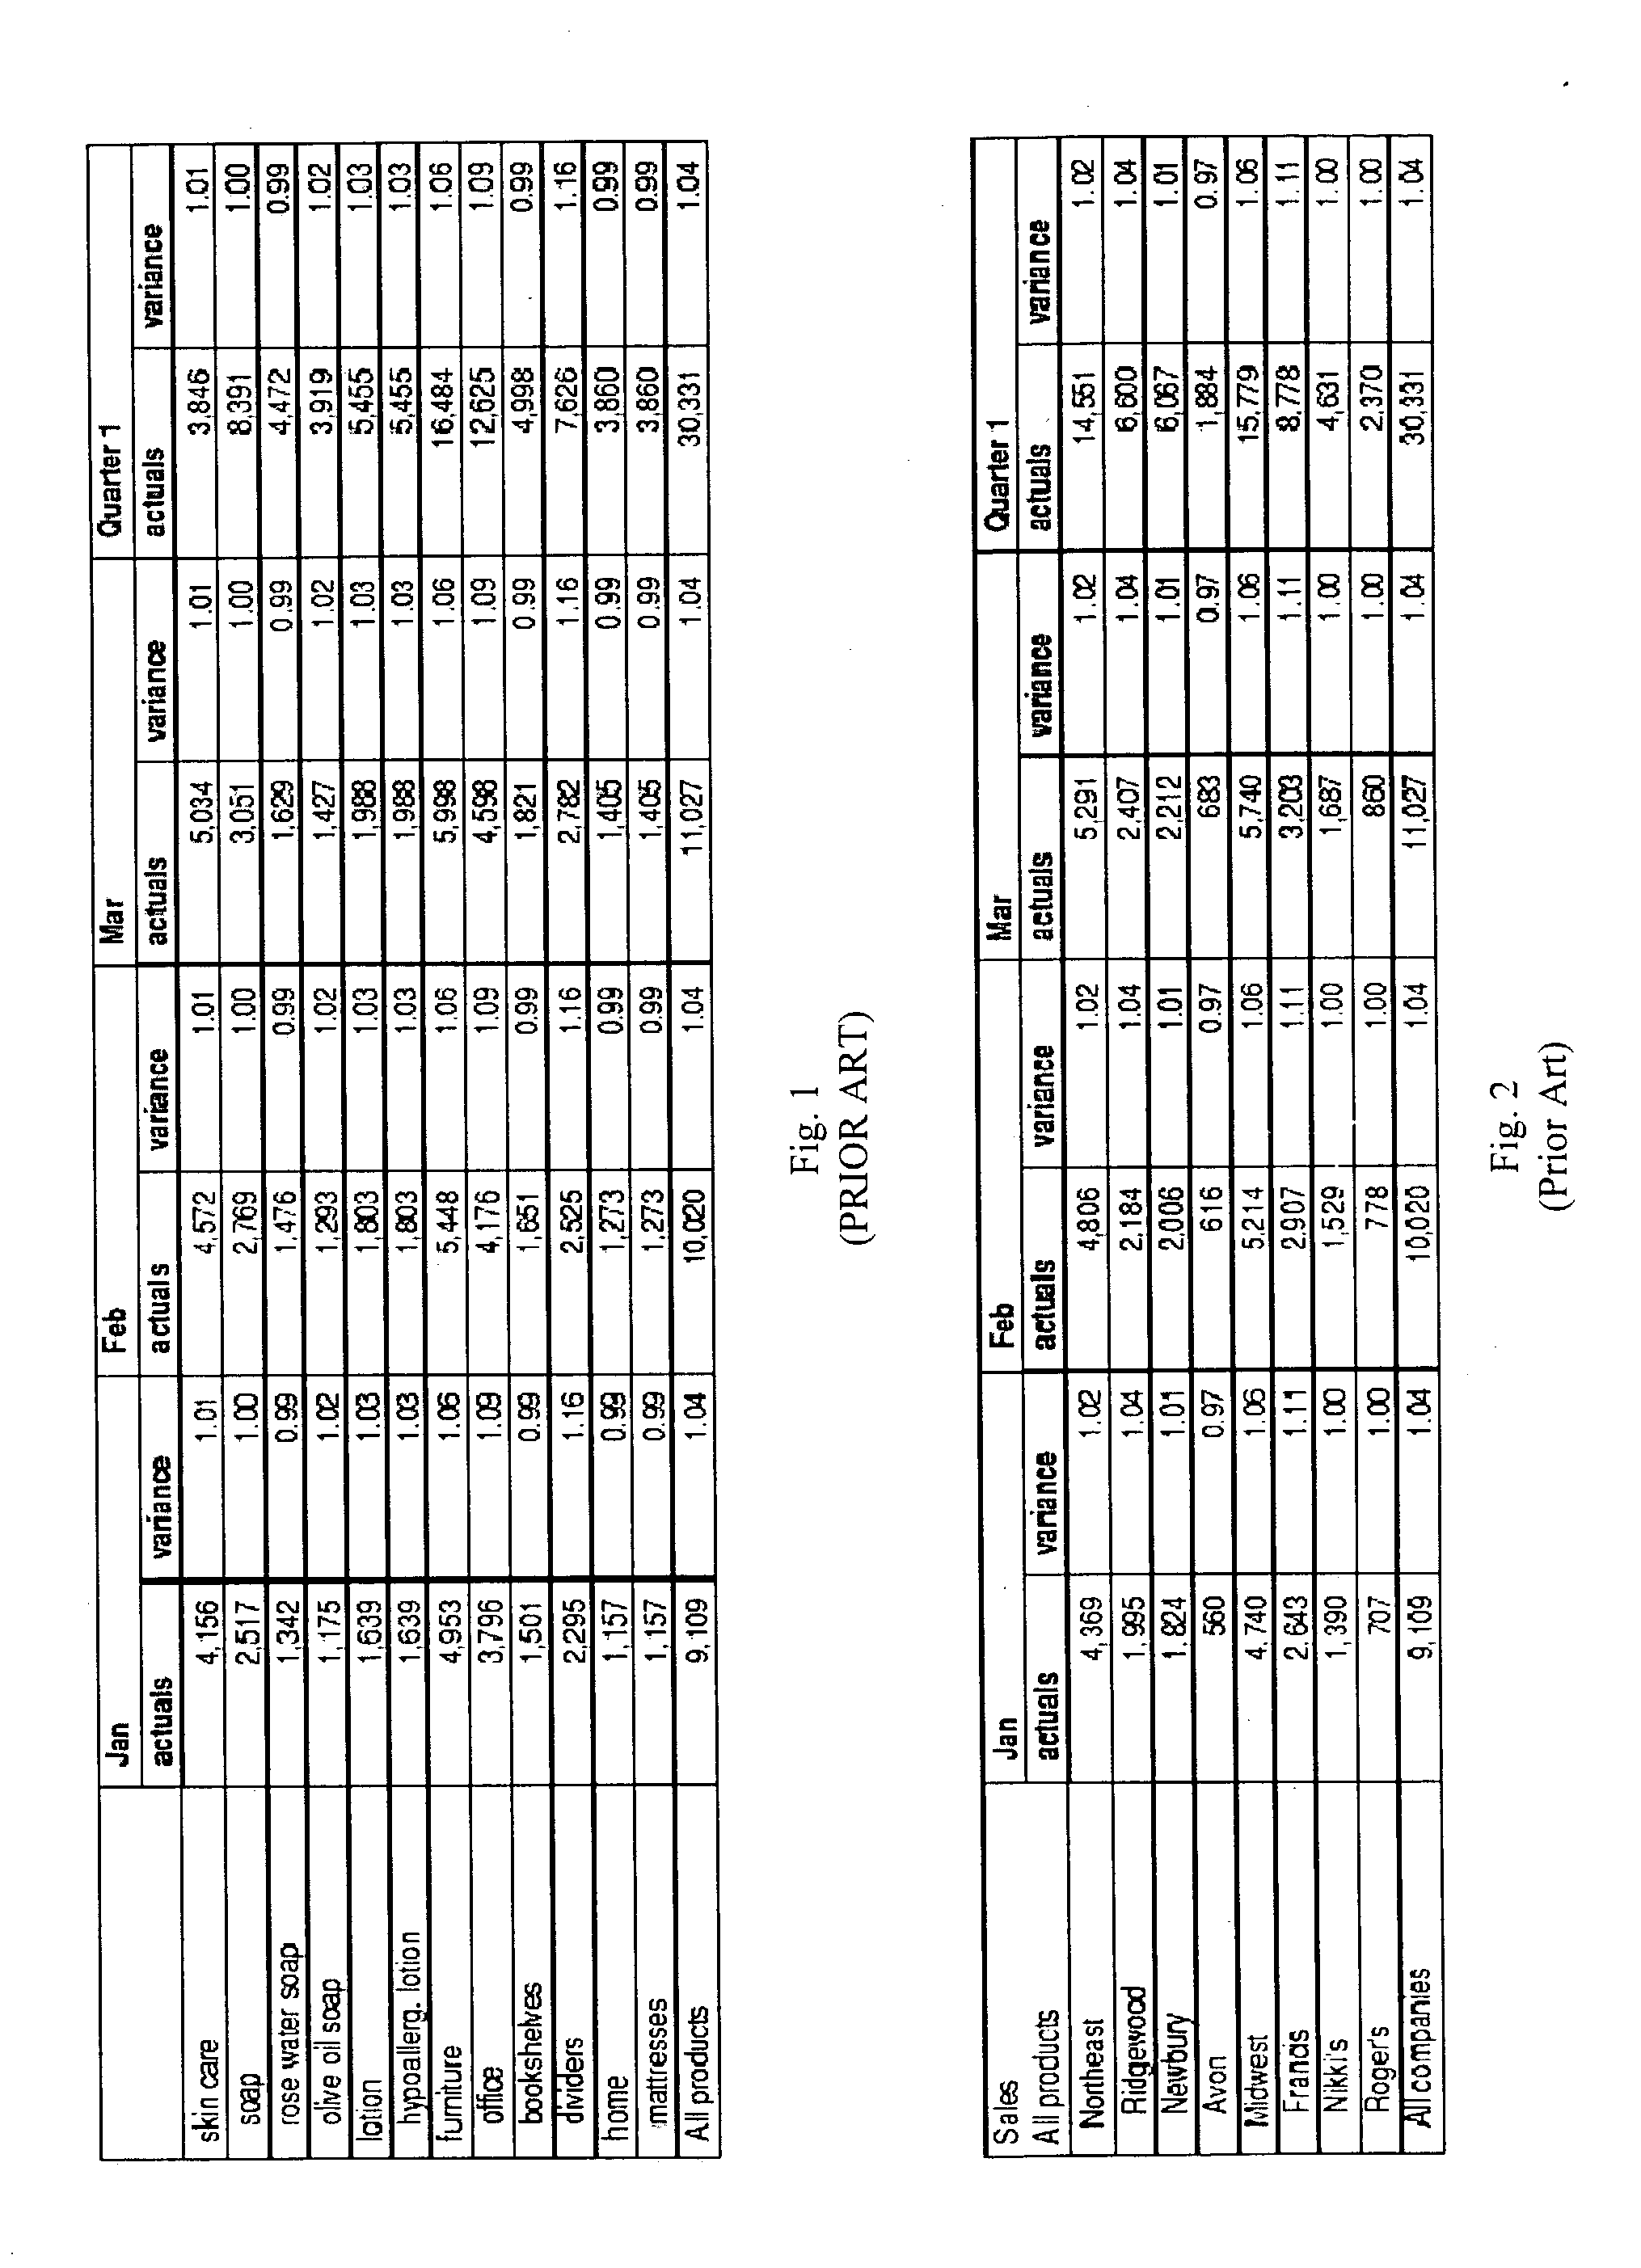
[0173] In some embodiments of the present invention, step 608 returns a set of tuples. Next, in step 610 a new tuple is derived from the set of tuples. This new tuple is then incorporated into the set of tuples for possible association with one or more panes 722 in the graphic that is specified by visual specification 550. In some instances a relational operator (e.g., a sorting operator, an aggregation operator, or a transforming operator) is used to create the new tuple. An example of this is an additional transformation that is performed to augment the query language. For example, it is known that an MDX query can easily aggregate all twelve months of a year into year total and then, say, aggregate multiple years into a multi-year total because this aggregation occurs up and down the hierarchy. But MDX cannot easily aggregate across a hierarchy (e.g., the totals for all Januaries regardless of the year). The present invention allows for aggregation across a hierarchy by applying one or more local transformations to a set of returned tuples (e.g., a set of tuples returned from one or more MDX queries). For example, in order to obtain totals for all Januaries regardless of year, one or more MDX queries are made to obtain the relevant tuples and then the month of January is aggregated across respective years in the MDX query results.
[0174] In some embodiments of the present invention, step 608 returns a set of tuples. A group is formed using all or a portion of the tuples in the set of tuples. Then a graphic based on the group is formed. Such embodiments are useful in instances where a multi-pane graphic is constructed. Examples of such graphics include a line that connects each tuple in a group or an area that encloses each tuple in the group.
[0175] In some embodiments, specification 550 organizes one or more panes 722 into a plurality of layers and each layer in the plurality of layers is assigned a tuple from a different database 558 that was characterized in step 602. In some embodiments, the specification 550 organizes one or more panes 722 into a plurality of columns and a plurality of rows and each column in the plurality of columns is assigned a tuple from a different database 558 that was characterized in step 602. In still other embodiments, the specification organizes the one or more panes into a plurality of columns and a plurality of rows and each row in the plurality of rows is assigned to a tuple from a different database 558 that was characterized in step 602. In still further embodiments, the specification organizes the one or more panes into a plurality of pages and each page in the plurality of pages is assigned to a tuple from a different database 558 that was characterized in step 602.
[0176] An overview of the steps performed in accordance with one embodiment of the present invention has been provided. The invention is highly advantageous because it takes advantage of the underlying hierarchy of one or more target database 558 in order to allow a user to more efficiently explore databases 558. A user can rapidly drill down hierarchical layers within each target database 558. For example, in one embodiment of the invention, the interface includes a "V "icon 708-6 (FIG. 7). When the user presses the "V "icon 708-6, the user is presented with a listing of all the levels of the dimension (including diverging levels in complex dimensional hierarchies in the target databases). When a new level is selected, this is interpreted as a drill down (or roll up) operation along that dimension and the current level is automatically replaced with the selected level (with the same qualification). Thus, the present invention allows the user to rapidly move between different levels of detail along a dimension, refining the visual specification 550 as the user navigates. At each level, the present invention forms efficient database queries using the novel table algebra of the present invention. Another advantage of the present invention is that a subset of tuples associated with a pane in step 616 can be used as a visual specification 550 in a new iteration of steps 605 through 616. For example, the user can select one or more tuples in the subset of the tuples associated with the pane as a basis for a new specification. Then, steps 606 through 616 can be repeated using the new specification. Still another advantage of the present invention is that each specification 550 can be expressed in a form that can be stored for later usage. Storage of specifications 550 allow for services such as the bookmarking of favored specifications as well as support for specification "undo" and "redo". In a specification "undo", for example, the specification 550 that was used in a previous instance of step 604 is obtained and used to perform steps 606 through 616.5.3 Illustrative Types of Database Hierarchy and Database Organization
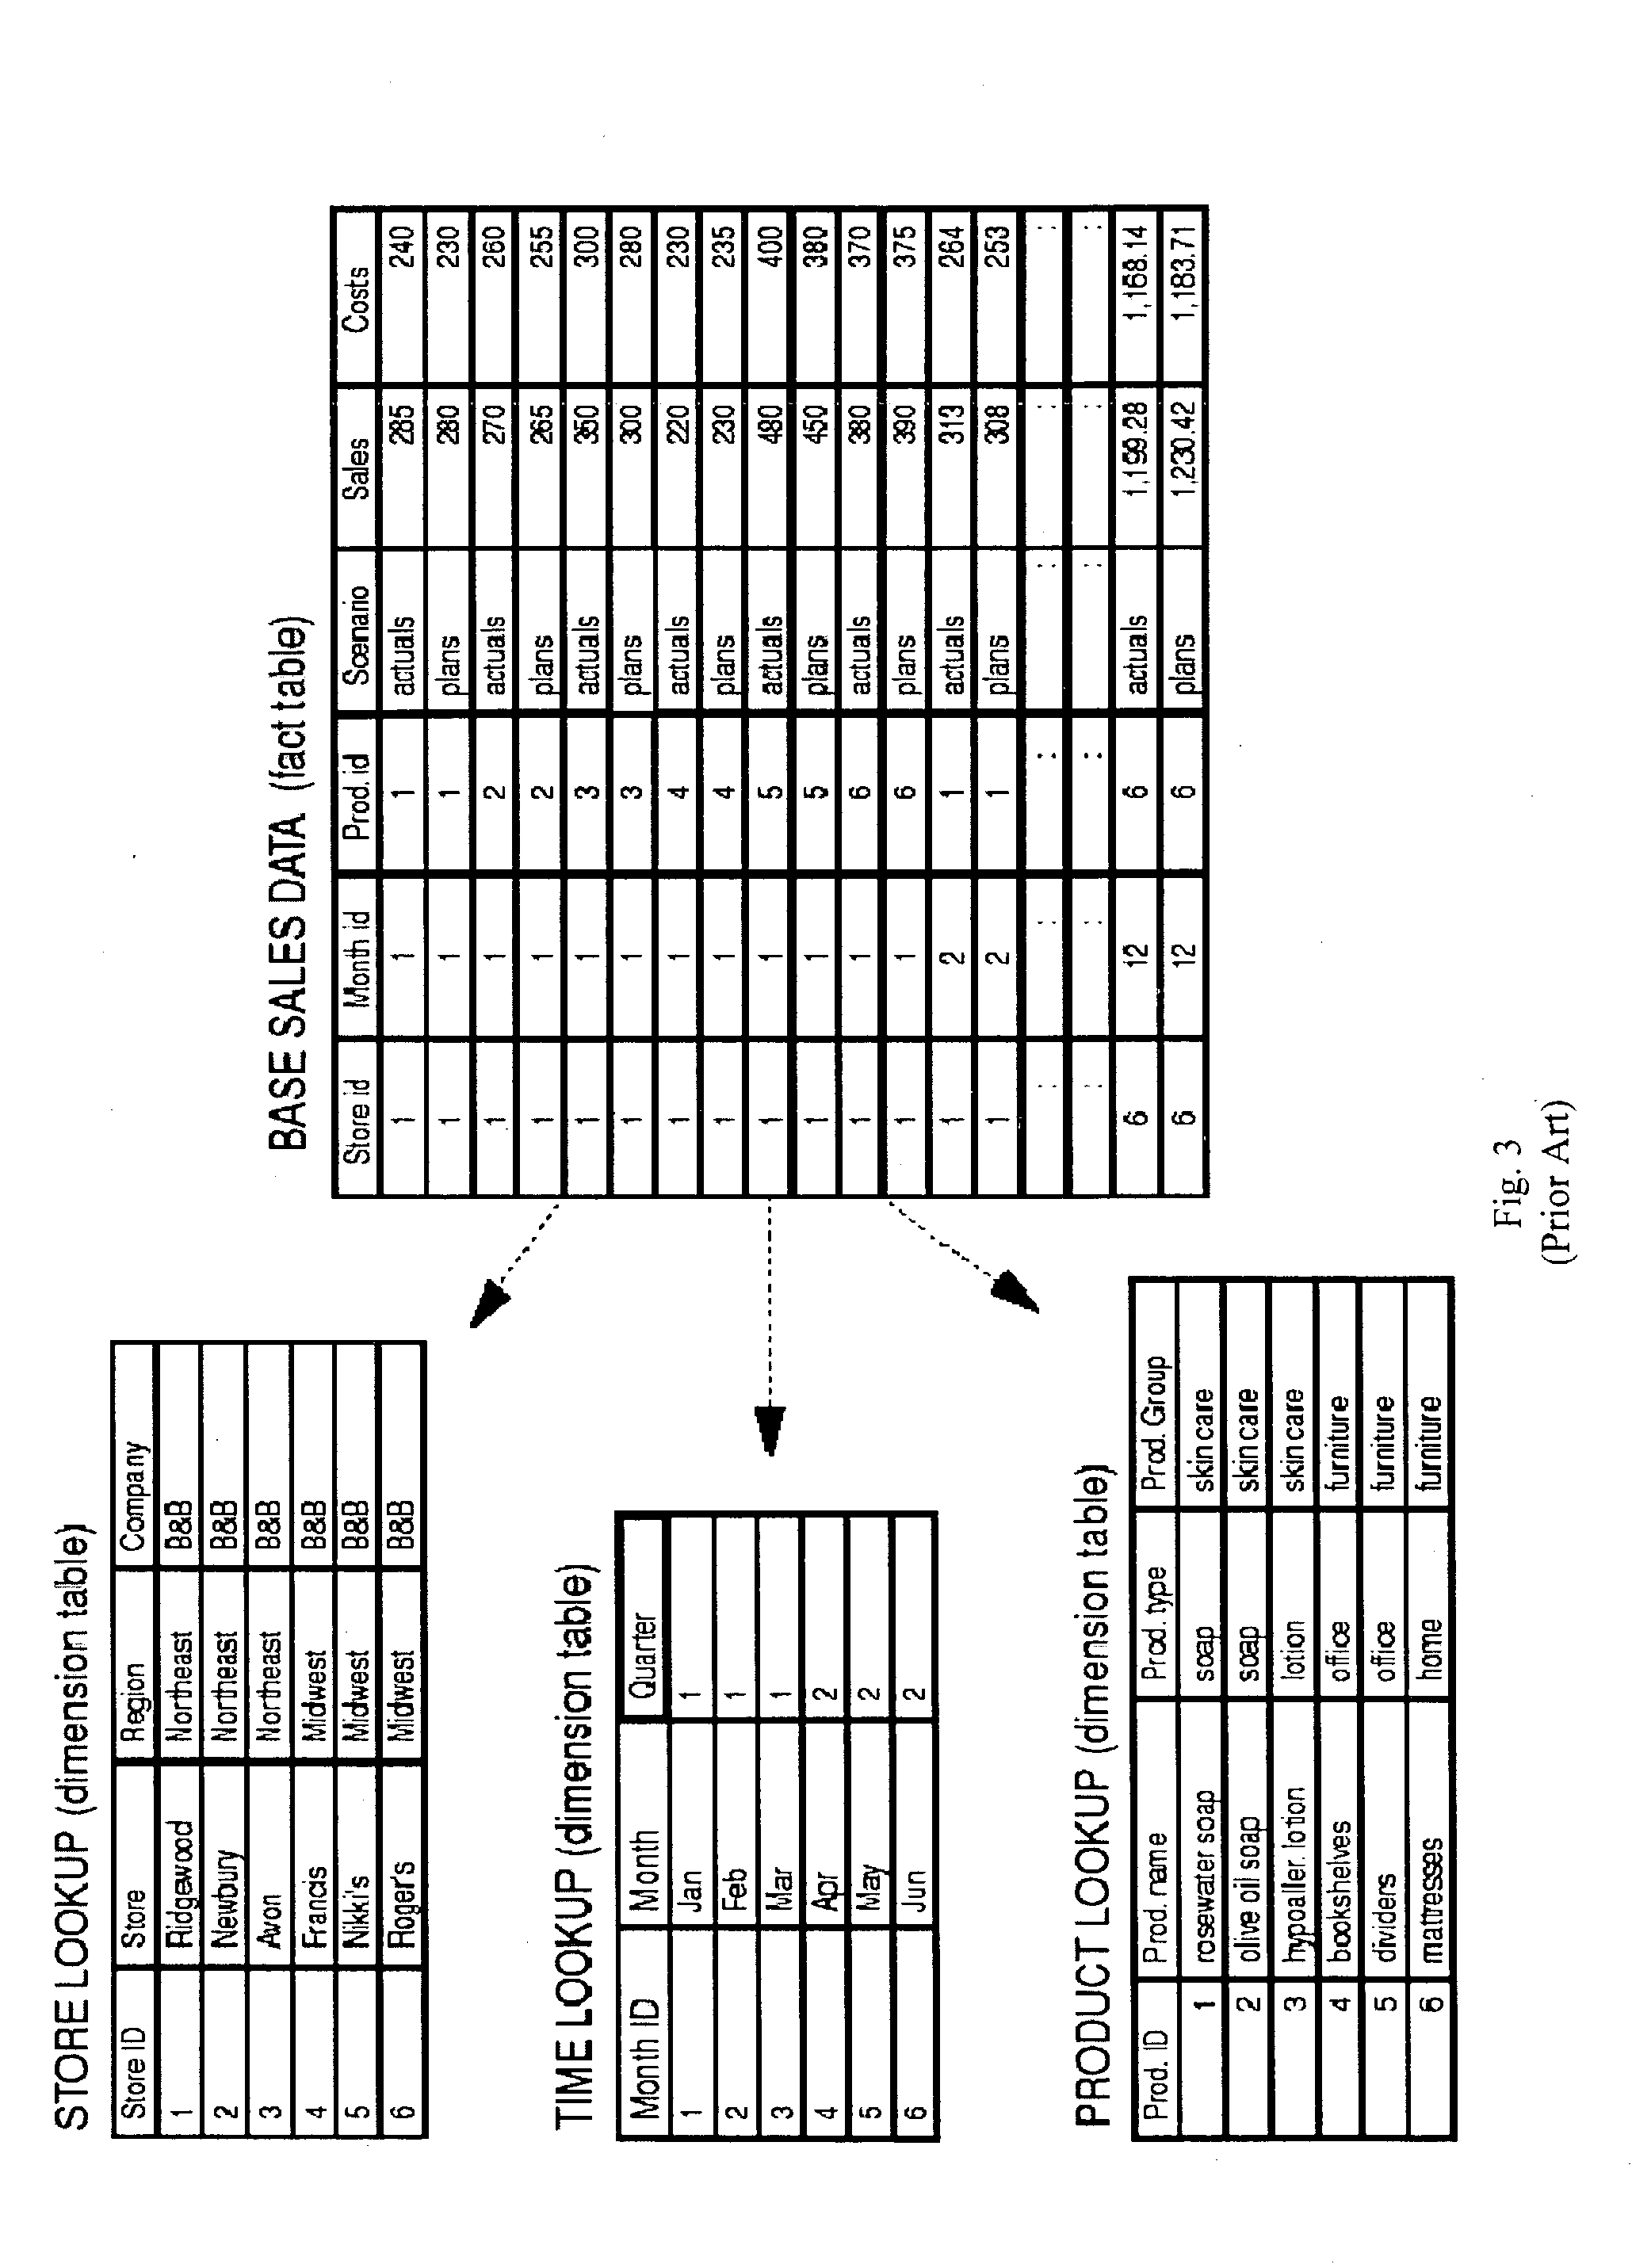
[0177] The present invention provides visualization techniques for the exploration and analysis of multidimensional analytic data stored in databases 558. One form of databases 558 is a data warehouse. Data warehouses are typically structured as either relational databases or multidimensional data cubes. In this section, aspects of relational databases and multidimensional data cubes that are relevant to the present invention are described. For more information on relational databases and multidimensional data cubes, see Berson and Smith, 1997, Data Warehousing, Data Mining and OLAP, McGraw-Hill, New York; Freeze, 2000, Unlocking OLAP with Microsoft SQL Server and Excel 2000, IDG Books Worldwide, Inc., Foster City, Calif.; and Thomson, 1997, OLAP Solutions: Building Multidimensional Information Systems, Wiley Computer Publishing, New York. In addition, it will be appreciated that in some embodiments database 558 does not have a formal hierarchical structure. In such embodiments, hierarchical structure for the database is derived by analyzing the database using user interface module 544.5.3.1 Data Organization

Problems solved by technology

One challenge with these databases is the extraction of meaning from the data they contain: to discover structure, find patterns, and derive causal relationships.
The sheer size of these data sets complicates this task.
Interactive calculations that require visiting each record are not plausible.
It is also not feasible for an analyst to reason about or view the entire data set at its finest level of detail.
Moreover, even when the data sets are small, their complexity often makes it difficult to glean meaning without applying aggregations or creating simplifying summaries.
However, there are more complex dimension hierarchies where the aggregation path can branch.
However, the task of effectively visualizing large databases imposes significant demands on the human-computer interface to the visualization system.
The path of exploration is unpredictable, and analysts need to be able to easily change both the data being displayed and its visual representation.
However, the original form of Polaris does not make use of the structure of hierarchically structured dimensions that are found in a hierarchical database.
Therefore, the original form of Polaris does not provide a satisfactory means for the exploratory analysis of databases having a hierarchical structure.
These visual query tools do not leverage the hierarchical structure that is already encoded in the database.
Because of this drawback, VQE, Visage, DEVise, and Tioga-2 are not satisfactory tools for facilitating exploratory analysis of databases having a hierarchical structure.
However, such methods do not provide tools to interactively construct and refine a wide range of displays to suit the analysis process.
However, such an approach limits the user, in this case to viewing a single hierarchical structuring of the data and a single ordering of that hierarchy to make proximity meaningful.
For this reason, XmdvTool, Spotfire, and Xgobi are not satisfactory tools for facilitating exploratory analysis of databases having a hierarchical structure.
However, VisDB fails to take advantage of the hierarchical structure of databases.
For example, VisDB does not provide an extensive ability to drill down and roll up data, thereby allowing the analyst to get a complete overview of the data set before focusing on detailed portions of the database.
For this reason VisDB is not a satisfactory tool for facilitating exploratory analysis of databases having a hierarchical structure.
The drawback with the approaches described in this section is that they are focused on a particular algorithm or a single phase of the discovery process.
For these reasons, known visualization and data mining tools do not provide a satisfactory way to explore and analyze databases that have a hierarchical structure.
However, the drawback of such visualization systems is that they present static graphics that the user cannot interact with in order to refine database queries or otherwise explore database content.
However, pivot tables are limited to text-based displays.
However, the Table Lens does not support queries.
In addition, FOCUS is limited to object-attribute tables that do not have hierarchical structure.
The drawback with these known formal graphical specifications is that they do not provide any tools for generating a database query.
Furthermore, Bertin's work is purely theoretical and was never implemented as a computer program.
As such, these known formal graphical specifications do not provide a satisfactory way to analyze databases.
From this survey, it is apparent that known visualization and data mining tools do not provide a satisfactory way to explore and analyze databases that have a hierarchical structure.

Method used


Image

  • Computer systems and methods for the query and visualization of multidimensional databases
  • Computer systems and methods for the query and visualization of multidimensional databases
  • Computer systems and methods for the query and visualization of multidimensional databases

Examples


Embodiment Construction

[0078] The present invention provides a method for exploiting the hierarchical information present in databases in order to facilitate exploration of such databases. The present invention uses a novel formulism to accomplish this task. A user is allowed to enter a search query that is consistent with the novel formalism of the present invention. When such a search query is constructed, the systems and methods of the present invention take advantage of the formalism and the hierarchical information associated with the target database to service the query using fewer existence scans and other time consuming database functions than are found in known data exploration programs and techniques. Additional features and advantages of the present invention are disclosed in the following sections.

5.1 Overview of an Exemplary System

[0079] FIG. 5 shows a system 500 that facilitates exploratory analysis of databases, such as data warehouses, in accordance with one embodiment of the present inven...


PUM


Abstract

A method and system for producing graphics. A hierarchical structure of a database is determined. A visual table, comprising a plurality of panes, is constructed by providing a specification that is in a language based on the hierarchical structure of the database. In some cases, this language can include fields that are in the database schema. The database is queried to retrieve a set of tuples in accordance with the specification. A subset of the set of tuples is associated with a pane in the plurality of panes.

Description

1. FIELD OF THE INVENTION[0002] This invention relates generally to an interactive visual exploration tool that facilitates exploratory analysis of databases having a hierarchical structure.2. BACKGROUND OF THE INVENTION[0003] In the last several years, large databases have become common in a variety of applications. Corporations are creating large data warehouses of historical data on key aspects of their operations. Corporations are also creating many small databases using desktop applications that are created to examine some specific aspect of their business. International research projects such as the Human Genome Project and the Sloan Digital Sky Survey are generating massive scientific databases. One challenge with these databases is the extraction of meaning from the data they contain: to discover structure, find patterns, and derive causal relationships. The sheer size of these data sets complicates this task. Interactive calculations that require visiting each record are no...

Claims


Application Information

Patent Timeline
Patent Type & Authority Applications(United States)
IPC IPC(8): G06FG06F7/00G06F17/30
CPCG06F17/30592G06F2216/03Y10S707/99943Y10S707/99945G06F17/246Y10S707/99944Y10S707/956Y10S707/959Y10S707/954Y10S707/99942G06F16/248G06F16/212G06F16/221G06F16/252G06F16/282G06F16/283G06F16/2282G06F16/26G06F3/04842G06F40/18G06F40/177G06F3/0482G06F3/04847
Inventor STOLTE, CHRISTANG, DIANE L.HANRAHAN, PATRICK
Owner THE BOARD OF TRUSTEES OF THE LELAND STANFORD JUNIOR UNIV
Learn More