Methods for measurement of magnetic resonance signal perturbations

a magnetic resonance signal and perturbation technology, applied in the field of magnetic resonance signal fluctuation measurement, can solve the problems of high temporal resolution, no non-invasive spatial resolution technology, direct measurement, etc., and achieve the effect of reducing the number of invasive measurements, and reducing the accuracy of invasive measurements

Inactive Publication Date: 2005-02-10
DECHARMS RICHARD CHRISTOPHER
View PDF18 Cites 128 Cited by
  • Summary
  • Abstract
  • Description
  • Claims
  • Application Information

AI Technical Summary

Benefits of technology

[0005] In some embodiments, the present invention involves a device comprising means for measuring at least two MR signals and means for comparing at least two MR signals. Such a device can have means for measuring at least two MR signals simultaneously. Such a device can have means for measuring at least two MR signals after a stimulus. Examples of stimulus include, but are not limited to, visual image, a visual sequence, an auditory sound, an auditory sequence, a tactile sensation, an electrical stimulus to a peripheral location, an electrical stimulus to the central or peripheral nervous system, a pharmacological or other physiological stimulus, a perceptual stimuli, an instruction, and a set of instructions. The above device can further comprise means for amplifying at least two MR signals. Such a device can further comprise means for determining free induction decay of at least two MR signals in substantially real time. Such a device can further comprise an amplifier and a computing unit, wherein the computing unit compares at least two MR signals from at least two sources. The two or more MR signals can be from at least one voxel or at least two voxels. Such a device can have a computing unit that compares at least two MR signals by differentially measuring at least two MR signals following a single RF excitation. In some embodiments, the two or more MR signals are separated in time by 0.01, 0.1, 1, 5, 10, 100, 1000, or 10000 ms. Such a device can have a computing unit that differentially measures at least two MR signals in a substantially real time. Such a device can also have a computing unit that differentially measures at least two MR signals within a time period of less than 10 seconds.
[0006] In some embodiments, the present invention relates to a method for measuring a MR perturbation, wherein such method comprises the step of differentially measuring MR signals from at least two receivers from an object. Furthermore, in some embodiments, at least one receiver receives MR signals from a reference location and at least one receiver receives MR signal from a test location. In some embodiments, the above method further comprises the step of applying RF to the reference locations and the test locations. In some embodiments, the above RF produces free induction decay data from the reference locations and the test locations. In some embodiment, the above methods further comprise the step of converting the free induction decay to a series of phase or magnitude measurements per time period. In some embodiments, free induction decay data is analyzed in substantially real time or in less than 10 seconds. In some embodiments, the MR signals are measured immediately after a stimulus. In some embodiments, such stimulus is selected from the group consisting of a visual image, a visual sequence, an auditory sound, an auditory sequence, a tactile sensation, an electrical stimulus to a peripheral location, an electrical stimulus to the central or peripheral nervous system, a pharmacological or other physiological stimulus, a perceptual stimuli, an instruction, and a set of instructions. In some embodiments, the above methods further comprise the step of comparing MR signals prior to presentation of a stimulus to MR signals immediately following the presentation of the stimulus. The MR signals in any of the methods herein may be received simultaneously, amplified, or preferably, amplified before they are differentially measured. Any of the methods herein can be used to detect or localize MR signals in an object, such as a circuit, a living organism, tissue, or organ (e.g., brain or heart). When measuring at least two MR signals such signals are preferably separated in time by 0.01, 0.1, 1, 5, 10, 100, 1000, or 10000 ms. Measurements preferably occur in a substantially real time or in less than 10 seconds.
[0007] The present invention also relates to a method for diagnosing an individual susceptible or experiencing a central nervous system condition comprising the step of differentially measuring MR signals from the individual using at least two receivers. A central nervous system condition can be one that is selected from the group of conditions identified in FIG. 16. The above method can be accomplished using one or more receivers to receive an MR signal from a region of the brain selected from the group consisting of the regions identified in FIG. 15. The above method may further include the step of selecting a target voxel. Preferably the target voxel is selected using anatomical localizer images or functional localizer images. Furthermore, the above method may further include the step of comparing differential measurements of MR signals from the individual susceptible or experiencing a central nervous system condition and a healthy individual. The above method may further include the step of differential measuring, which occurs in real time. The above method contemplates real time measurements to be used to adjust an MR measurement parameter.
[0008] In some embodiments, the invention herein contemplates a method for localizing neuronal currents, wherein the method comprises the steps of: receiving an MR signal from a receiver; amplifying the MR signal; converting the MR signal into complex MR data; and comparing the data with an independent reference signal to obtain a differential measurement of MR signal. In some embodiments, the independent reference signal may be obtained by means other than MR imaging, such as from a gradiometer or a magnetometer. The MR signal and the independent reference signal are preferably made less than 100 seconds apart. The MR signal can further be used to produce a free induction decay. The above method and any other method herein may also include the step of providing a stimulus. Such may be time-synchronized following an RF excitation.

Problems solved by technology

To date, there is no non-invasive technology for spatially resolved, high temporal resolution, direct measurement of neuronal signals from within the brain.
It is also not straightforward to determine the exact relationship between observed hemodynamic activations and underlying neural function [Boynton, Engel et al.
Finally, reliance on hemodynamics may also create an inherent limit in spatial resolution governed by the vascular system.
MEG and EEG enable non-invasive measurement of neuronal currents with high temporal resolution, but more limited spatial capability.
For deeper-lying structures, localization is considerably more problematic.
Many psychological and neurological conditions arise because of inadequate levels of activity or inadequate control over discretely localized regions within the brain.
This may take place because the electromagnetic field causing the change is not perfectly homogeneous within the volume from which the measurement is made (for example an imaging voxel or spectroscopy voxel).
Since the electromagnetic field leads to a change in the homogeneity of the magnetic field, this can lead to susceptibility induced decreases in the signal intensity from the measured voxel.
A challenge in the measurements just described is that many electromagnetic fields of interest may be very small 240 (e.g. in the range of 10-15 to 10-6 Tesla depending upon the magnitude of the field) relative to the field strength of measurement (e.g. 0.1 to 10 Tesla).
In addition, a number of noise sources may produce changes in the phase, magnitude, orientation, or other characteristics of the MR signal.
One method for measuring a reference signal is to use a second receive coil which measures an MR signal from a reference location, this location being susceptible to some of the same ‘common mode’ noise sources as the source location, but differentially susceptible to the signal of interest.
Remaining, unpredictable variance at the source location will reflect uncorrelated noise, and independent signals.

Method used


Image

  • Methods for measurement of magnetic resonance signal perturbations
  • Methods for measurement of magnetic resonance signal perturbations
  • Methods for measurement of magnetic resonance signal perturbations

Examples


examples

[0212] Theoretical Basis and Previous Investigations of MR Phase Measurement

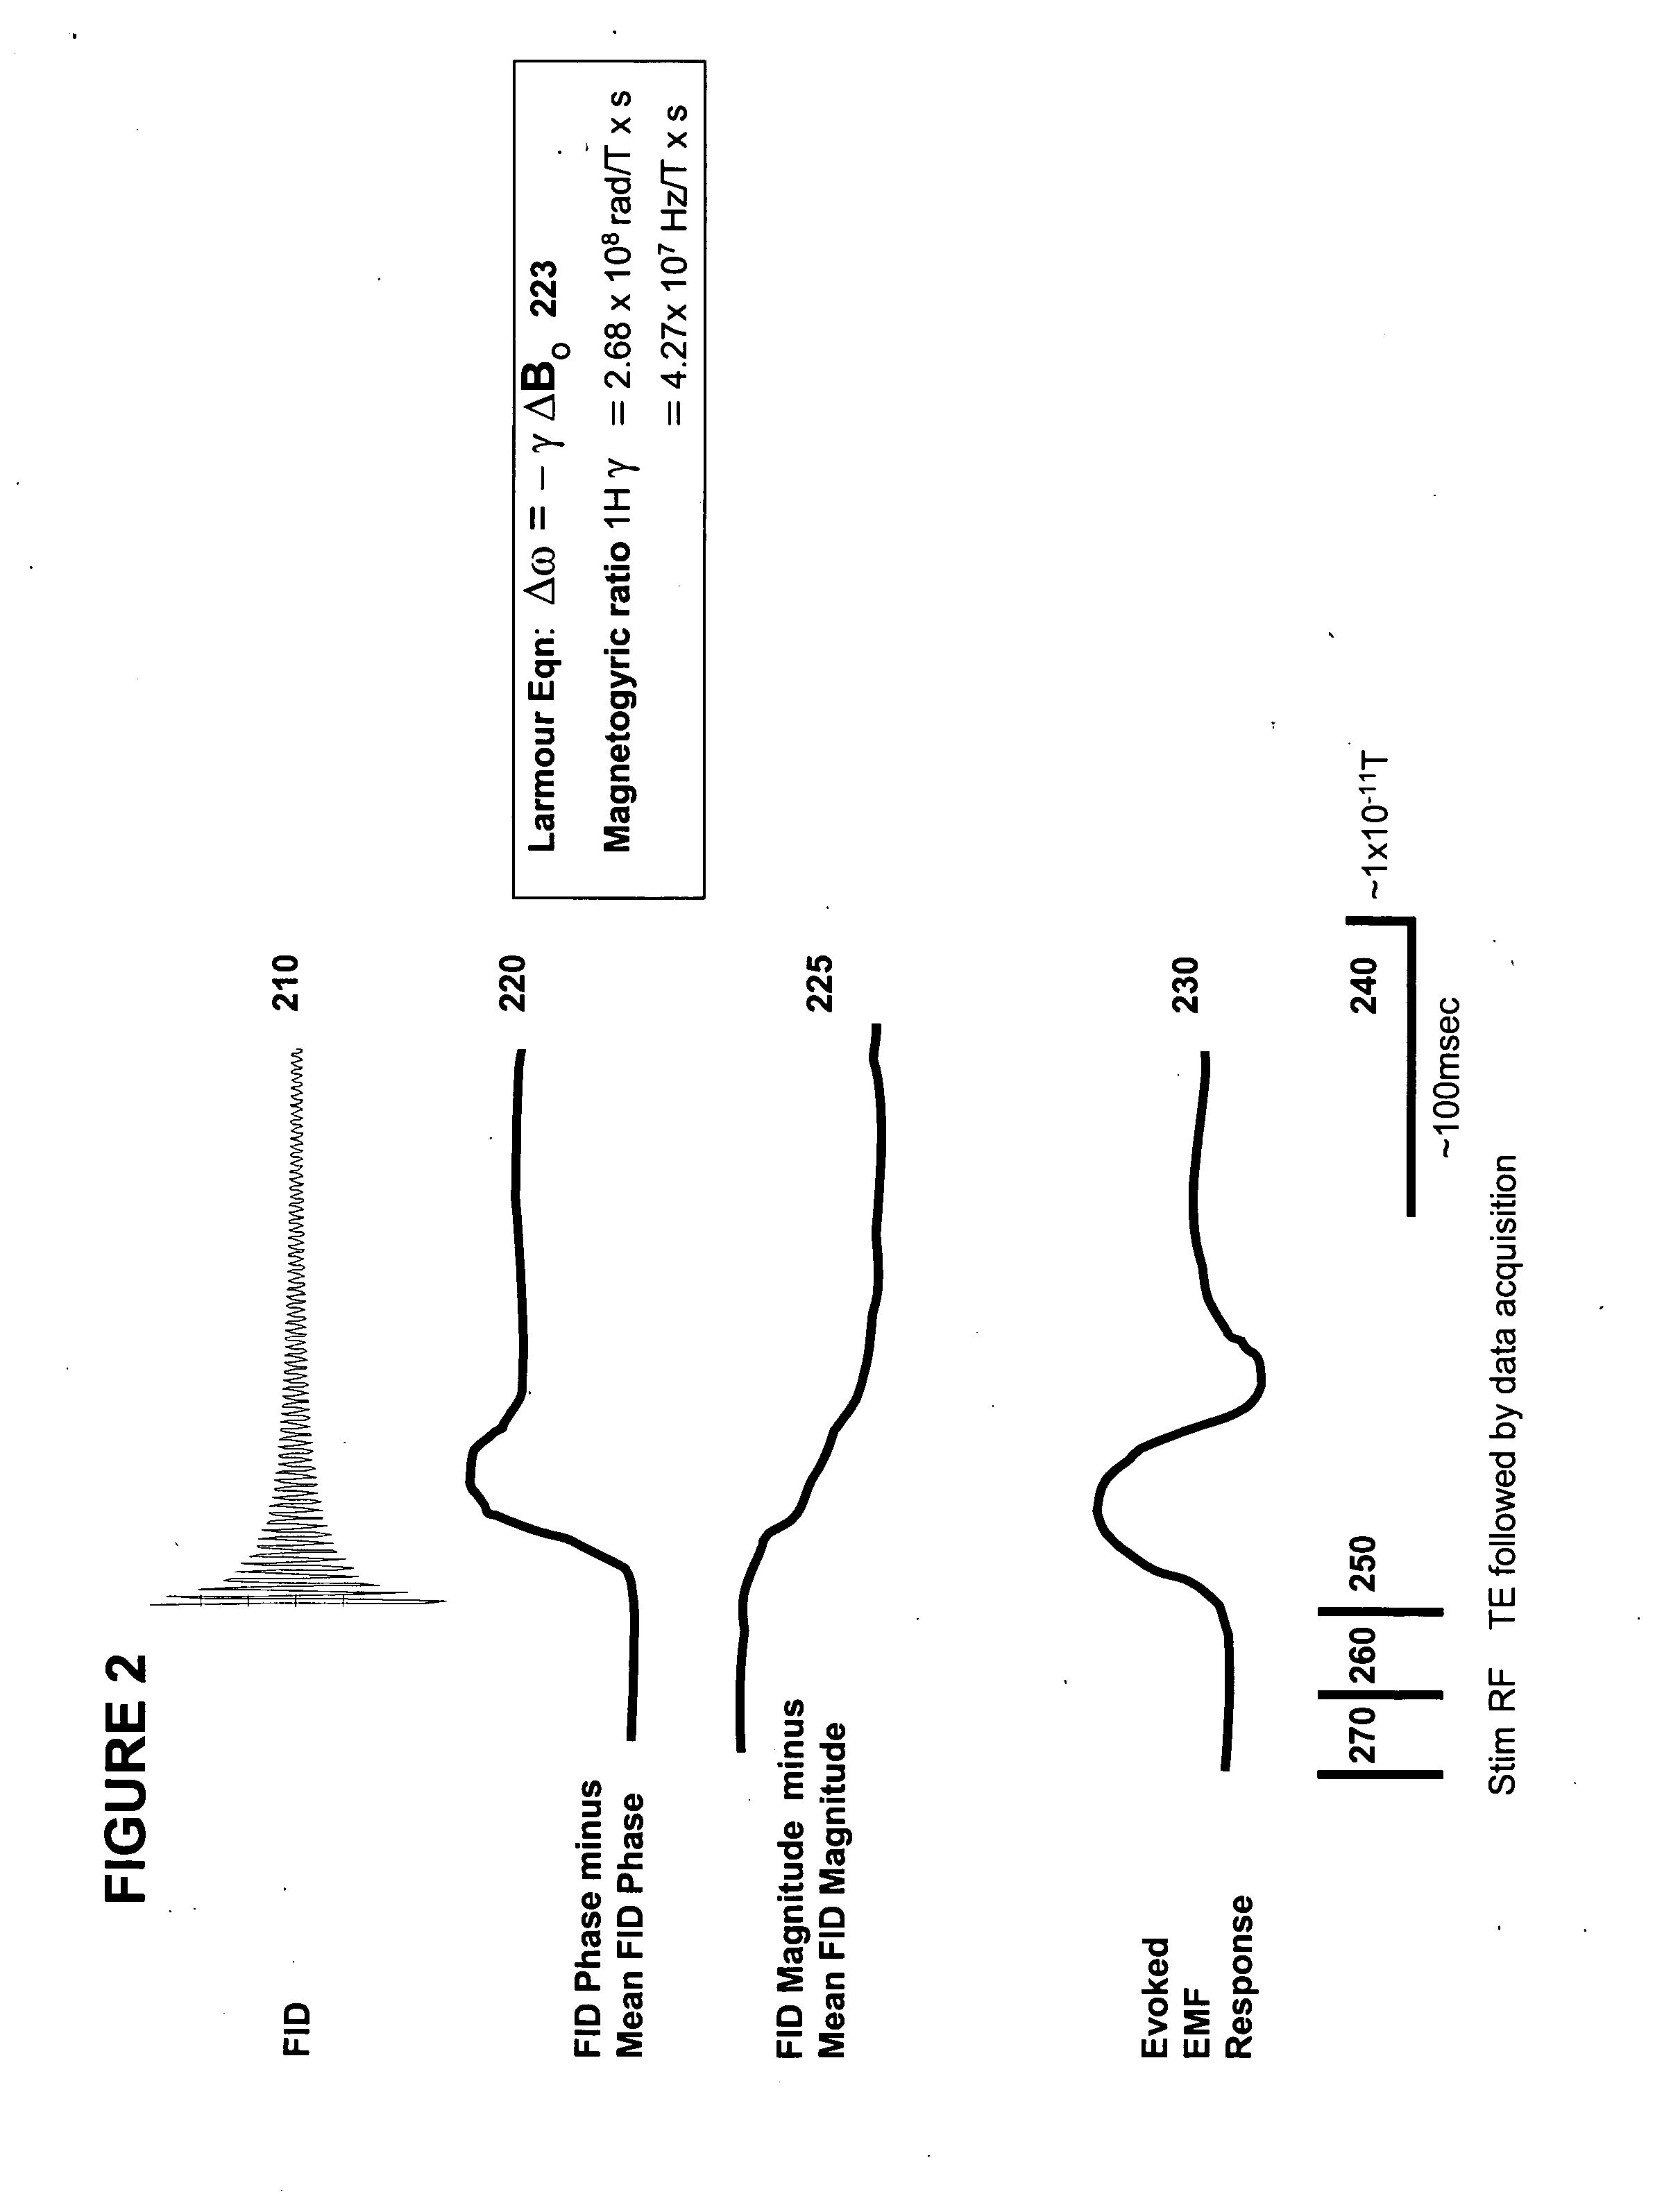
[0213] Precise measurements of Bo fluctuations using MR are explained by the relation that σφ=1 / SNR, whereσφ is the MR phase noise in radians, and SNR is the signal to noise ratio of the MR magnitude signal. The phase value may be substituted into the Larmour equation (expressed in terms of phase): Δφ(r)=γBz(r)TE, where Δφ(r) is the change in phase at a point r resulting from a perturbation of the Bz, TE is the duration of phase accumulation prior to measurement, and γ is the magnetogyric ratio. At 1.5T, an MR signal resonates over 6.4 million cycles during a 100 ms period. Since the MR phase signal represents a small fraction of one cycle, a modest phase precision of 1 / 100th of a cycle (0.06 radians) at 100 ms predicts a ΔB0 measurement precision of 1 part in 100×6.4 million, or 4×10⁻⁹ T. Therefore, MR phase measures B0 fluctuations with surprising precision. Nyquist sampling theory limits the frequency re...

example

Measurement of Neuronal Currents In Vivo

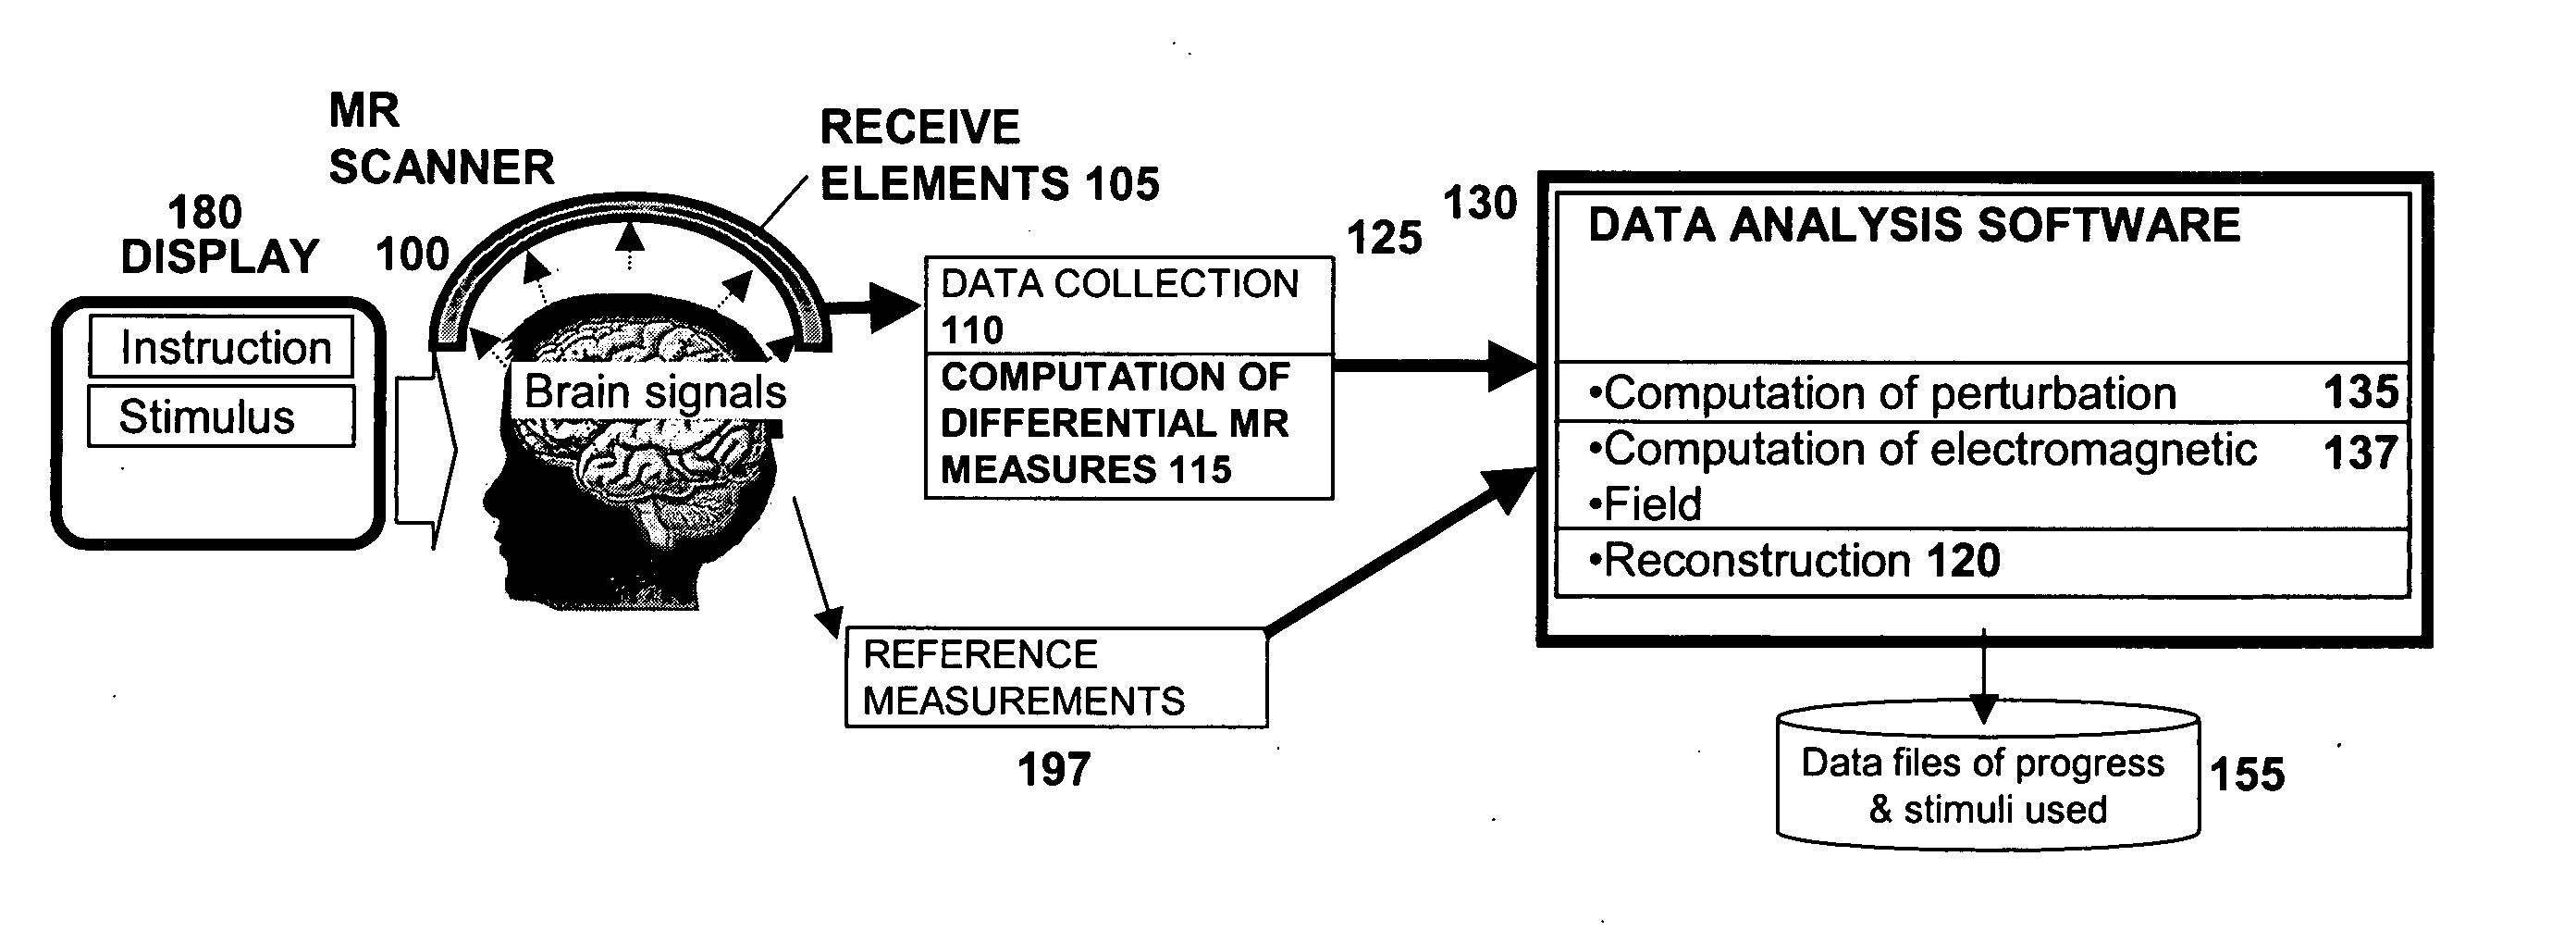
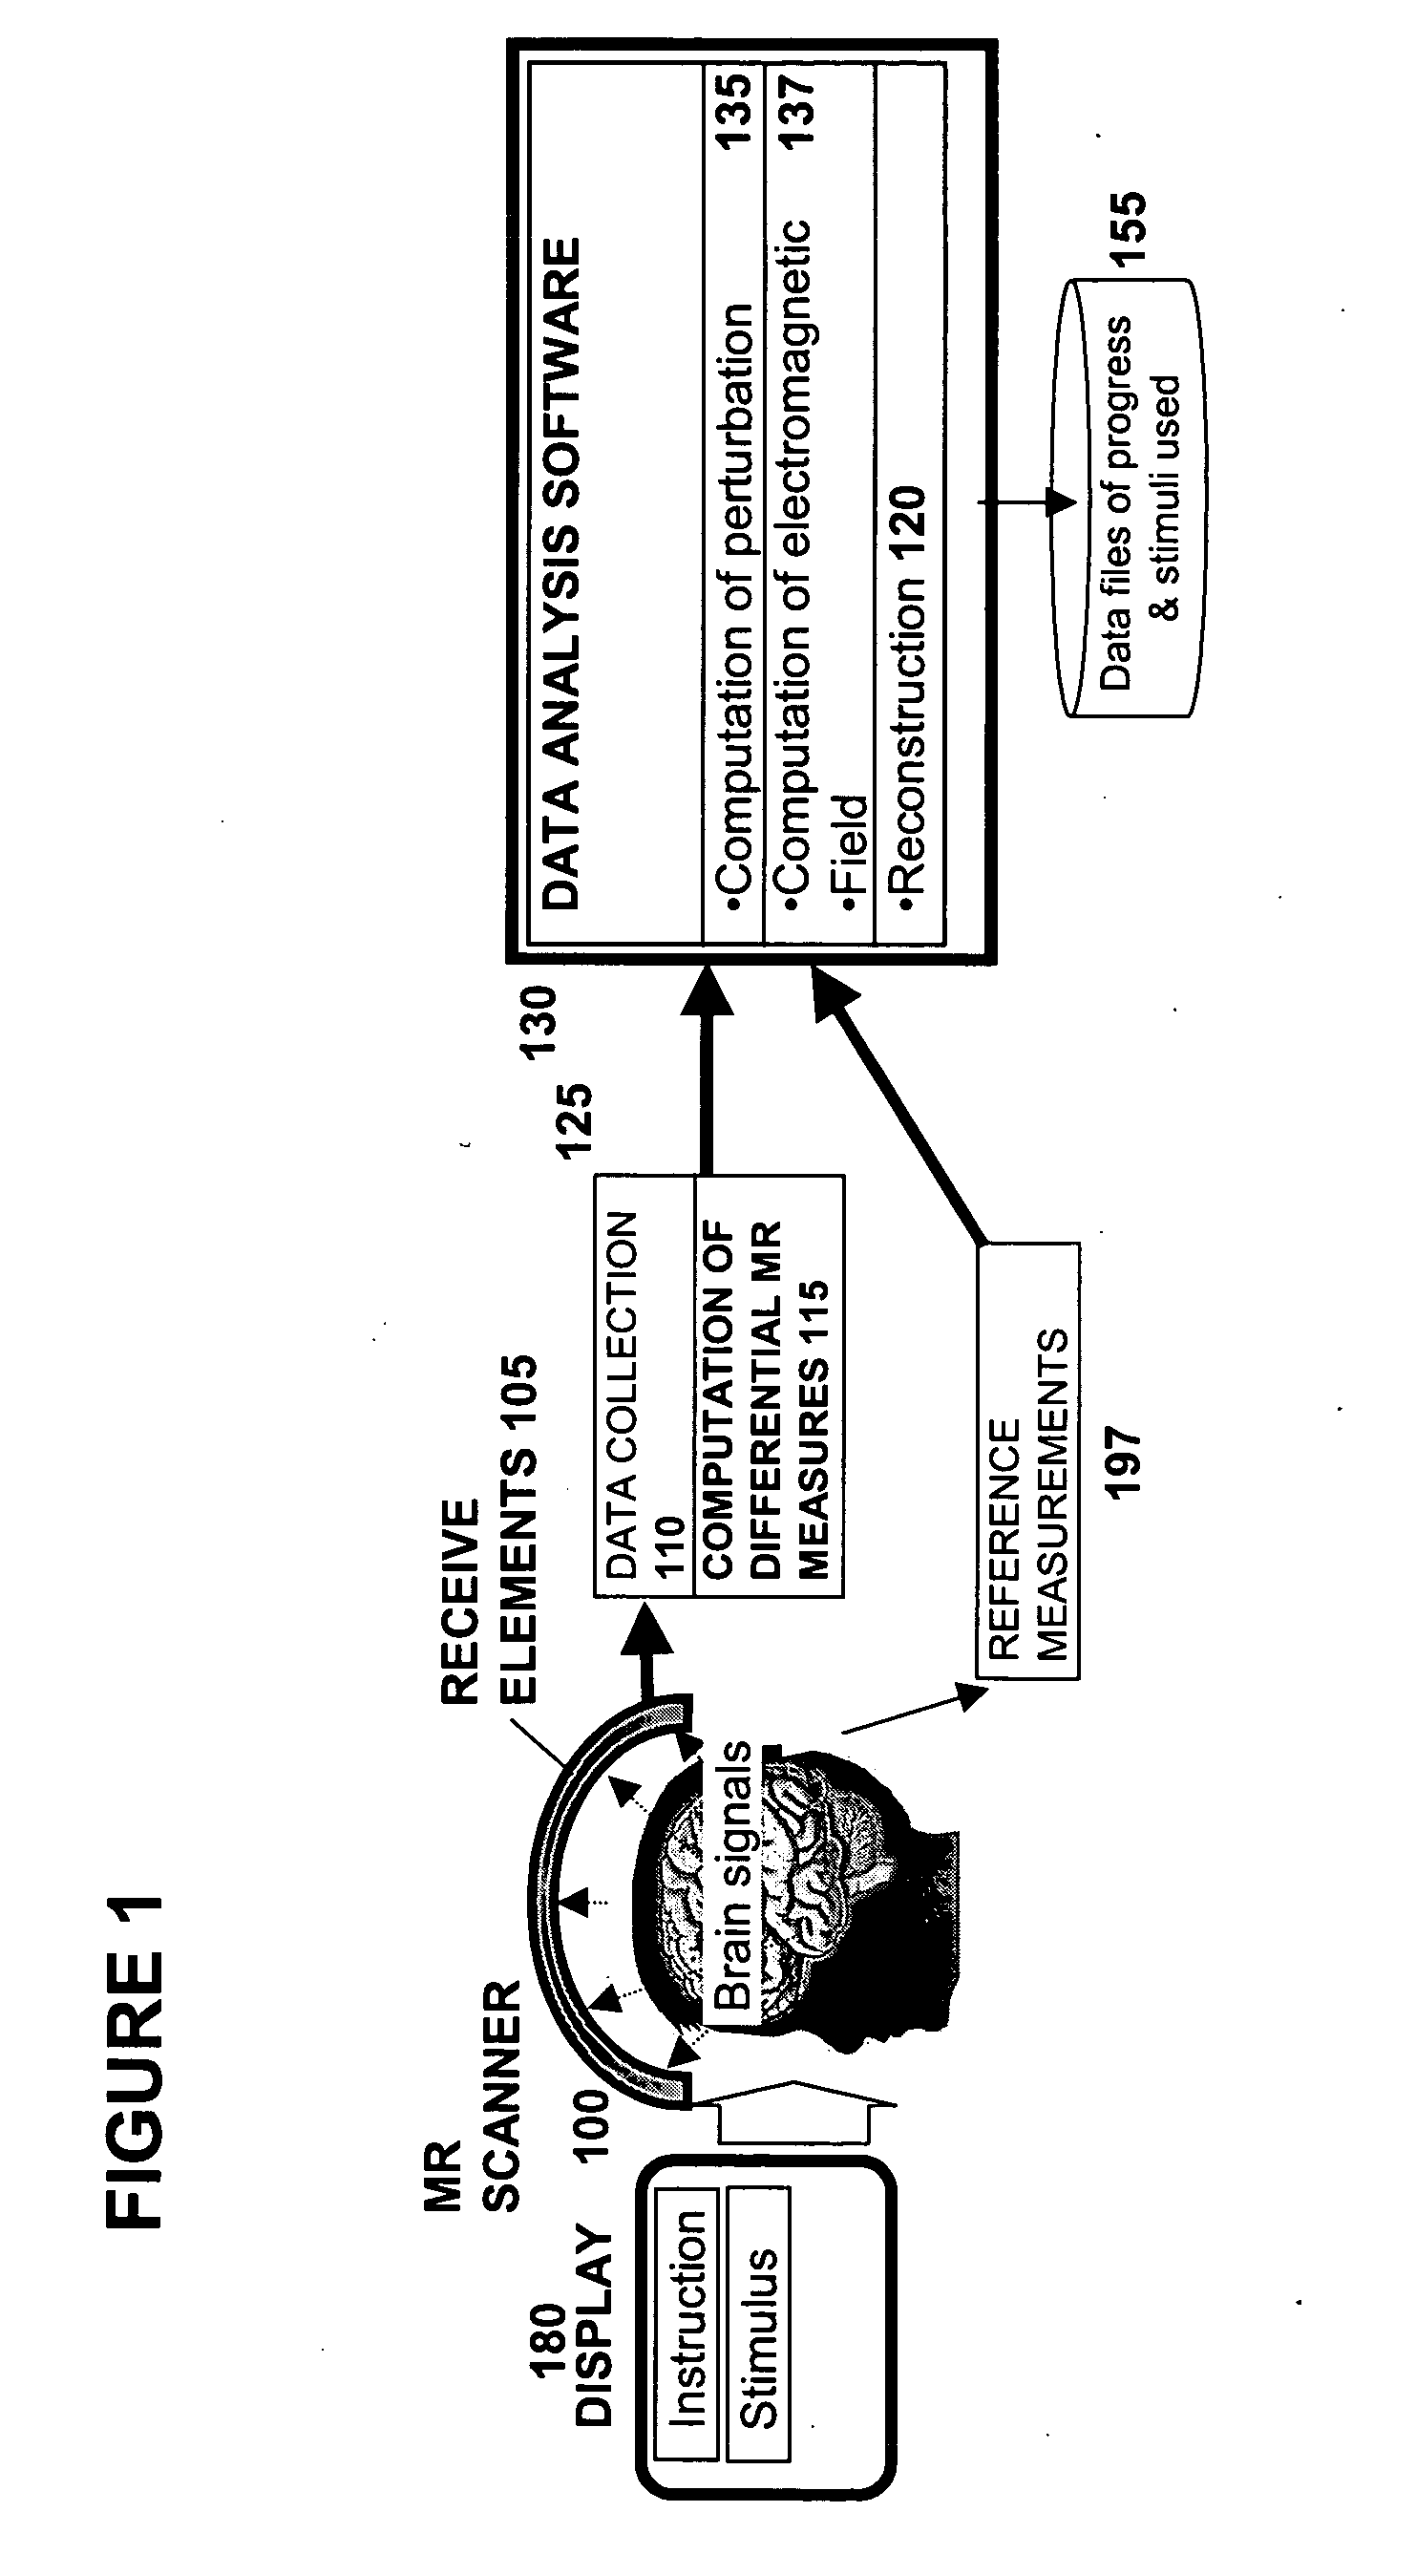
[0277] Rationale Neuronal currents lead to fluctuations in B0 with magnitudes within the precision of methods disclosed here. Therefore, the MR phase timecourse of FIDs may be compared with and without an evoked neuronal response to determine the effect of the neuronal response. In order to induce a repeatable neuronal current, a highly salient, flashed visual checkerboard stimulus may be presented to subjects, precisely synchronized to MR measurements lasting for 120 ms following the stimulus.

[0278] Protocol Differential MR phase data may be collected using a target voxel selected in the visual cortex with a 5″ surface coil placed adjacent, while a differential signal was measured from a second voxel in a frontal region using a second receive coil a similar distance from the chest. Stimuli may be presented using a DLP projector as diagrammed in Visual Stimulus Protocol #1.

[0279] Results Neuronal currents may be measured using this approach...


PUM


Abstract

The present invention relates to methods, software and systems for monitoring fluctuations in magnetic resonance signals. These methods may be used for measurements of the human brain and nervous system, and may be used for measuring electric currents and electromagnetic fields internal to an object. This method may include the use of a reference signal to accomplish differential recording of electromagnetic fields from two or more spatial locations.

Description

CROSS-REFERENCE [0001] This application claims the benefit of U.S. Provisional Application, entitled “Methods For Physiological Monitoring—EmfMRI,” filed May 15, 2004 and U.S. Provisional Application No. 60 / 475,931, filed Jun. 3, 2003. [0002] This application is also related to the following co-pending patent applications: U.S. Ser. No. 10 / 628,875, filed Jul. 28, 2003, now U.S. Publication No. US-2004 / 0092809 A1, entitled “Methods for Measurement and Analysis of Brain Activity”, and U.S. Ser. No. 10 / 066,004, filed Jan. 30, 2002, now U.S. Publication No. US-2002 / 0103429 A1, entitled “Methods for Physiological Monitoring, Training, Exercise and Regulation”, each of which is incorporated herein by reference in its entirety.”SUMMARY OF THE INVENTION [0003] The present invention is directed to various methods relating to the measurement of fluctuations of magnetic resonance signals. These fluctuations may be used to measure fluctuations induced by electrical current and electromagnetic f...

Claims


Application Information

Patent Timeline
Patent Type & Authority Applications(United States)
IPC IPC(8): A61B5/05A61B5/055G01RG01R33/48
CPCA61B8/0808G01R33/4806
Inventor DECHARMS, RICHARD CHRISTOPHER
Owner DECHARMS RICHARD CHRISTOPHER
Why Eureka
Try Eureka