Method for multidimensional visual correlation of systems management data displaying orchesteration action threshold

a system management and multi-dimensional technology, applied in the field of computer and data processing systems, can solve the problems of increasing complexity, unable to provide the necessary services and capabilities users require, and unable to meet the needs of stand-alone computers, and achieve the effect of optimizing system performan

Inactive Publication Date: 2005-09-08
IBM CORP
View PDF7 Cites 26 Cited by
  • Summary
  • Abstract
  • Description
  • Claims
  • Application Information

AI Technical Summary

Benefits of technology

[0009] The present invention provides a method, apparatus, and computer program product for monitoring the performance of a system. The mechanism of the present invention provides an interface in the form of a graphical user interface (GUI) to communicate multiple layers of system performance data to an operator. An operator monitors this display of information and uses it to determine how to adjust the system to optimize system performance. This mechanism of the present invention provides immediate feedback to an operator by displaying a trail of metric points, wherein the metric points indicate the status of system performance over a period of time. In this manner, the display mechanism of the present invention immediately conveys to an operator whether the system is operating within predefined margins, the results of performance adjustments made to the system, as well as predictions or trends for the system. As a result, multiple layers of system performance information may be communicated to an operator in a quick and efficient manner.

Problems solved by technology

With the emergence of the Internet and with ever increasing competition in the marketplace, stand alone computers no longer provide the necessary services and capabilities users require.
However, as systems have continued to expand, their complexity has increased, making management of the networks difficult.

Method used


Image

  • Method for multidimensional visual correlation of systems management data displaying orchesteration action threshold
  • Method for multidimensional visual correlation of systems management data displaying orchesteration action threshold
  • Method for multidimensional visual correlation of systems management data displaying orchesteration action threshold

Examples


Embodiment Construction

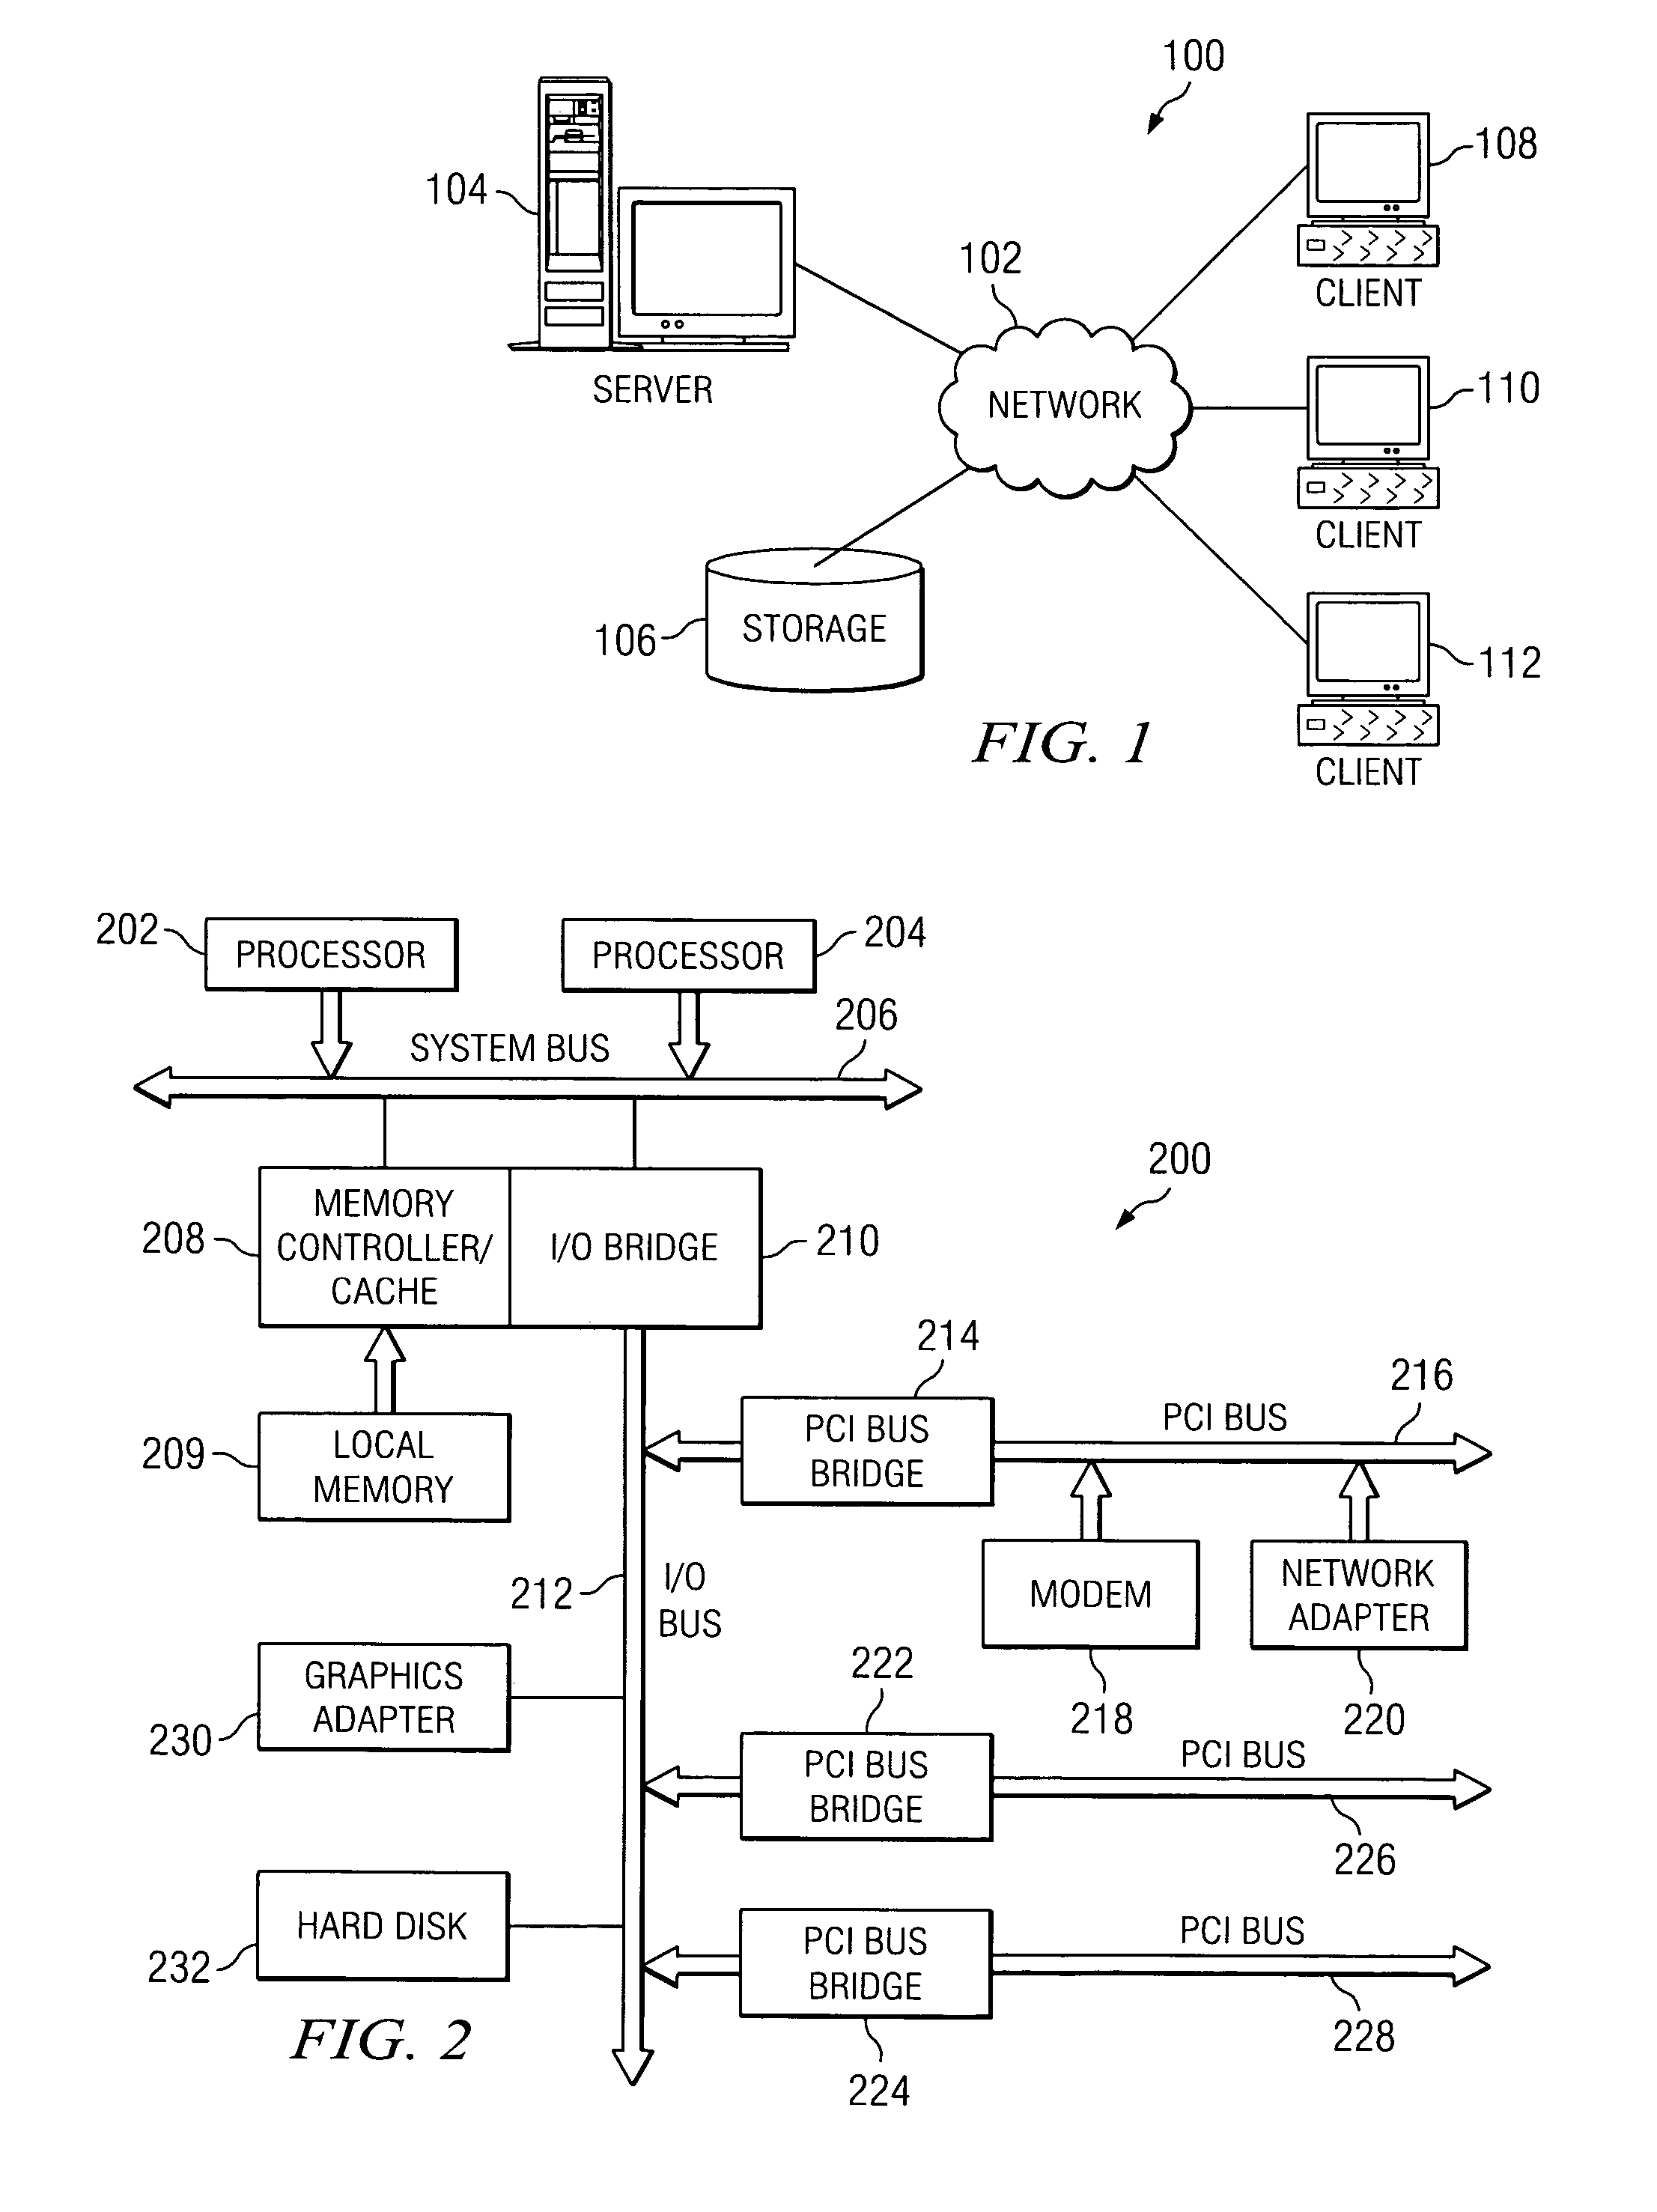
[0019] With reference now to the figures, FIG. 1 depicts a pictorial representation of a network of data processing systems in which the present invention may be implemented. Network data processing system 100 is a network of computers in which the present invention may be implemented. Network data processing system 100 contains a network 102, which is the medium used to provide communications links between various devices and computers connected together within network data processing system 100. Network 102 may include connections, such as wire, wireless communication links, or fiber optic cables.

[0020] In the depicted example, server 104 is connected to network 102 along with storage unit 106. In addition, clients 108, 110, and 112 are connected to network 102. These clients 108, 110, and 112 may be, for example, personal computers, transactional systems, or network computers. In the depicted example, server 104 provides data, such as boot files, operating system images, and app...


PUM


Abstract

A method, apparatus, and computer program product for monitoring the performance of a system. The mechanism of the present invention provides an interface in the form of a graphical user interface (GUI) to communicate multiple layers of system performance data to an operator. An operator monitors this display of information and uses it to determine how to adjust the system to optimize system performance. This mechanism of the present invention provides immediate feedback to an operator by displaying a trail of metric points, wherein the metric points indicate the status of system performance over a period of time. In this manner, the display mechanism of the present invention immediately conveys to an operator whether the system is operating within predefined margins, the results of performance adjustments made to the system, as well as predictions or trends for the system.

Description

CROSS REFERENCE TO RELATED APPLICATIONS [0001] The present invention is related to the following application entitled “Method for Multidimensional Visual Correlation of Systems Management Data”, Ser. No. ______, attorney docket no. AUS920030930US1, filed on ______. The above related application is assigned to the same assignee, and incorporated herein by reference. BACKGROUND OF THE INVENTION [0002] 1. Technical Field [0003] The present invention relates to computer and data processing systems, and, more particularly, to the field of network computing. Even more particularly, the present invention relates to monitoring system performance and communicating detailed system performance data via an enhanced graphical user interface. [0004] 2. Description of Related Art [0005] Computers have increasingly become a necessity of modern life, both for individuals as well as businesses. With the emergence of the Internet and with ever increasing competition in the marketplace, stand alone com...

Claims


Application Information

Patent Timeline
Patent Type & Authority Applications(United States)
IPC IPC(8): G06F3/00G06F9/00G06F15/173G06F17/00
CPCG06F11/324G06F2201/81G06F11/3466
Inventor CHILDRESS, RHONDA L.KUMHYR, DAVID BRUCEPENNELL, NEIL RAYMOND
Owner IBM CORP
Why Eureka
Try Eureka