Dose dependent elimination of HA and cell receptor stimulation
- Summary
- Abstract
- Description
- Claims
- Application Information
AI Technical Summary
Benefits of technology
Problems solved by technology
Method used
Image

Examples
example 1
Characterization of HA
[0079] Several HA preparations, from same source batches used in this study were analyzed for molecular weight polydispersity. Values for two HA samples re-constituted in PBS and heat sterilized are given in Table 1, along with the molecular weight of a sample not subjected to heat sterilization. All samples were polydisperse in molecular weight as is characteristic of HA, with an average molecular weight ranging from 276-289 kDa with heat sterilization, and 509-750 kDa without. Samples were also analyzed for protein contamination. As shown in Table 2, there was no significant protein present in these samples. One report has noted DNA contamination in several commercial samples of HA and further shown that DNA, and not HA, was responsible for the ability of samples to promote cytokine expression in monocytes in vitro (Lindqvist, U. et al Clin Pharmacokinet 41:603 (2002)). Therefore, the presence of DNA was also assayed for and as shown in Table 2, none was de...
example 2
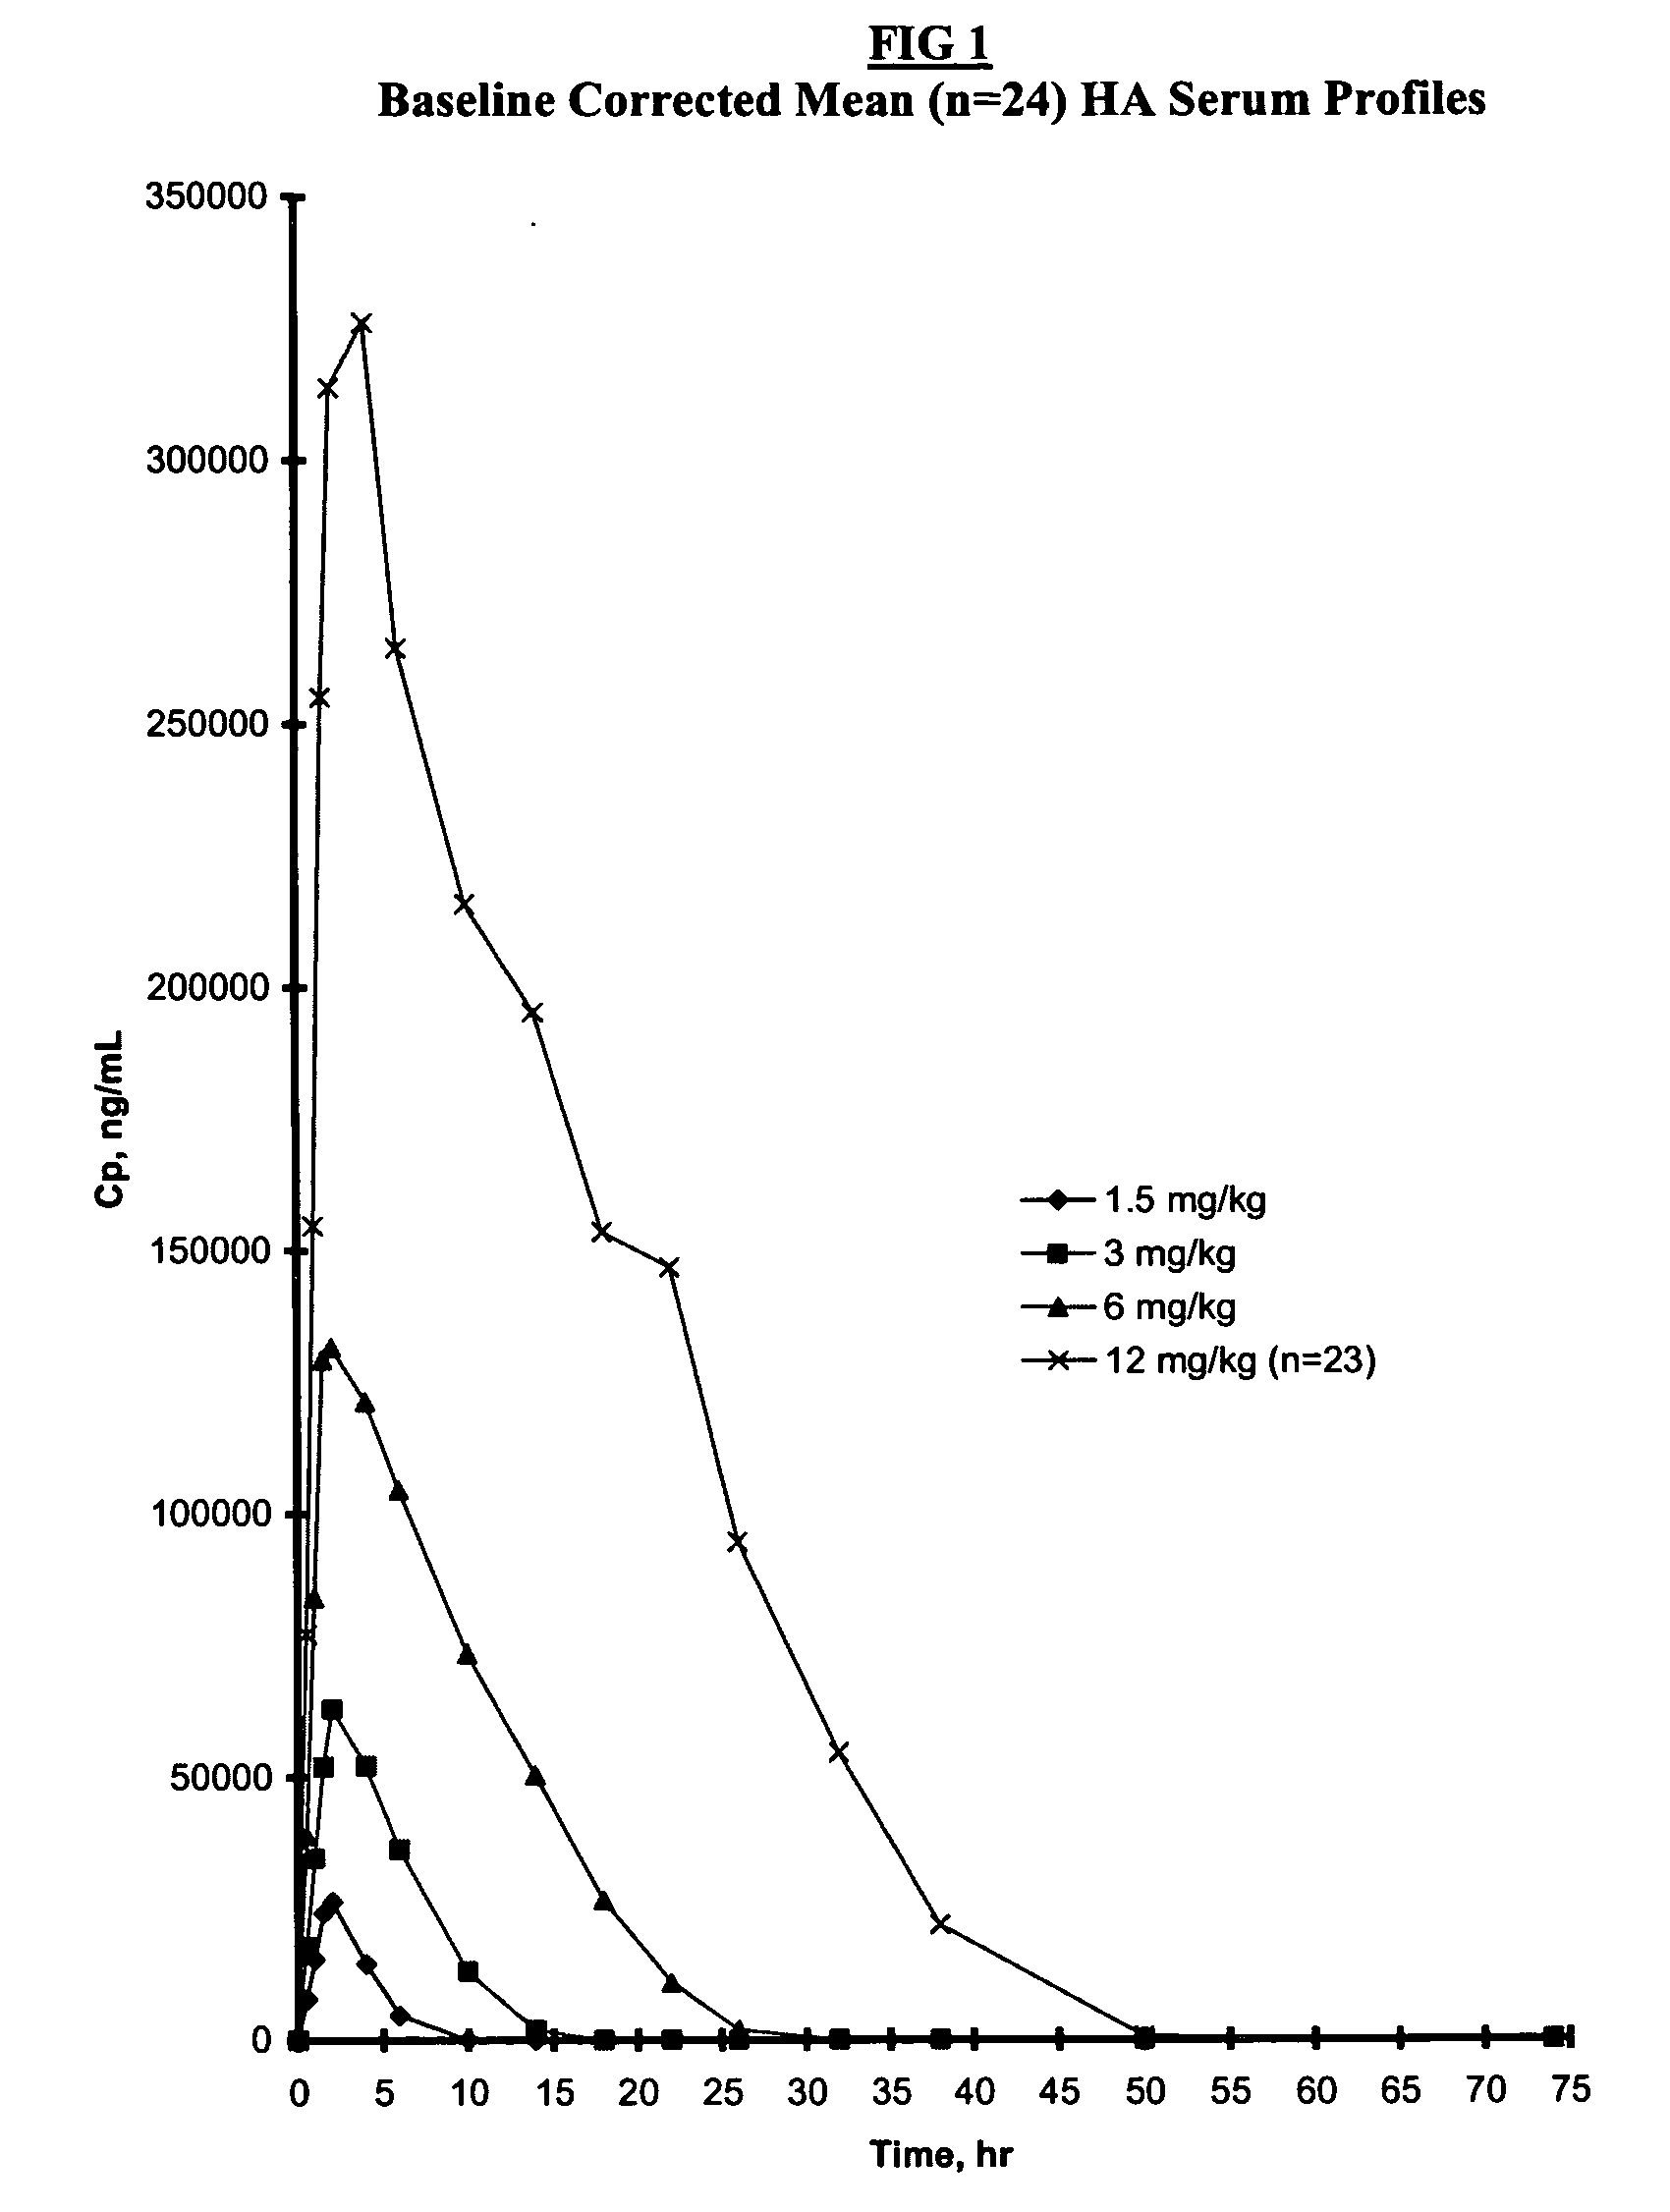
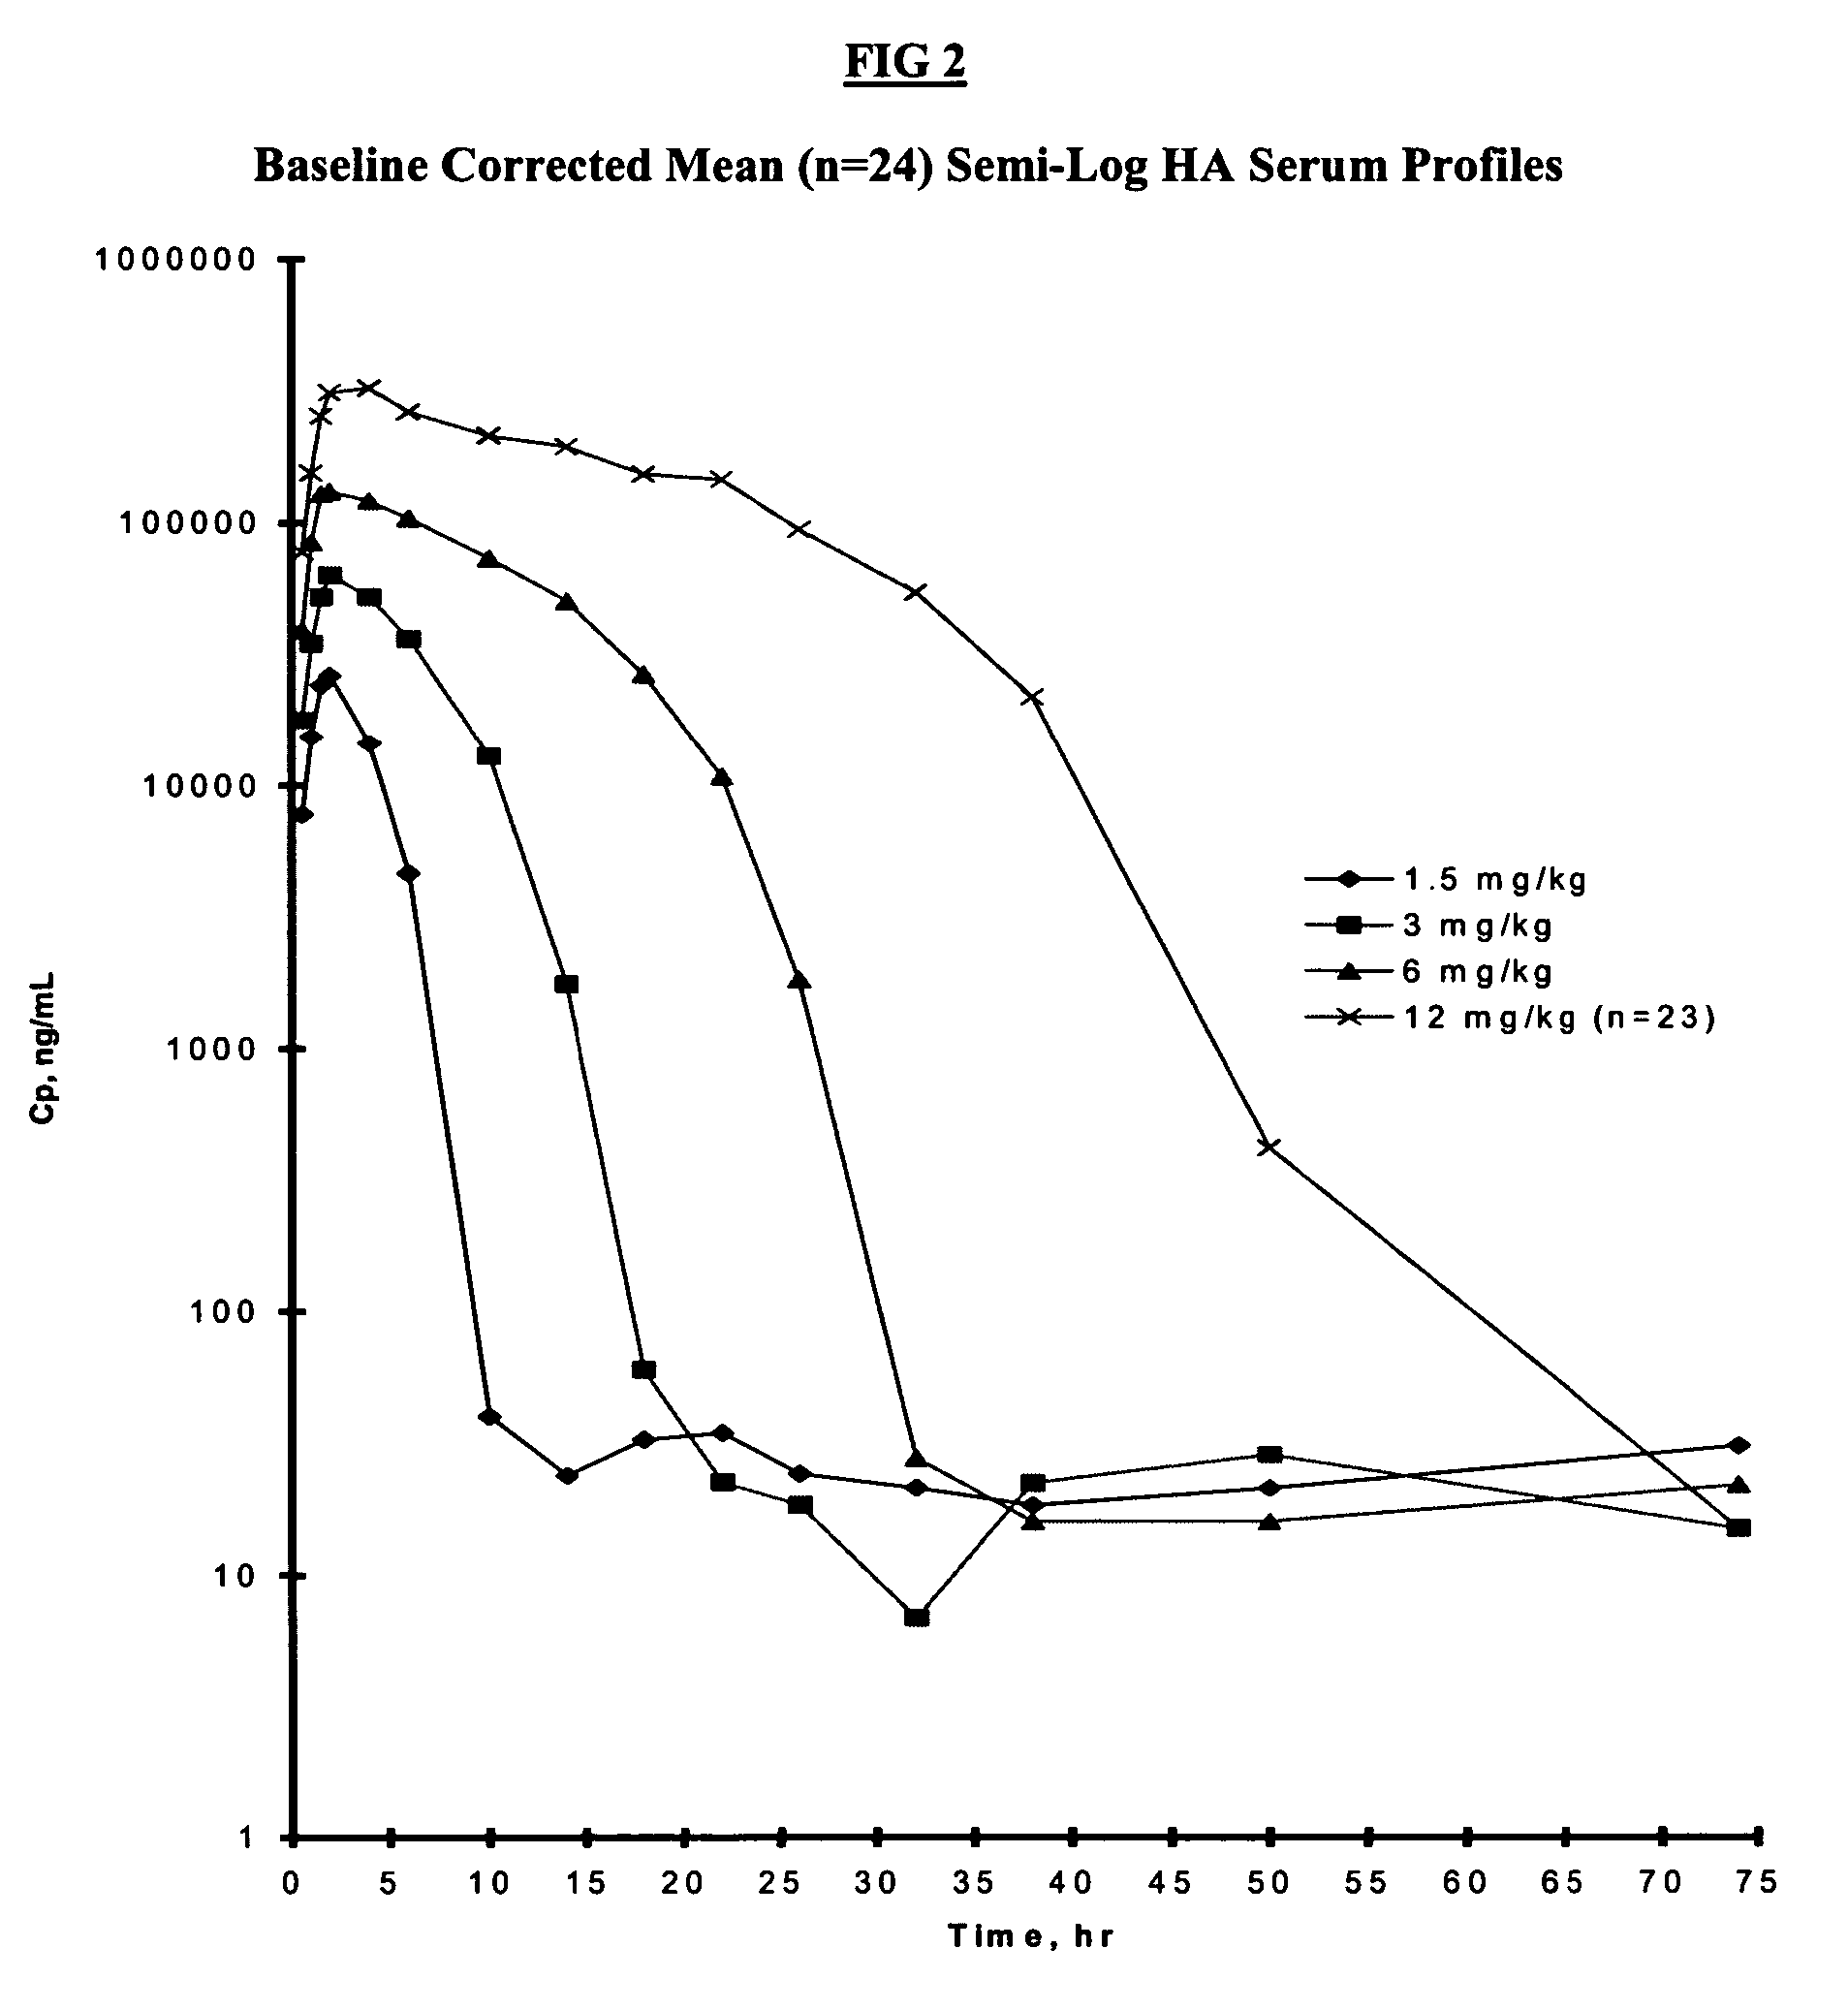
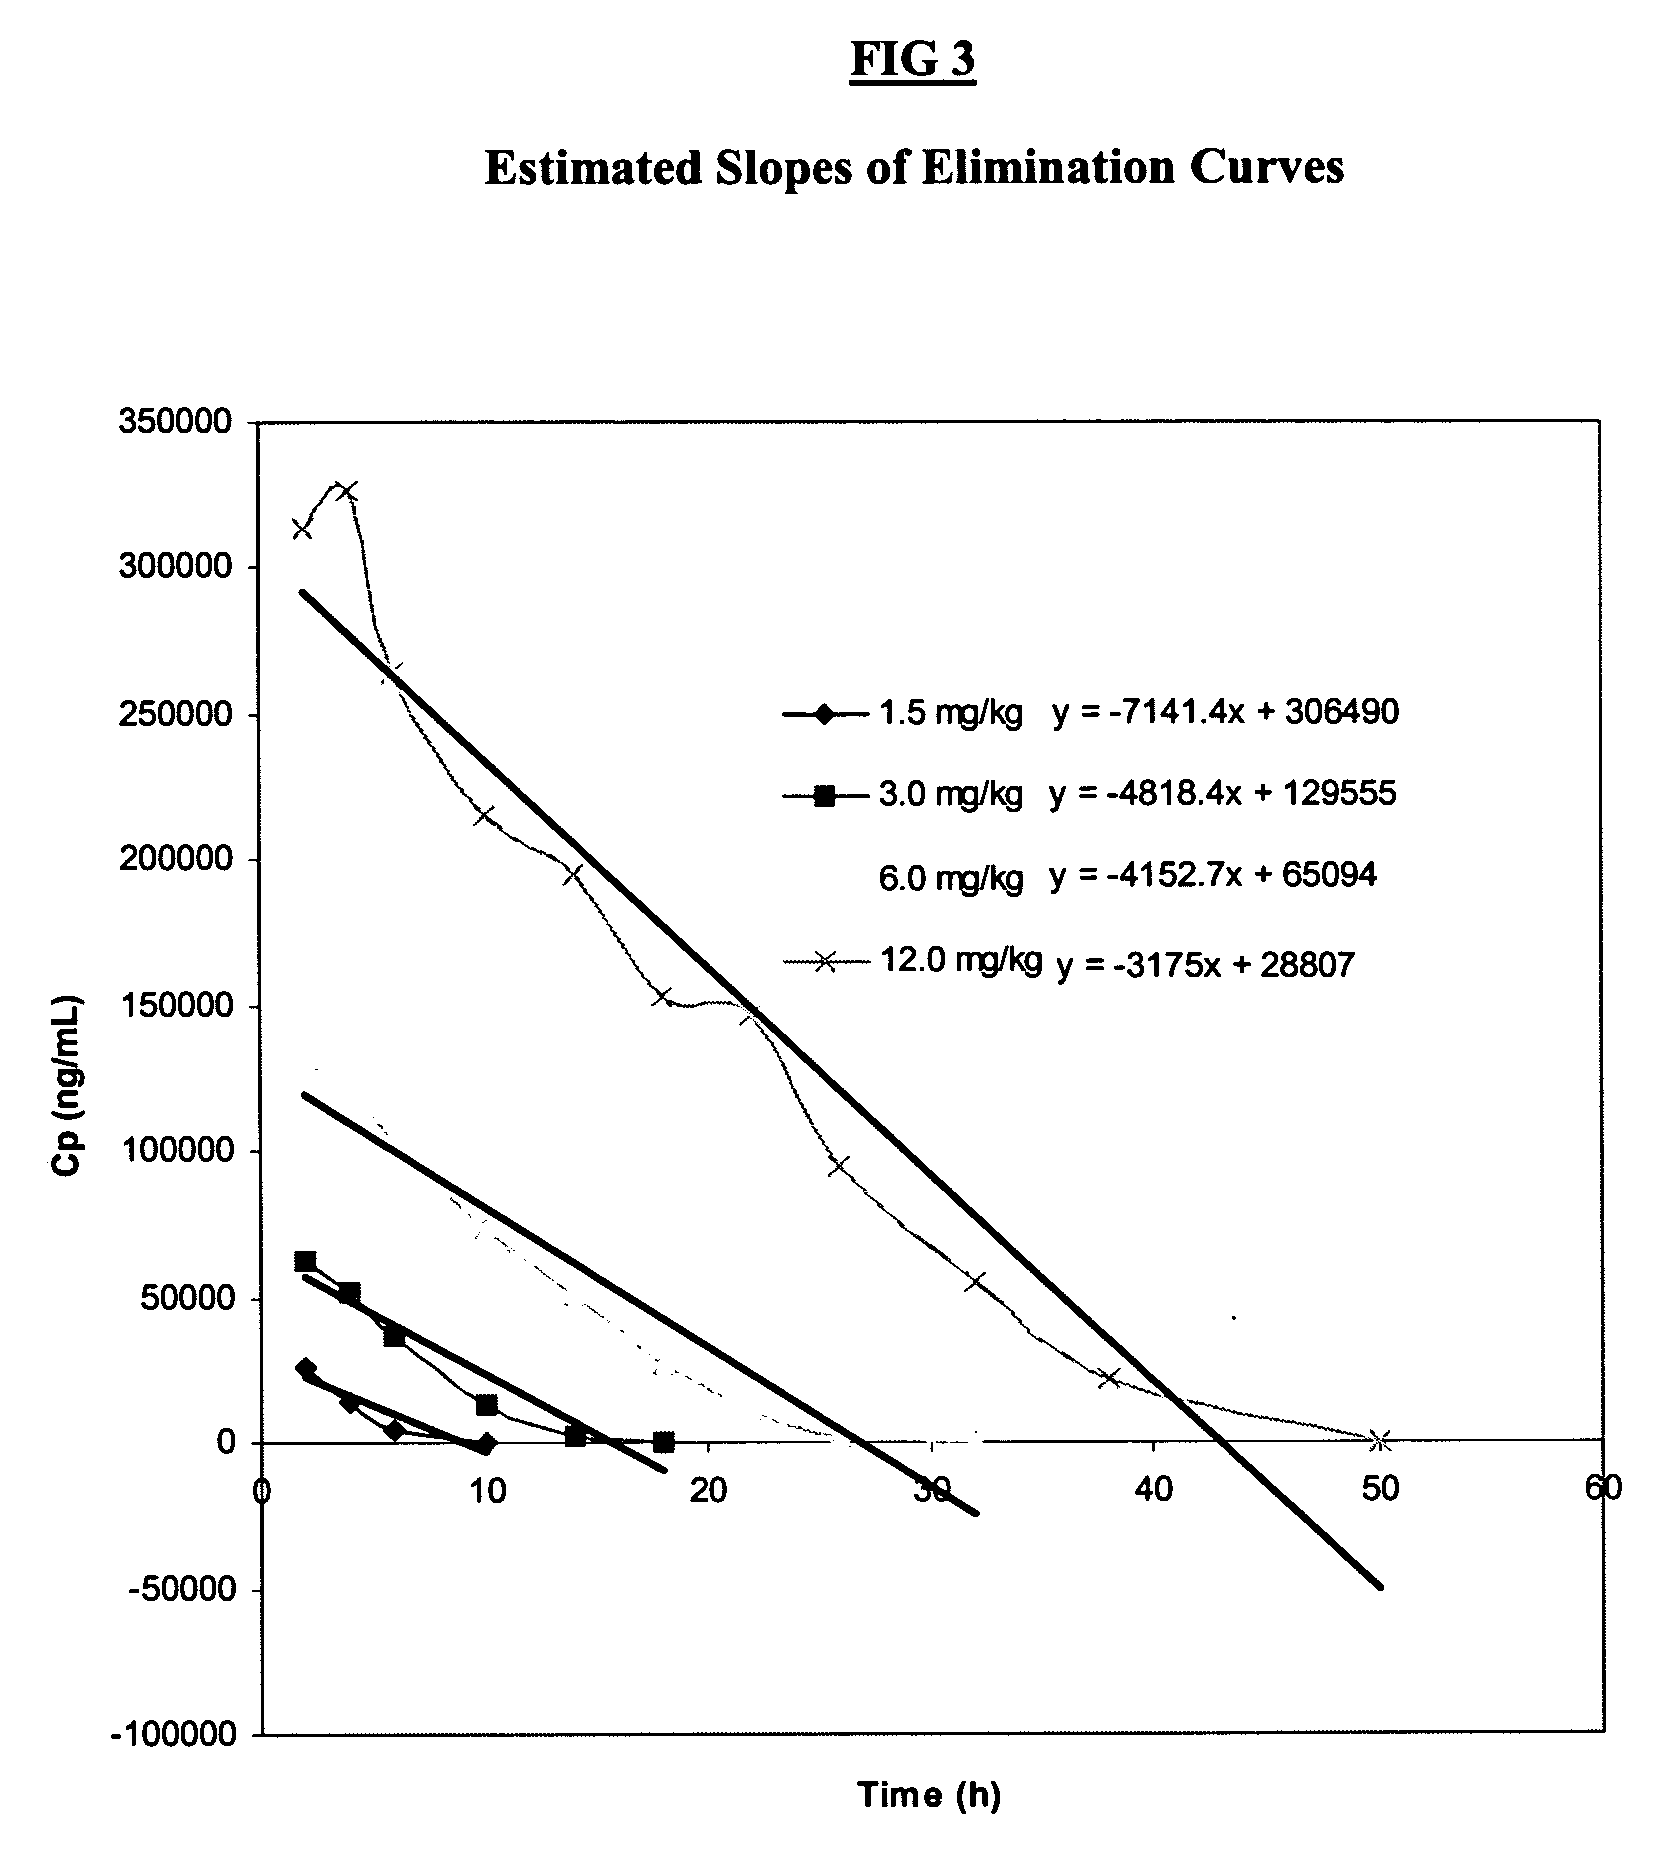
Kinetic Analysis of HA Elimination From Serum
[0082] The design of this study was based upon standard methods for obtaining an optimal dosing regime commonly used for bioactive drugs (Thompson, G. A. et al Drug Metab Rev 21:463 (1989)). An escalating dosing regime of HA, same source of which were analyzed in Example 1, was given over a period of 4 weeks with a weekly interval, judged from previous studies (Torsteinsdottir, I. T. et al Semin Arthritis Rheum 28:268 (1999)) to be long enough to allow elimination of serum HA prior to the next dose. Since the concentrations of HA administered IV in the present study were higher than those of previous reports using a bolus dose (Lindqvist, U. et al Clin Chim Acta 210:119 (1992)), this was judged to be a safer method of administration. The sampling period was also different as compared to previous studies. In the present study, samples were taken prior to HA administration, mid-infusion and at 11 time points between 2-72 hours (post-infus...
example 3
HA Binding to Blood Cells
[0089] The HA-binding capacity of T-cells (CD4+ and CD8+), B-cells (CD 19+) and PBMC (CD14+) were analyzed by multiparameter flow cytometry. The flow cytometric assay measures HA binding by individual PBMC, with intensity of green fluorescent staining indicating the extent of HA binding by each cell. HA binding by a given subset of cells is quantified as the number of orange mAb-stained PBMC that are also stained green through binding of HA-FITC to the cell surface. All cell types bound FITC-HA, with PBMC binding to a greater extent than B-cells, and T-cells (both CD4+ and CD8+) bound the least as shown in FIG. 4. Modulation of HA binding occurred for all cell types, but this was particularly obvious during the fourth dosing period as shown in FIG. 4A-D, and was most dramatic for PBMC and B-cells.
[0090] In the first dosing period there was a trend, but not statistically significant, (Student's “t” test) for all cell types to exhibit a transient increase i...
PUM
| Property | Measurement | Unit |
|---|---|---|
| Temperature | aaaaa | aaaaa |
| Time | aaaaa | aaaaa |
| Pressure | aaaaa | aaaaa |
Abstract
Description
Claims
Application Information
 - Generate Ideas
- Intellectual Property
- Life Sciences
- Materials
- Tech Scout
- Unparalleled Data Quality
- Higher Quality Content
- 60% Fewer Hallucinations
Browse by: Latest US Patents, China's latest patents, Technical Efficacy Thesaurus, Application Domain, Technology Topic, Popular Technical Reports.
© 2025 PatSnap. All rights reserved.Legal|Privacy policy|Modern Slavery Act Transparency Statement|Sitemap|About US| Contact US: help@patsnap.com