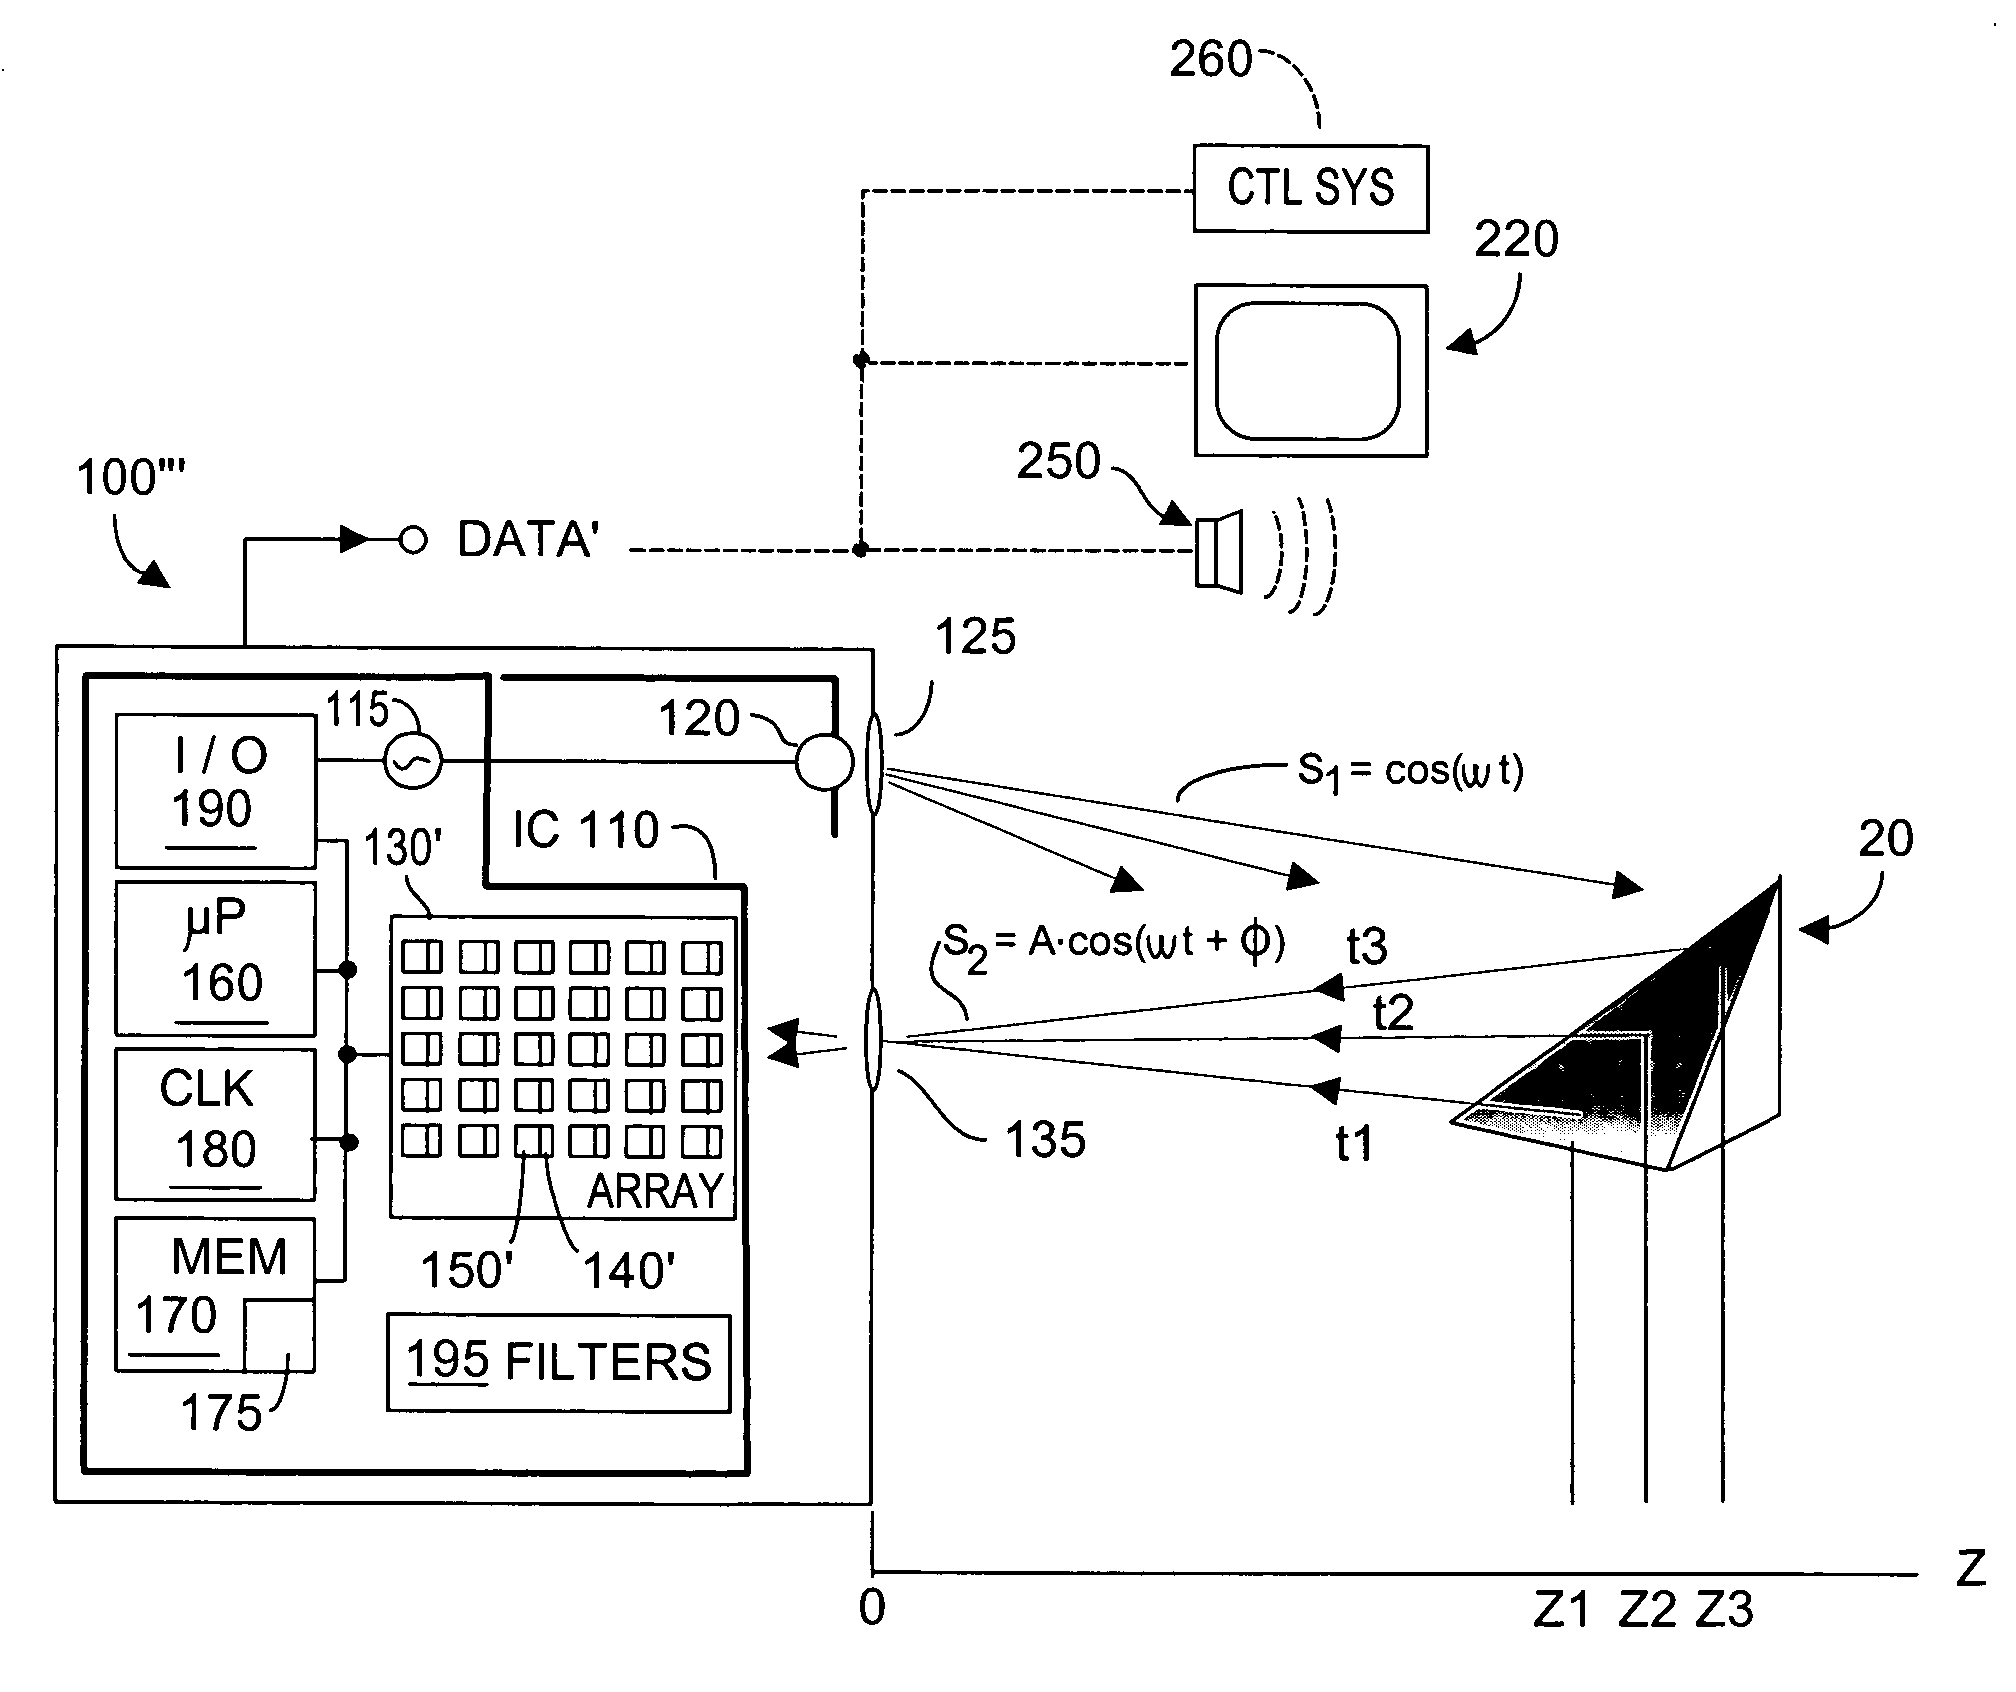
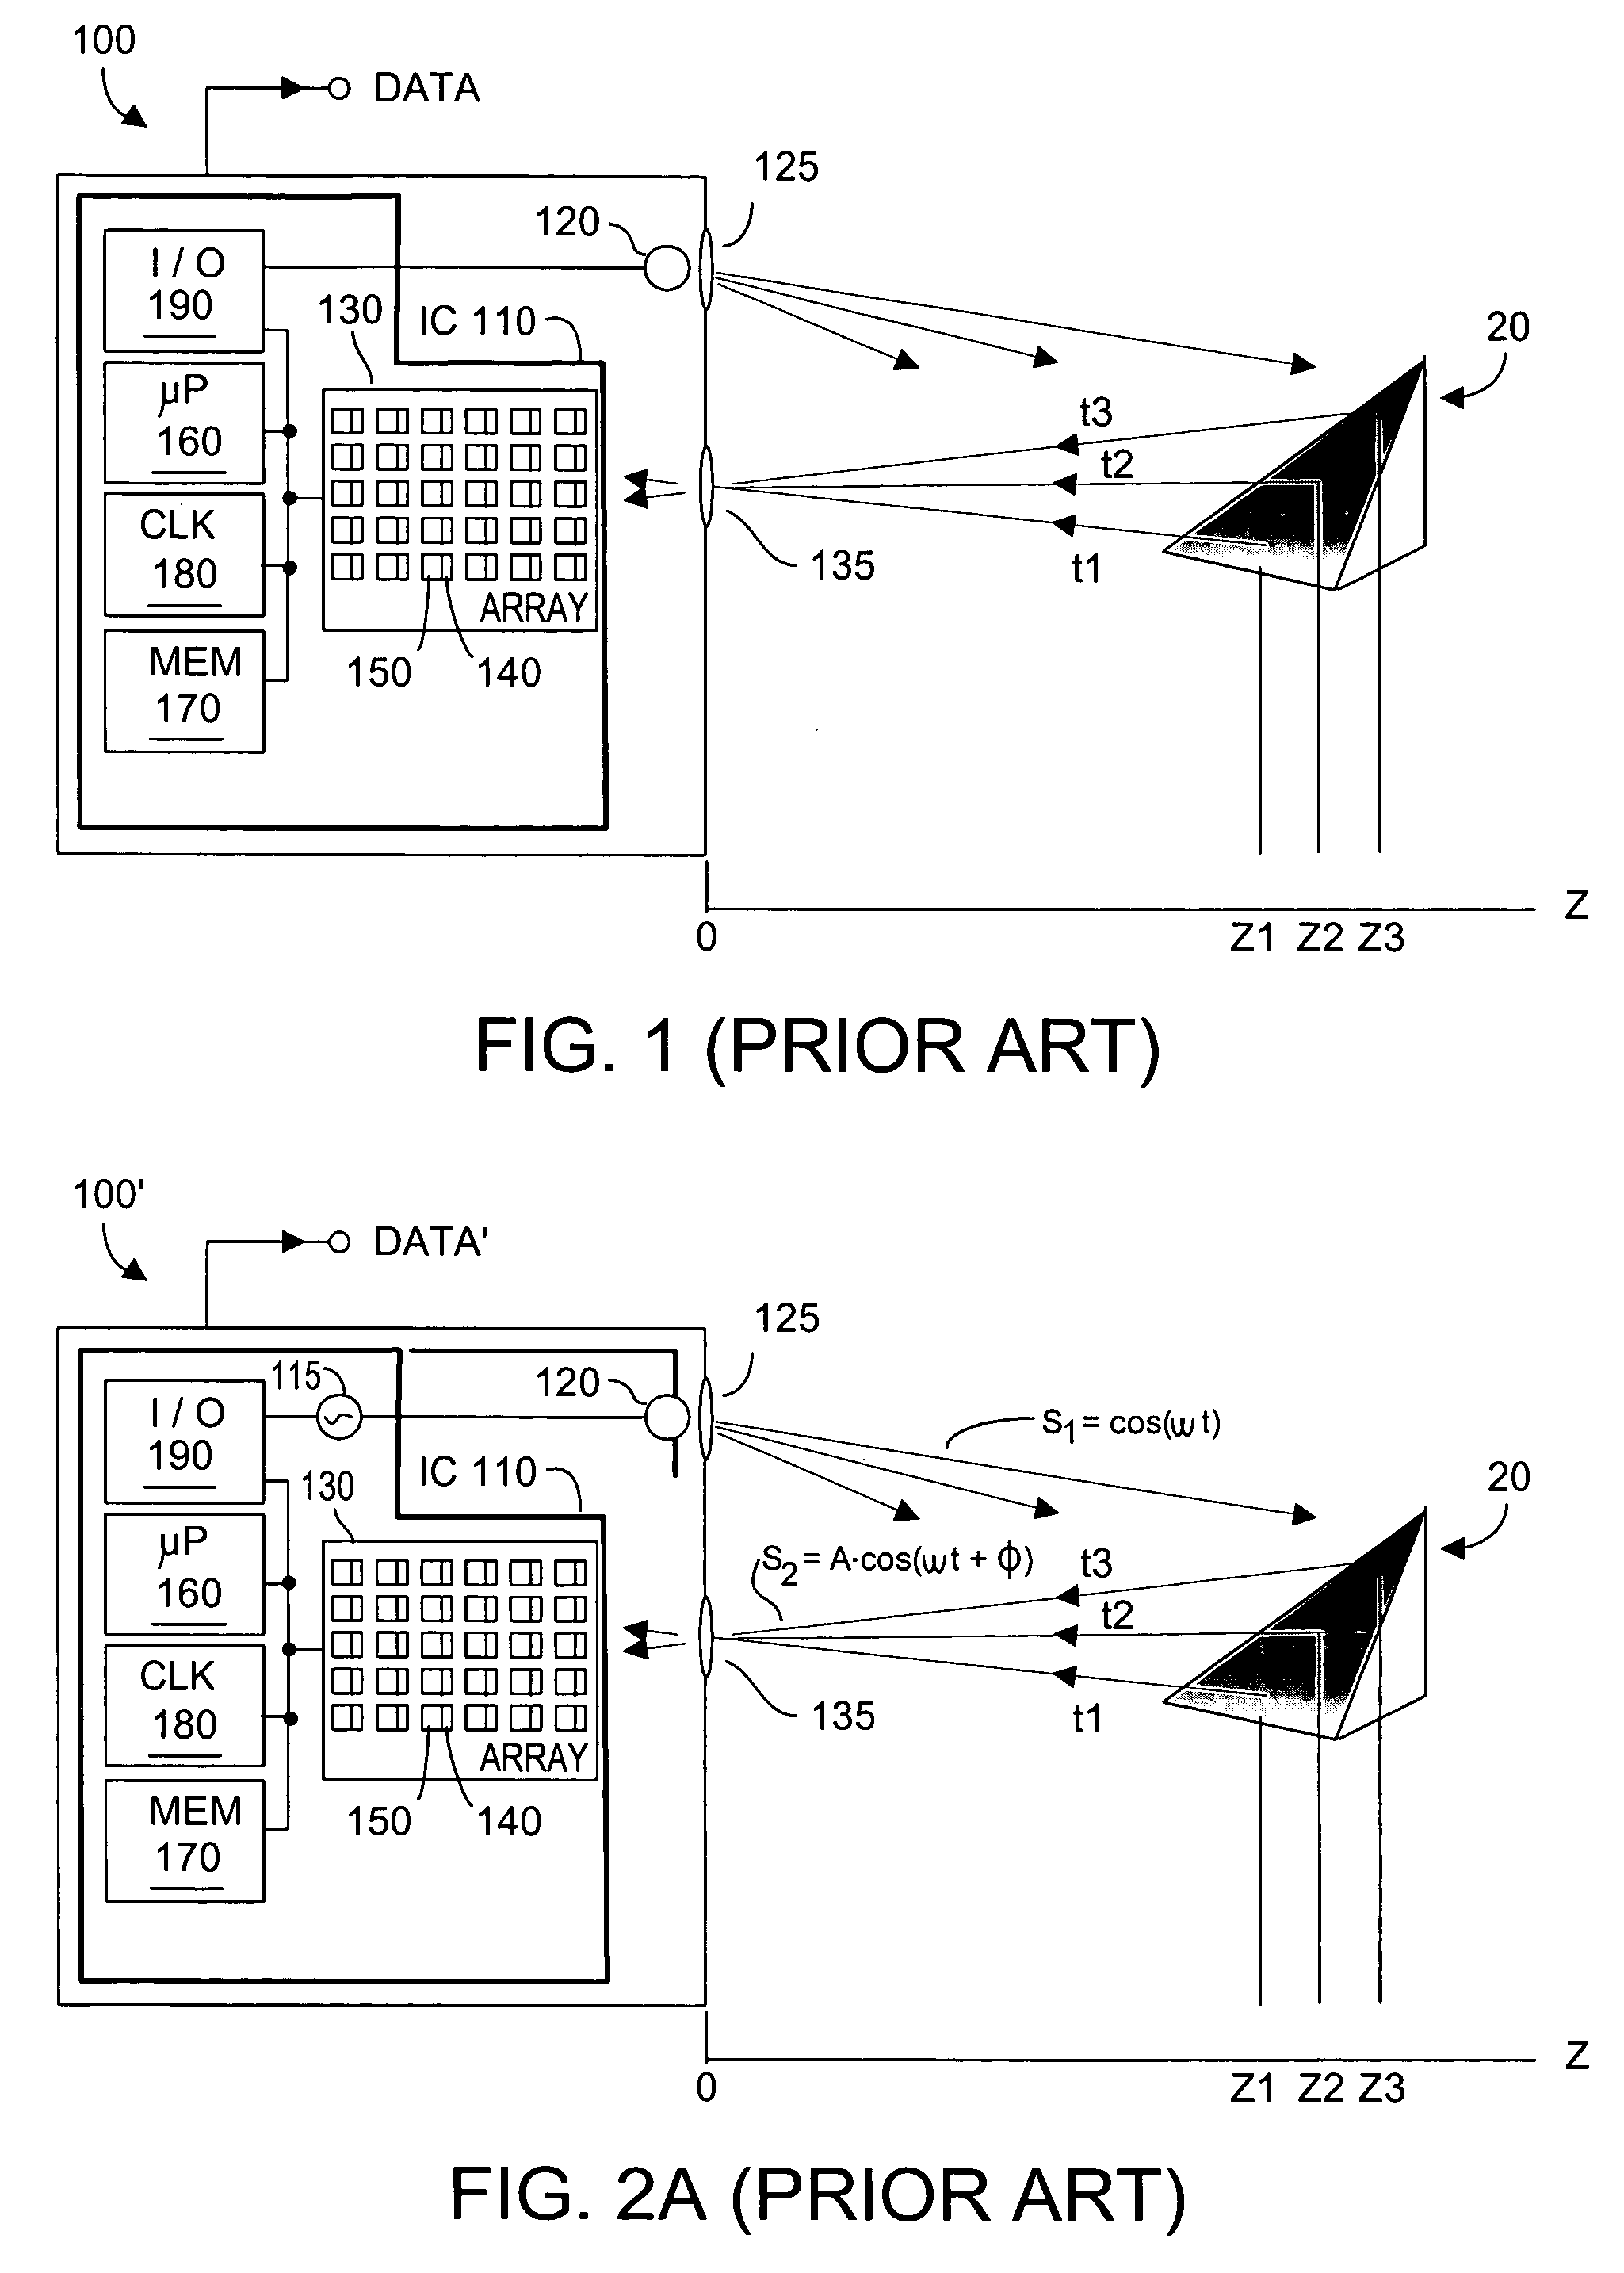
[0037]FIG. 4A depicts a phase-shift system 100′″ with software routine 175 and threshold filtering system 195, according to the present invention. Upon execution, software routine 175 caries out the present invention. Software routine 175 may be stored in a portion of memory 170 and may be executed by microprocessor unit 160. System 100′″ operates so as to quantify accuracy of the Z or depth data acquired by the three-dimensional sensor array 130′. Output from system 100′″ may be used to create a user-visible display 220 and/or to enable an acoustic warning device 250, and/or to command operation of external control systems 260. Unless otherwise stated, reference numerals in FIG. 4A may be understood to refer to elements identical to what has been described with respect to system 100″ in FIG. 2A. As such, it is understood that the various embodiments of system 100″ described below may be fabricated using CMOS technology upon a common integrated circuit substrate.
[0038] As noted, pixel photodetectors 140′ (sometimes referred to herein as pixels) in array 130′ are expected to output useful detection signals, regardless of whether magnitude of incoming optical energy is low (for example a distant and/or non-reflective target object 20), or extremely high, due perhaps to high ambient light, e.g., sunlight, or a highly reflective target object. Sufficiently high levels of ambient light can saturate pixel detectors 140′, whose output signal may be large in amplitude but will likely be erroneous. Typically data generated at these two extremes of very low optical energy and very high optical energy will be erroneous and will be termed low-confidence data.
[0039] But low confidence data are not identifiable from the three-dimensional depth information alone. Such information alone cannot determine whether a pixel detector has saturated, in which case the target object may erroneously appear to have moved to a new location, or whether indeed the target object truly moved. By contrast, according to the present invention, system 100′″ examines information already gathered by sensor array 140′ during a frame of captured data. System 100′″ uses this gathered information to quantify the depth data accuracy (e.g., Z-measurements). If system 100′″ determines that Z data presently being detected are low in confidence, this low confidence level can be identified to users of the system, for example via display 220 and/or acoustic device 250.
[0040] The present invention recognizes that there are two kinds of positional errors introduced by a time of flight system: accuracy and depth uncertainty.
[0041] Accuracy positional error is the difference between the real coordinates of the target object that receives and then reflects optical energy to a photodetector pixel, and a somewhat massively time averaged reading for that photodetector pixel. This positional accuracy error can be characterized as an RMS deviation between the photodetector pixel reading and the real coordinates for the target object portion being read. This quantity is typically specified for each photodetector pixel along each of the x-axis, y-axis, and z-axis. Accuracy positional error is generally a static quality that is independent of illumination although it may vary slightly with environmental ambient. Accuracy is usually a function of how well the system calibration has been performed for the pixel detector in question. Accuracy also depends on lens distortion and calibration for the pixel detector in question.
[0042] Uncertainty positional error is uncertainty in the z-depth. Uncertainty depends on the illumination received for the pixel detector in question, both from the laser light source and ambient light. This error is the time based RMS of the variation in the readings from a pixel that pixel. Depth uncertainty can typically be characterized by a single number for each pixel detector, that corresponds to the uncertainty principally along the radial axis for the pixel detector of interest, assuming that the light source and pixel detector are at the same location. The depth uncertainty value along the radial line can then be projected along each axis.
[0043] In one embodiment, confidence at each pixel detector is characterized as the combination, for example an RMS sum, of accuracy and uncertainty. As accuracy is somewhat of a static quality, embodiments of the present invention are generally directed to how to obtain the radial uncertainty at a particular pixel detector as a function of illumination.
[0044] When operating in a correct pixel detector operating dynamic range, e.g., the pixel detector is received neither too much nor too little light to be detected, uncertainty may be modeled as:
Uncertainty=(Constant_scaling_factor)·(signal/noise
[0045] With pixel detector array 130; the signal for a particular pixel detector 140 at a particular frame of acquired data may be assumed to be the laser brightness also called active brightness for that pixel and frame, where optical energy source 120 is the source of such brightness:
Signal=Active_Brightness=√{square root over ((Δ0°−Δ180°)2+(Δ90°−Δ270°)2)}
[0046] where 0°, 180°, 90°, 270° refer to phase-shifts at which the data are acquired by the pixel detector 140′ of interest.
[0047] Noise comes from many sources including shot noise, quantization noise associated with analog-to-digital conversion (A/D), which noise contribution is a fixed quantity dependent upon the A/D converters, and analog noise in IC chip 110, comprising thermal noise, and flicker noise, among other contributors.
[0048] Shot noise is noise from total illumination, e.g., illumination from active source 120 plus ambient optical energy as measured by the TOF pixel detector of interest. Shot noise may be modeled as:
shot noise=√{square root over (activelight+ambientlight)}
[0049] Total noise can then be modeled as the RMS sum of the noise components as follows:
total noise=√{square root over ((shot noise)2+(A/D quantization noise)2+(ana log noise)2+ . . . )}
[0050] Again it is assumed in the above that the pixel detector(s) of interest are operating within their dynamic range in terms of levels of active and ambient light falling upon the detector(s). Thus, system 100′″ will first confirm that the pixel detector(s) of interest are not receiving inadequate or excessive levels of optical energy. For purposes of the present invention, such confirmation can simply ensure that both active brightness and ambient light levels are below a certain maximum threshold level for each quantity. If active brightness and ambient light levels are determined not to be within reasonable bounds, an embodiment of the present invention will assume the signal/noise ratio is zero. A signal/noise ratio of zero corresponds to a confidence level of 0 for the data.
[0051] Determination of confidence levels can also take into account motion-related considerations. For example, the level of confidence may be decremented if ambient light or object motion is detected at a given pixel detector.
[0052]FIG. 4B is an exemplary flow chart showing method steps implementing an exemplary embodiment of the present invention. With reference to FIG. 4A, it is understood that these method steps represent operations carried out by software routine 175 upon execution, for example by microprocessor 160, or other processor unit. Threshold filters 195 may in fact be implemented in software, although hardware could also or instead be used.
[0053] Referring to FIGS. 4A and 4B, at method step 300 system 100′″ acquires data over a time frame, perhaps 10 ms in duration, which data includes both active brightness data and total brightness data. Phase measurement information obtained from photodetectors 140′ will include Z depth information as well as information as to the brightness or amplitude of the detected optical energy.
[0054] As used herein, “total brightness” refers to the brightness or amplitude of signals detected by photodetectors 140′ responsive to the total optical energy falling upon array 130′, e.g., optical energy components comprising both ambient light and the desired optical energy reflected by target object 20 some distance Z away due to optical energy emitted by source 120. The term “active brightness” refers to the brightness or amplitude of detected signals responsive solely to optical energy reflected by target object 20 due to optical energy emitted by source 120. Under control of microprocessor 160, system 100′″ can obtain a measure of ambient light only by detecting incoming optical energy at a time when source 120 has not emitted detectable optical energy. Such “ambient only” response can be subtracted by system 100′″ from the “total brightness” response to yield the “active brightness” response. Method step 300 represents the gathering of the active brightness data and the total brightness data by system 100′″. It will be appreciated that total brightness data and active brightness data are each simultaneously available from photodetectors 140′.
[0055] In an off-line run, perhaps conducted when system 100′″ is manufactured, each photodetector 140′ is subjected to very low levels of optical energy to determine a minimum detectable signal level, under total brightness (“TB”) and under active brightness (“AB”) conditions. Each photodetector 140′ is also subjected to very high levels of optical energy to determine a saturation detection signal level, again under TB and AB conditions. These AB data and TB data are gathered and stored, for example in memory 170 for each photodetector 140′. The stored such AB data and TB data are shown in method steps 310 and 320.
[0056] Shown as method step 330 is one or more brightness-based threshold filters 195. Filter(s) 195 may be implemented in software and/or hardware, and serve to compare known upper and lower values of AB and DB data from steps 310, 320 with AB data and TB data now being generated by photodetectors 140′. Filter(s) 195 serve to identify which, if any, photodetectors 140′ are at this moment operating either at too low or too high a level of incoming optical energy to output Z depth information that can be relied upon with confidence.
[0057] For example, suppose that output from each photodetector is quantized to one of say 255 levels. Perhaps output levels 0 through 10 could be defined as representing extremely low levels of optical energy, to low to be confidently relied upon. On the other hand, photodetector output levels 245 through 255 could represent high levels of optical energy that saturate the photodetector such that its output cannot confidently be relied upon.
[0058] At method step 330, brightness-based threshold filter(s) 195 carry out the above comparisons, preferably on a per photodetector basis. At method step 340, photodetectors 140′ whose output signals fall within questionable regions indicating too low or too high levels of incoming optical energy to be reliably detected may be masked out for the current frame of acquired Z depth data.
[0059] At method step 350, the remaining photodetectors (e.g., those whose present output levels are believed to be good and associated with input optical energy levels in a confidently detectable range) may have their presumably good Z depth data characterized as a function of parameters of interest, for example brightness. This process yields what may be deemed a two-dimensional confidence map, as indicated by method step 360, which map may be stored in memory 170.
[0060] As regards the confidence map, if the total range of brightness levels is quantized to one of 255 levels, non-masked photodetectors whose outputs are mid-range, perhaps 113 to 133, may be characterized as being highest confidence data, whereas non-masked photodetectors whose outputs lie closer to the presumed boundaries of good data, perhaps 11-20, and 235-245, could be characterized as being less confident data, and so forth. Detected Z depth values output by individual photodetectors may then be associated with the current confidence level for that photodetector for the current frame of acquired data. Thus, unacceptably out-of-range Z depth data may be masked out as being without sufficient confidence for use. Z depth data that is believed to be of highest confidence may be so marked, Z depth date of intermediate confidence may be so marked, and so on.
[0061] By way of example, assume that the functional relationship (f) between accuracy and brightness is given by:
accuracy (brightness)=f(brightness)
[0062] The assigned confidence (or depth accuracy) measure for each photodetector will be a function (g) of the accuracy function:
confidence(brightness)=g((accuracy(brightness)).
[0063] Following execution of method step 360, confidence map information may be communicated to an end user of system 100′″ in a number of ways. Compare for example prior art system 100′ (FIG. 3A) and its use of output data (FIG. 3B) with system 100′″ (FIG. 5A) and its use of output data according to the present invention (FIG. 5B). In prior art system 100′, acquired Z depth data was used but without alerting the end-user to potential problems with the data. For example the data may have been generated under system conditions not conducive to high confidence in the data, e.g., perhaps incoming optical energy levels were too low or too high to be relied upon, and/or system operating potential may have been out of specification such that resultant data was not reliable, etc. Note in FIGS. 5A and 5B that in a vehicle imaging application, knowledge that currently generated data is high confidence may be used to permit system 100′″ to automatically command control system 260. For example, control system 260 may be the braking system in a vehicle 250 that is presently moving towards collision with an object 30, whose presence is confidently detected by system 100′″ as comprising a threat. Alternatively control system 260 might be the vehicle's warning horn, warning lights, perhaps even a steering wheel override in a truly emergency scenario. Such automatic control would be essentially unthinkable with a prior art TOF system 100 for which there was no known level of confidence in the Z depth information currently being generated.
[0064] But in FIG. 5A, system 100′″ (which is shown mounted on the rear of vehicle 250 for ease of understanding) includes confidence mapping according to the present invention. If an output from system 100′″ includes a user-viewable display 230, representations on the display associated with low confidence data may be so indicated, for example with indicia such as question mark(s), and/or graying-out of questionable regions of the image, and/or displaying questionable regions in a different color, and/or flashing questionable regions on and off, etc. In certain critical applications, perhaps robotic applications, it may be desired to indicate very high confidence data as well, perhaps with a contour map surrounding the regions of high confidence. Output from system 100′″ may comprise or include transducer 250 generated user-audible signals 260, perhaps an enunciated message that literally states “alert, alert, low confidence data is being generated right now”. Alternatively a user-audible signal might include a warning tone known to indicate low confidence data is currently being generated. It is understood that system 100′″ may indicate when low (or very high) confidence data is being used in other and additional ways, and that what is suggested by FIG. 5B is meant to be exemplary.
[0065] It will be appreciated that the above-described procedure is preferably calculated on-the-fly and can dynamically improve use of the Z depth data generated from output from the various photodetectors 140′. Note too that other environmental parameters may also be represented by threshold filtering, as indicated by optional method step 315′. For example, as ambient temperature changes, individual photodetectors within array 130′ may vary in their ability to output detection signals. A priori low and high temperature value output signals for each photodetector may be obtained offline and stored. If during actual operation of system 100′″ it is noted that ambient temperature is currently at a level known to affect photodetector outputs, those outputs from photodetectors known to be susceptible to the current temperature regime may have their Z depth outputs masked or marked as being unacceptably low in confidence value for use, or useable but with somewhat questionable confidence, and so forth. Note too that system parameters other than temperature could also, or instead, be used, e.g., system power supply level, system altitude, system atmospheric pressure, system humidity, etc. Regardless of the parameter(s) used, the present invention permits recalculating confidence and accuracy functions on-the-fly so as to dynamically fine-tune system 100′″ to the task at hand. In some applications it may suffice to have little or no indication of low confidence data, while in other applications, dynamically fine-tuning system 100′″ may be required.
[0066] Modifications and variations may be made to the disclosed embodiments without departing from the subject and spirit of the invention as defined by the following claims.