System and method for analyzing and displaying security trade transactions

a technology of securities and transactions, applied in the field of systems and methods for analyzing and displaying securities transactions, can solve the problems of not providing sufficient detail about the transactions, transaction reports experienced significant delays, and information reported was typically quite limited, so as to speed up the interpretation of market activity, increase the probability of making a profit from buying low, and quickly decide

Active Publication Date: 2006-11-23
TRADING TECH INT INC
View PDF12 Cites 90 Cited by
  • Summary
  • Abstract
  • Description
  • Claims
  • Application Information

AI Technical Summary

Benefits of technology

[0028] It is therefore an object of the present invention to provide an arrangement for analyzing and displaying security trade transactions that avoids the aforementioned disadvantages of prior-art systems.
[0032] The administrative and risk management workstation controls access to the display and order entry systems, and allows administrative personnel to monitor activity for transactions of interest, including those that may indicate that a trader is engaging in activity which the system operator may consider to carry excessive risk.
[0035] According to a further aspect of the invention, the TICKFLOW chart may also display “market depth” information regarding pending bids and offers for the security including the number of units and price at which such bids and offers are extended. Preferably, the market depth information is integrated with the price axis of the chart on the display screen and includes a list book of bid / ask orders, known as the book or depth-of-market (DOM) for a security, showing the quantity ordered at each bid / ask price level. By integrating a live DOM allowing a trader to enter orders by clicking on displayed DOM prices along side the security price chart, a trader can see and act upon all relevant pricing data at once without looking at different parts of a display to see the data or place orders in separate windows, as is the case in prior-art art systems. This is a significant improvement over prior-art systems because it allows traders to speed-up their interpretation of market activity, thereby allowing a trader to more quickly decide on appropriate trade order actions to take, and hopefully allows a trader to be the first to place a trade order before competing market participants also recognize and take advantage of the same trading opportunity.
[0036] By reviewing the chart, traders may determine if trading is composed more by buyers or by sellers, if orders placed by buyers or sellers are larger or smaller, and if the book of bid / ask orders is changing based on buying or selling activity. A trader can conclude that trading is directionally biased into an upward or downward trend based on orders originating from buyers or sellers and increase the probability of making a profit from buying low and selling high.
[0037] According to a further aspect of the invention, a user interface allows a trader to quickly enter limit orders to buy or sell a predetermined quantity of a security by scrolling with a computer pointing device, such as a mouse or track ball, over the depth-of-market bid / ask order listing and clicking or selecting the desired price with the computer pointing device buttons. Generally, a computer mouse is set-up such that one button enters a buy order and the second button enters a sell order. Additional buttons may be assigned related functions, such as canceling limit orders not yet filled by an exchange, so that a trader can quickly re-enter an order with a new limit order price. If the chart is used to display contract prices for future delivery, as may be the case for commodity, energy, financial index, foreign currency and equity futures contracts, the chart may preferably also include plot points for the traded prices and bid / ask prices for the underlying cash market.
[0040] According to a further aspect of the invention, if a facility to determine auction events is provided, an auction summary chart may be provided to display auctions for a selected security. The auction summary chart uses a bar chart format where every bar marker indicates the price range of each auction event, and the dot on an auction bar marker indicates the volume weighted average price (VWAP), modal price, or other derived characteristic determined for each auction. Once each auction event ends, a filter processes statistics derived from the auction event and a score, called a Trend Status Value (TSV) score is calculated and assigned to the auction and noted above the box drawn over the auction bar. A positive score tends to indicate support for increasing price, and a negative score tends to indicate support for decreasing price. Auction events and their TSV scores are analyzed to detect trends or “auction sets”, which are delimited by a reversal in the TSV score. A box is drawn around the auctions belonging to a particular auction set to identify them. The TSV scores are also graphically displayed as small bars at the top of the auction summary chart marker maling it easy for traders to detect the strength, direction and reversal of price change trends.

Problems solved by technology

However, the information reported was typically quite limited, and might include, for example, the symbol, price and quantity of a security transaction.
In addition, these systems generally employed manual processes and relatively slow information transmission media, such that when markets were busy, transaction reports experienced significant delays, and some transactions were not reported.
However, even these later systems have proven inadequate in that they do not provide sufficient detail about the transactions and the market, or fail to usefully present such detail, to enable a trader to understand individual transactions and the trends that streams of such transactions represent, and therefore make rapid, profit-maximizing trading decisions.
Investors may choose a shorter or longer period of time to own a security, with longer investment periods generally exposing an investor to more risks due to unknown or unforeseen changes in circumstances, including the underlying bases for valuation of an investment.
However, this table arrangement does not show a history of individual transactions in a particular security, and does not represent the transactions in the form of a two-dimensional chart or graph.
However, these systems do not lend themselves to rapid determination of market conditions, because they do not indicate individual transactions, or they do not allow easy, unequivocal determination of order initiation a critical determining factor in price trend detection as defined and shown subsequently hereto.
Point-and-figure charting is unsatisfactory for several reasons: not all transactions are displayed because only transactions that meet filter criteria based on the amount of a price increase or decrease between successive transactions are plotted; there is no indication of trading volume; and buyer / seller order initiation is not indicated.
General market statistics are mentioned here in passing because they are frequently cited when describing markets, however such market statistics do not provide detailed information regarding individual transactions occurring in a market.
It is further hampered by the attempt to use a periodic sampling process as an input database to their calculative output in an attempt to describe the non-periodic, even chaotic, market trading process.
This too is a dubious assumption as any market activity is observed and responded to by various participants, with various motives, over and over again, resulting in a completely random and chaotic system.
Current methods of fixed or periodic data sampling are further limited to the question of “at what specific prices did the market trade during the given interval?” This same question is further limited by the prior art data sampling approaches as the samples are customarily for only the highest / lowest / first / last prices traded during the interval, leaving all other activity unexposed and unavailable for analysis.
Both activities cause security prices to rise and fall accordingly.
The failure of the prior art of technical analysis to recognize and display for each trade how orders are initiated, and to integrate an indication of the size of said orders, is a significant disadvantage.
However, the depth of market information in both of these systems is not integrated with graphical information displaying transaction activity.
The approach of using filled circles is not satisfactory because it depends on the color coding alone to convey the indication of buyers and sellers, which is not effective when printed in black and white, as with most laser printers, or when shown on monochrome display screens, because the colored circles all appear the same, as seen in the black and white specimen shown in FIG. 6.
In addition, the lack of integration in the display of transaction price, order initiation, and transaction size undesirably requires the trader to perform that integration as a manual process.
Further, the Investor / RT system does not directly display depth-of-market information or other indicia of pending orders on the transaction display.

Method used


Image

  • System and method for analyzing and displaying security trade transactions
  • System and method for analyzing and displaying security trade transactions
  • System and method for analyzing and displaying security trade transactions

Examples


Embodiment Construction

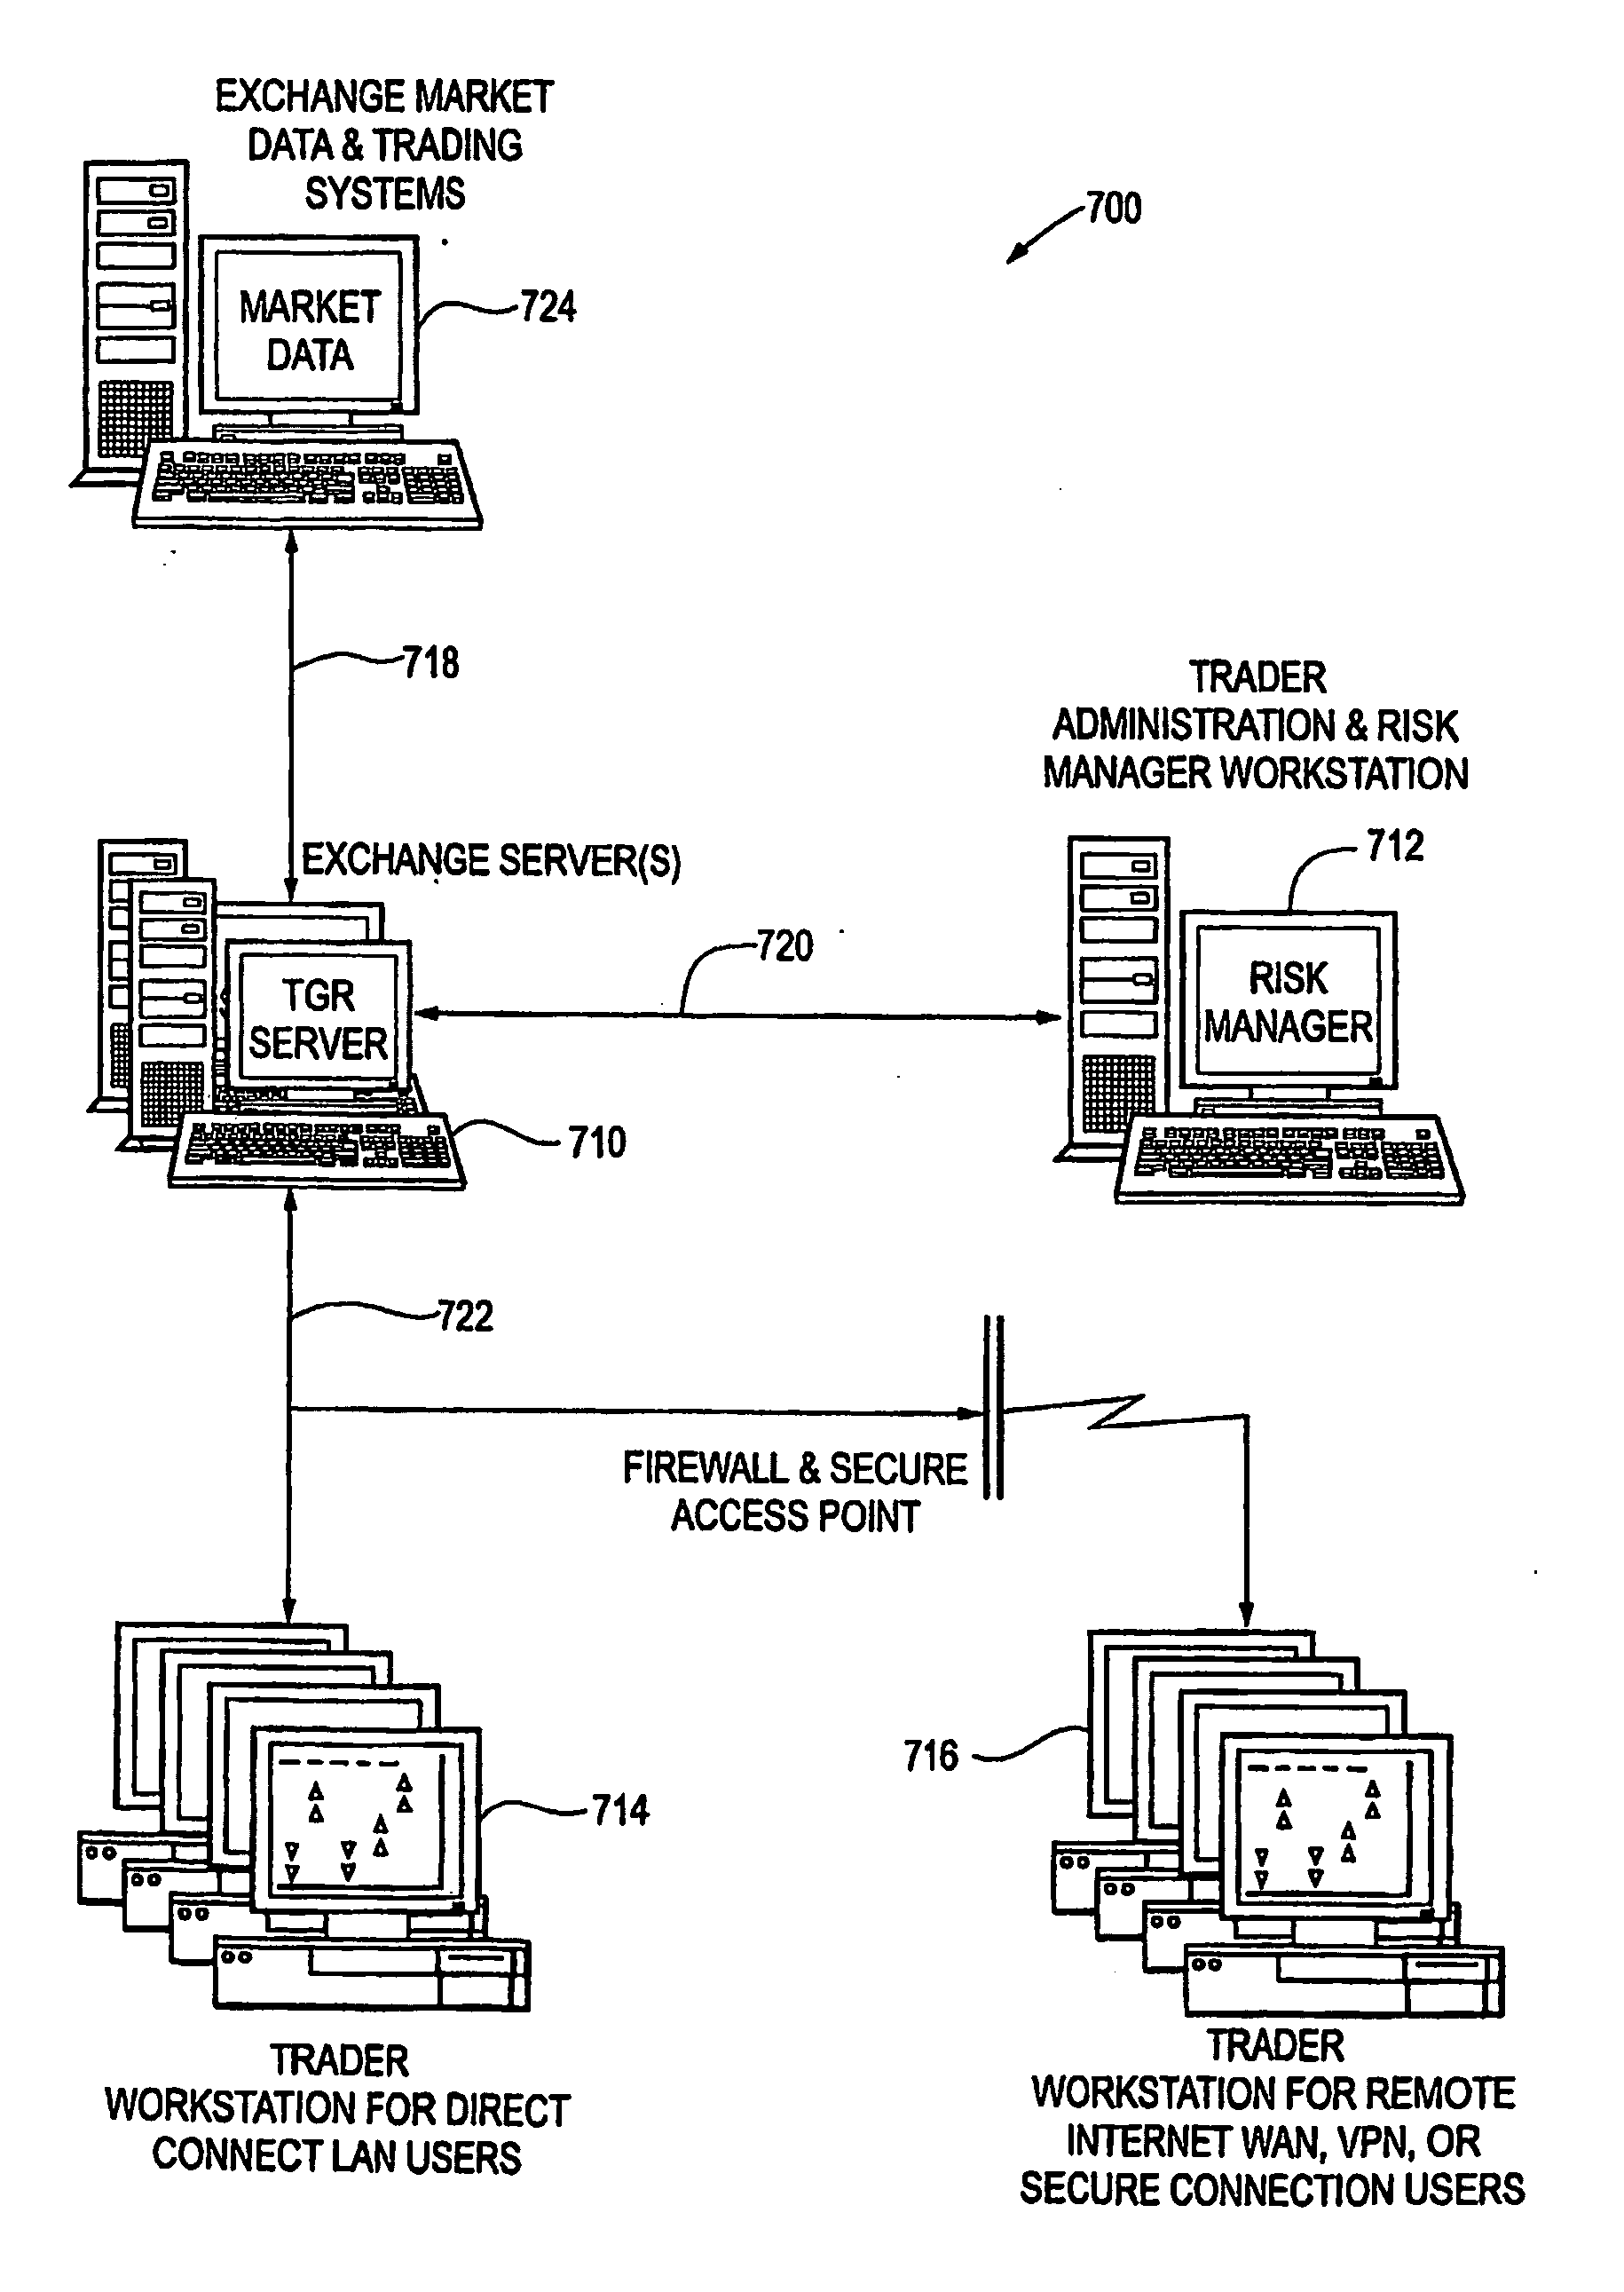
[0058]FIG. 7 is a block diagram depicting an overview of a system 700, constructed according to an aspect of the present invention, for analyzing and displaying security trade transactions, and for receiving from a user security trade orders. The system 700 comprises at least one exchange server 710, at least one trader administration and risk manager workstation 712 coupled to the exchange server 710, at least one trader workstation 714, 716 also coupled to the exchange server 710, appropriate software described further herein, and appropriate telecommunications and networking facilities 718, 720, 722 to allow communications among the servers and workstations. The exchange server (“Server”) 710 interfaces end-users with exchange market data and order routing capabilities. The trader workstations 714, 716 are client devices that provide end-user services. The administration and risk manager workstation 712 is used to set-up trader accounts for the system, set trading controls, and t...


PUM


Abstract

A system and methods for processing and charting security exchange trading and market information shows security traders if current transactions originated as buy orders (810) or sell orders (812), and simultaneously indicates traded quantity. Security exchange trading information is received including price, volume and time of each trade. Market information is also received including bids and offers. The security exchange trading and market information is processed simultaneously and displayed as a continuously updated realtime chart (800) depicting the exchange auction process. The chart (800) is formed by plotting each trade at the price traded, and for each plot point shows a distinctive icon indication whether the transaction was initiated by a buyer (810) or seller (812).

Description

FIELD OF THE INVENTION [0001] This application relates to systems and methods for analyzing and displaying securities transactions, and more particularly to systems and methods for displaying the details of securities market transactions and order books in near real-time so as to provide the user with information that closely approximates the quality and quantity of information available to a trader on an exchange floor. BACKGROUND OF THE INVENTION [0002] A large number of systems have been developed to support securities trading by persons who, for one reason or another, are not present at the floor of an exchange. Early systems delivered information describing transactions to remote locations by telephony or telegraphy. However, the information reported was typically quite limited, and might include, for example, the symbol, price and quantity of a security transaction. In addition, these systems generally employed manual processes and relatively slow information transmission medi...

Claims


Application Information

Patent Timeline
Patent Type & Authority Applications(United States)
IPC IPC(8): G06Q40/00G06F
CPCG06Q40/06G06Q40/04
Inventor DUQUETTE, DOUGLAS RAY
Owner TRADING TECH INT INC
Why Eureka
Try Eureka