Method of diagnosis of cancer based on gene expression profiles in cells

a cell and gene expression technology, applied in the field of cancer diagnosis, can solve the problems of relapse, mf is often misdiagnosed, and relatively rare cancer is difficult to diagnose, so as to achieve the effect of reducing the risk of recurrence, and improving the accuracy of diagnosis

Active Publication Date: 2006-11-30
THE WISTAR INST OF ANATOMY & BIOLOGY
View PDF1 Cites 68 Cited by
  • Summary
  • Abstract
  • Description
  • Claims
  • Application Information

AI Technical Summary

Benefits of technology

[0014] In another aspect, the invention provides a method of diagnosing a disease, disorder or pathology, such as a cancer characterized by a solid tumor, and/or monitoring the effect of treatment of such cancer, in a mammalian subject. This method involves examining a biological, e.g., peripheral blood, sample containing circulating immune cells or cancer cells of the subject and obtaining a first profile of a plurality of genes and comparing same to a gene expression profile, such as described above for certain cancers, and/or to a second profile of the genes from a healthy subject or from a subject with ano

Problems solved by technology

Although treatable in early stages, MF is frequently misdiagnosed because of similarities to more benign forms of skin disease.
However, although CTCL is readily treatable in early stages, this relatively rare cancer can be difficult to diagnose because of similarities to a variety of benign skin diseases and frequently goes undetect

Method used


Image

  • Method of diagnosis of cancer based on gene expression profiles in cells
  • Method of diagnosis of cancer based on gene expression profiles in cells
  • Method of diagnosis of cancer based on gene expression profiles in cells

Examples


example 1

Analyses of PBMC From Patients With CTCL

[0141] A. Purification of PBMC from CTCL Samples and Preparation of Normal Controls.

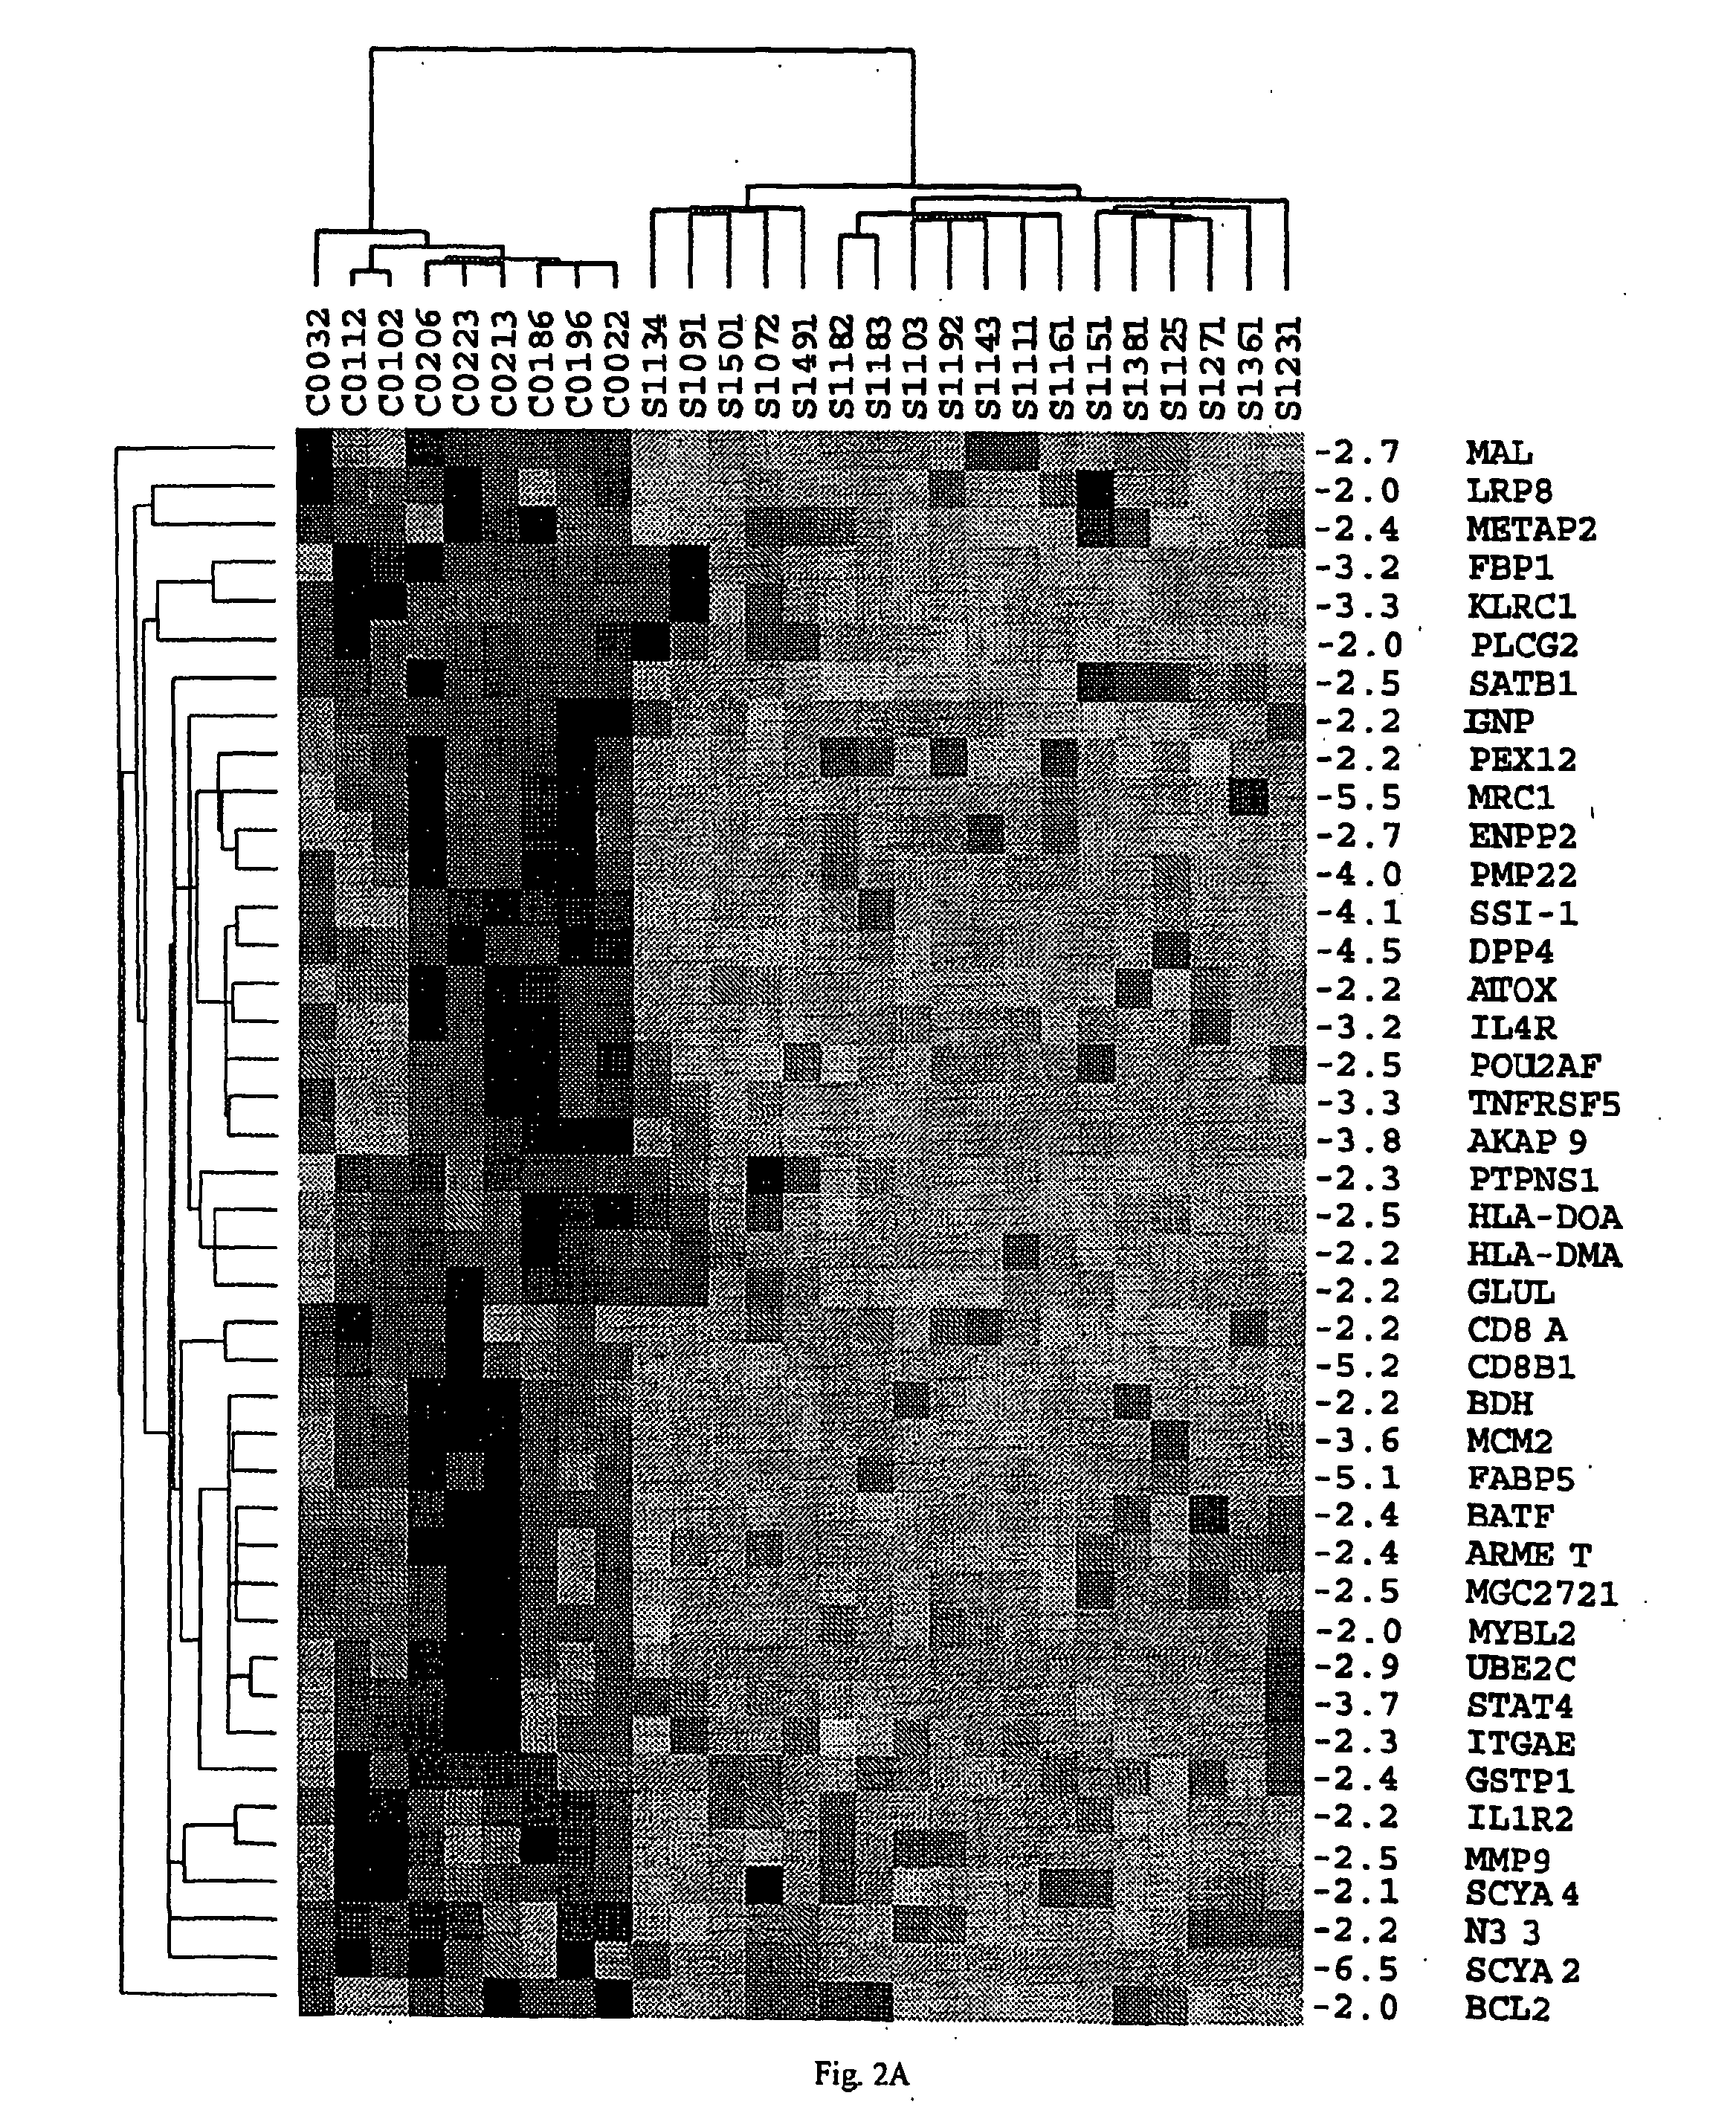
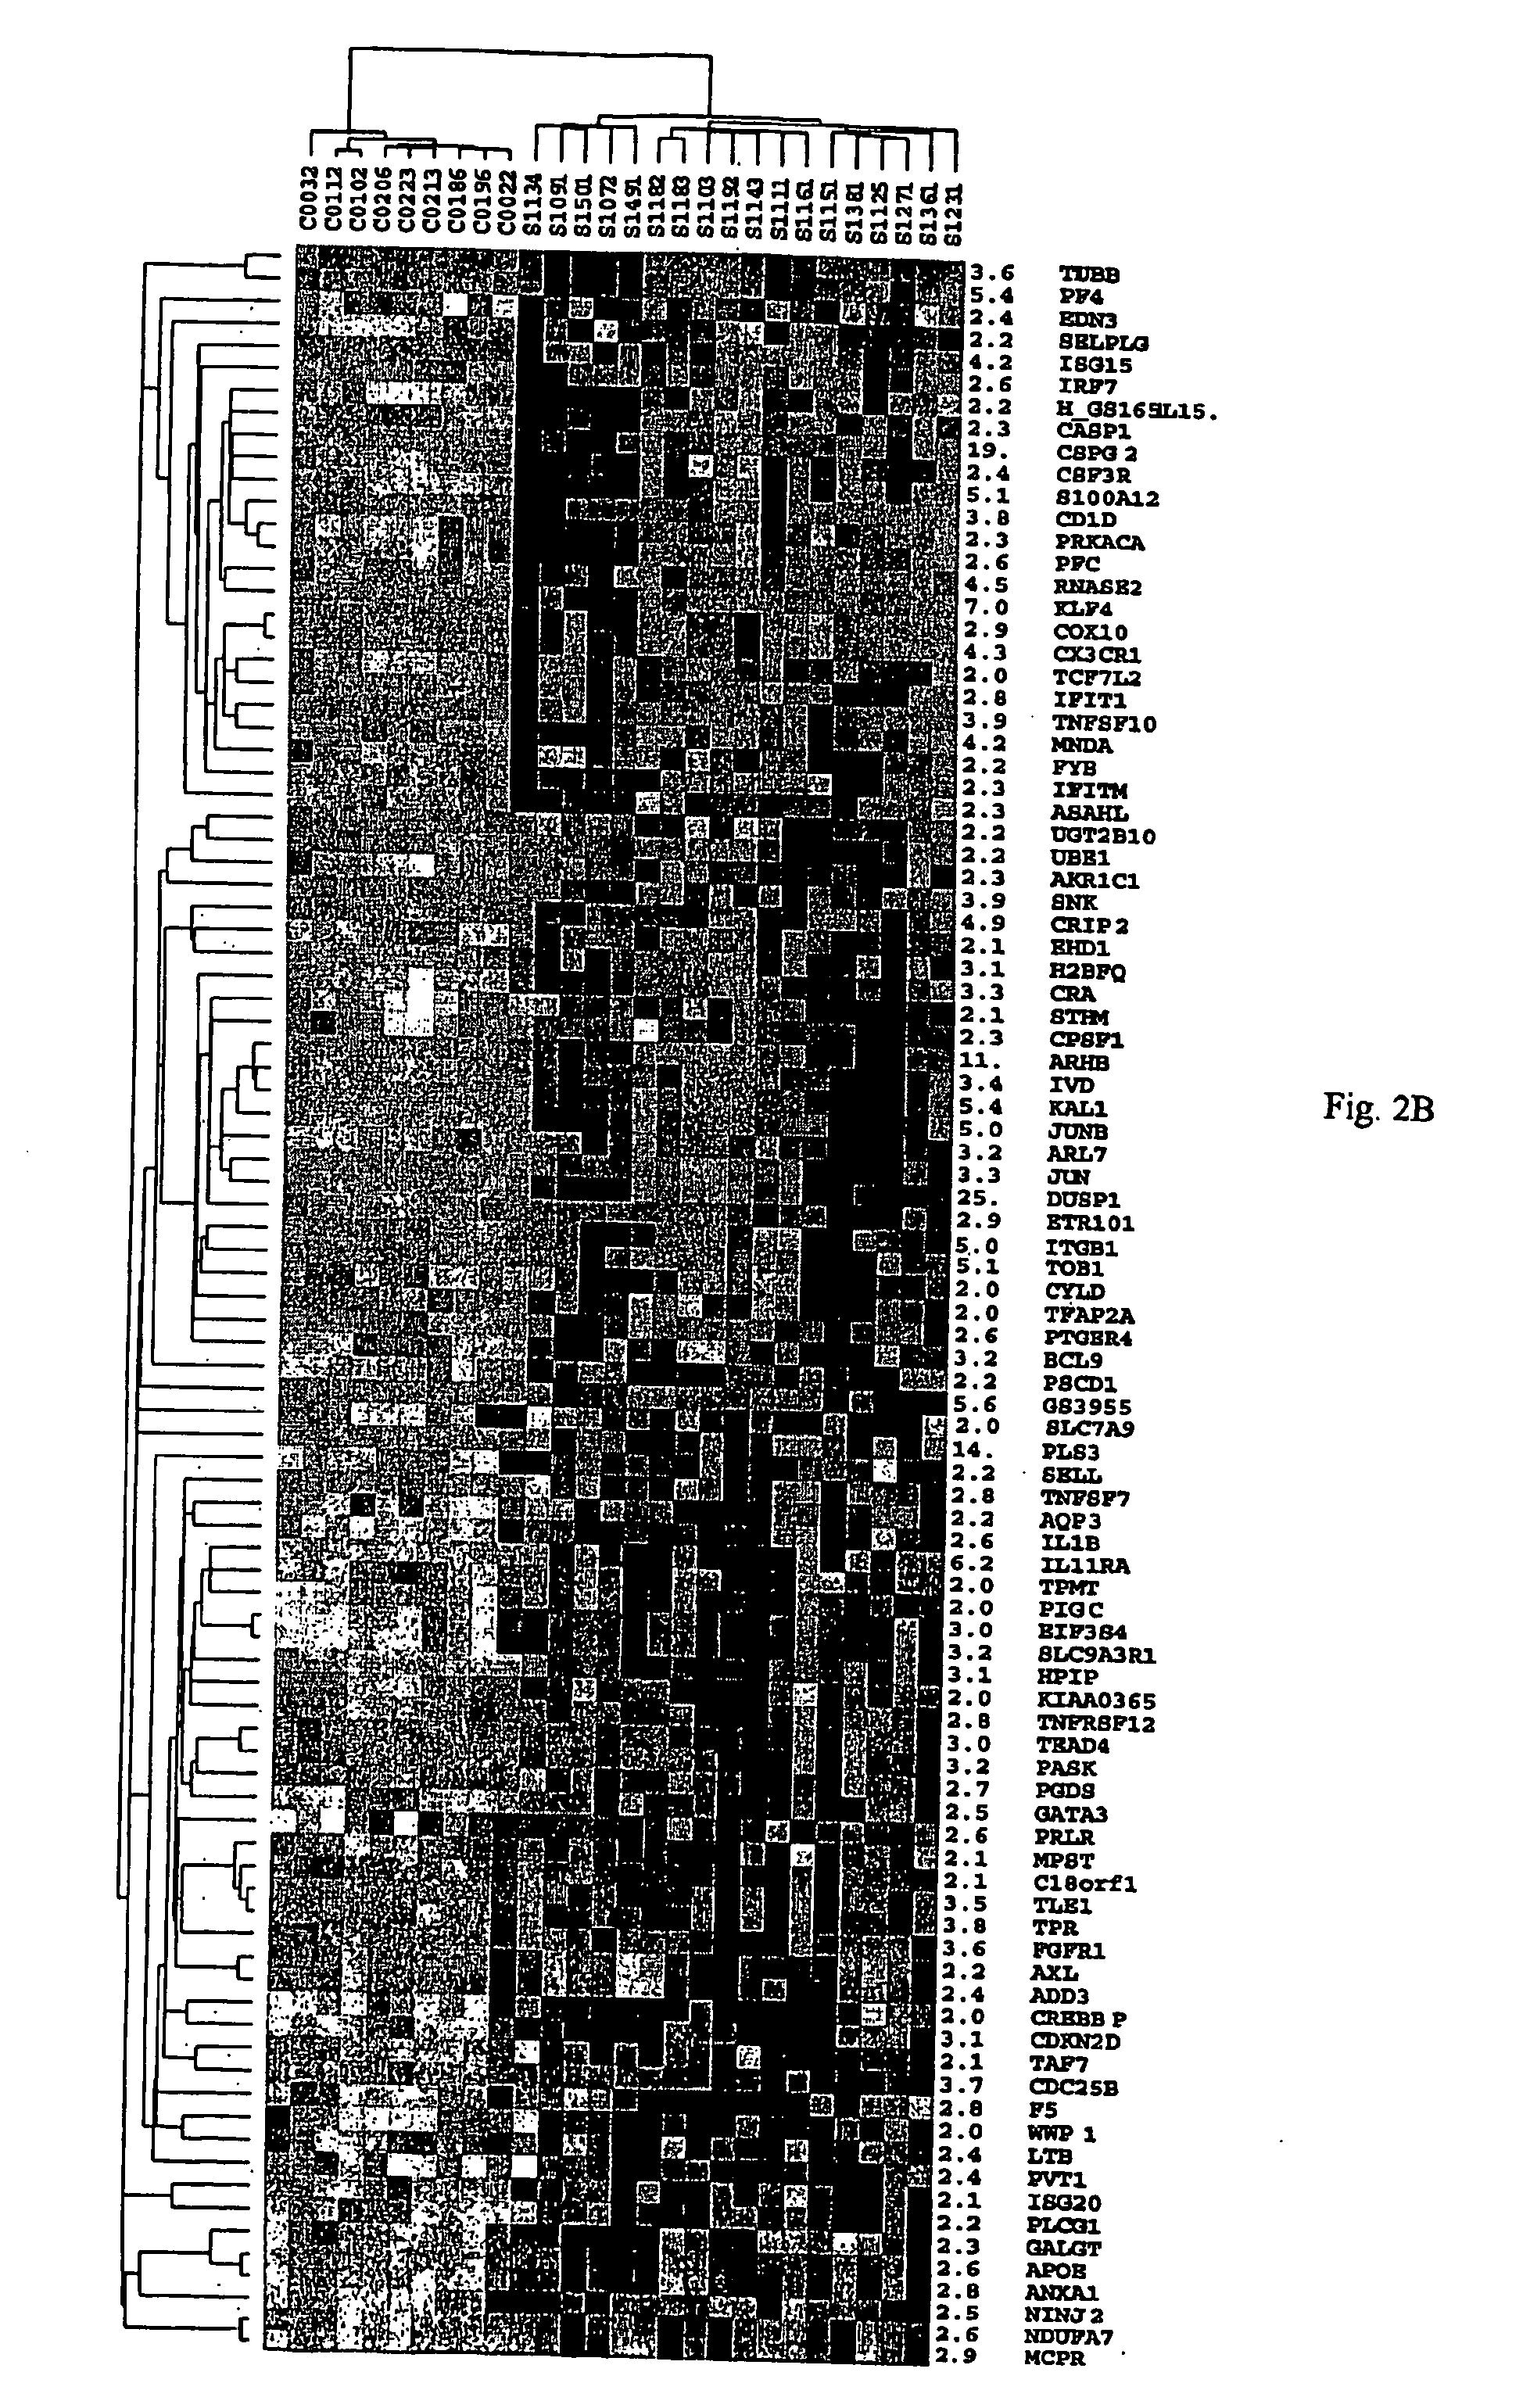
[0142] PBMC were obtained by Ficoll gradient separation from peripheral blood of both normal volunteers and leukemic phase CTCL (Showe, L. C. et al, Ann N Y Acad Sci, 795: 413415, 1996 (Showe I); Gerosa, F., et al., Clin Immunol, 92: 224-234, 1999 (Gerosa II)). A total of 48 viably frozen CTCL patient samples with Sezary cells ranging from 5-99% of the lymphocyte population were analyzed. The Ficoll-purified PBMC fraction from high SS patients was 60-95% CD4+ malignant cells with a predominantly Th2 phenotype, and in decreasing abundance small percentages of B cells, monocytes and dendritic cells. Th2 skewed PBMC, prepared by culturing for 4 days in IL-4 and anti-IL-12, were used as controls for the high Sezary cell patients, as many characteristics of advanced disease are associated with a Th2 polarized immune response. Under these conditions >95% of the CD4...

example 2

Validation of Array Results Using Quantitative Real-Time PCR

[0165] To determine the accuracy of changes in gene expression reported by the arrays in Example 1, selected genes were assayed by quantitative real-time PCR (QPCR) for the eighteen high Sezary cell samples and nine Th2 controls. The direction of change by PCR was in agreement for every gene tested. Of 32 genes tested, only one gene, PLS3, showed an important difference in the two assays (500-fold up by QPCR and only 14-fold up by array, probably attributable to some cross-hybridization which raised the array control values.

[0166] Over the remaining 31 genes, for approximately 75%, the two ratios agreed within a factor of two, the average of the microarray ratio to the QPCR ratio was 0.70, and the median was 0.61. The comparison of the PCR and microarray assay in Table 5 shows that the arrays give a highly reliable estimate of the direction of change in gene expression with a tendency to underestimate quantitative differe...

example 3

Expression Profiles of a Small Number of Genes Identified by Penalized Discriminant Analysis Correctly Classify High Sezary Patients and Normal Control Samples

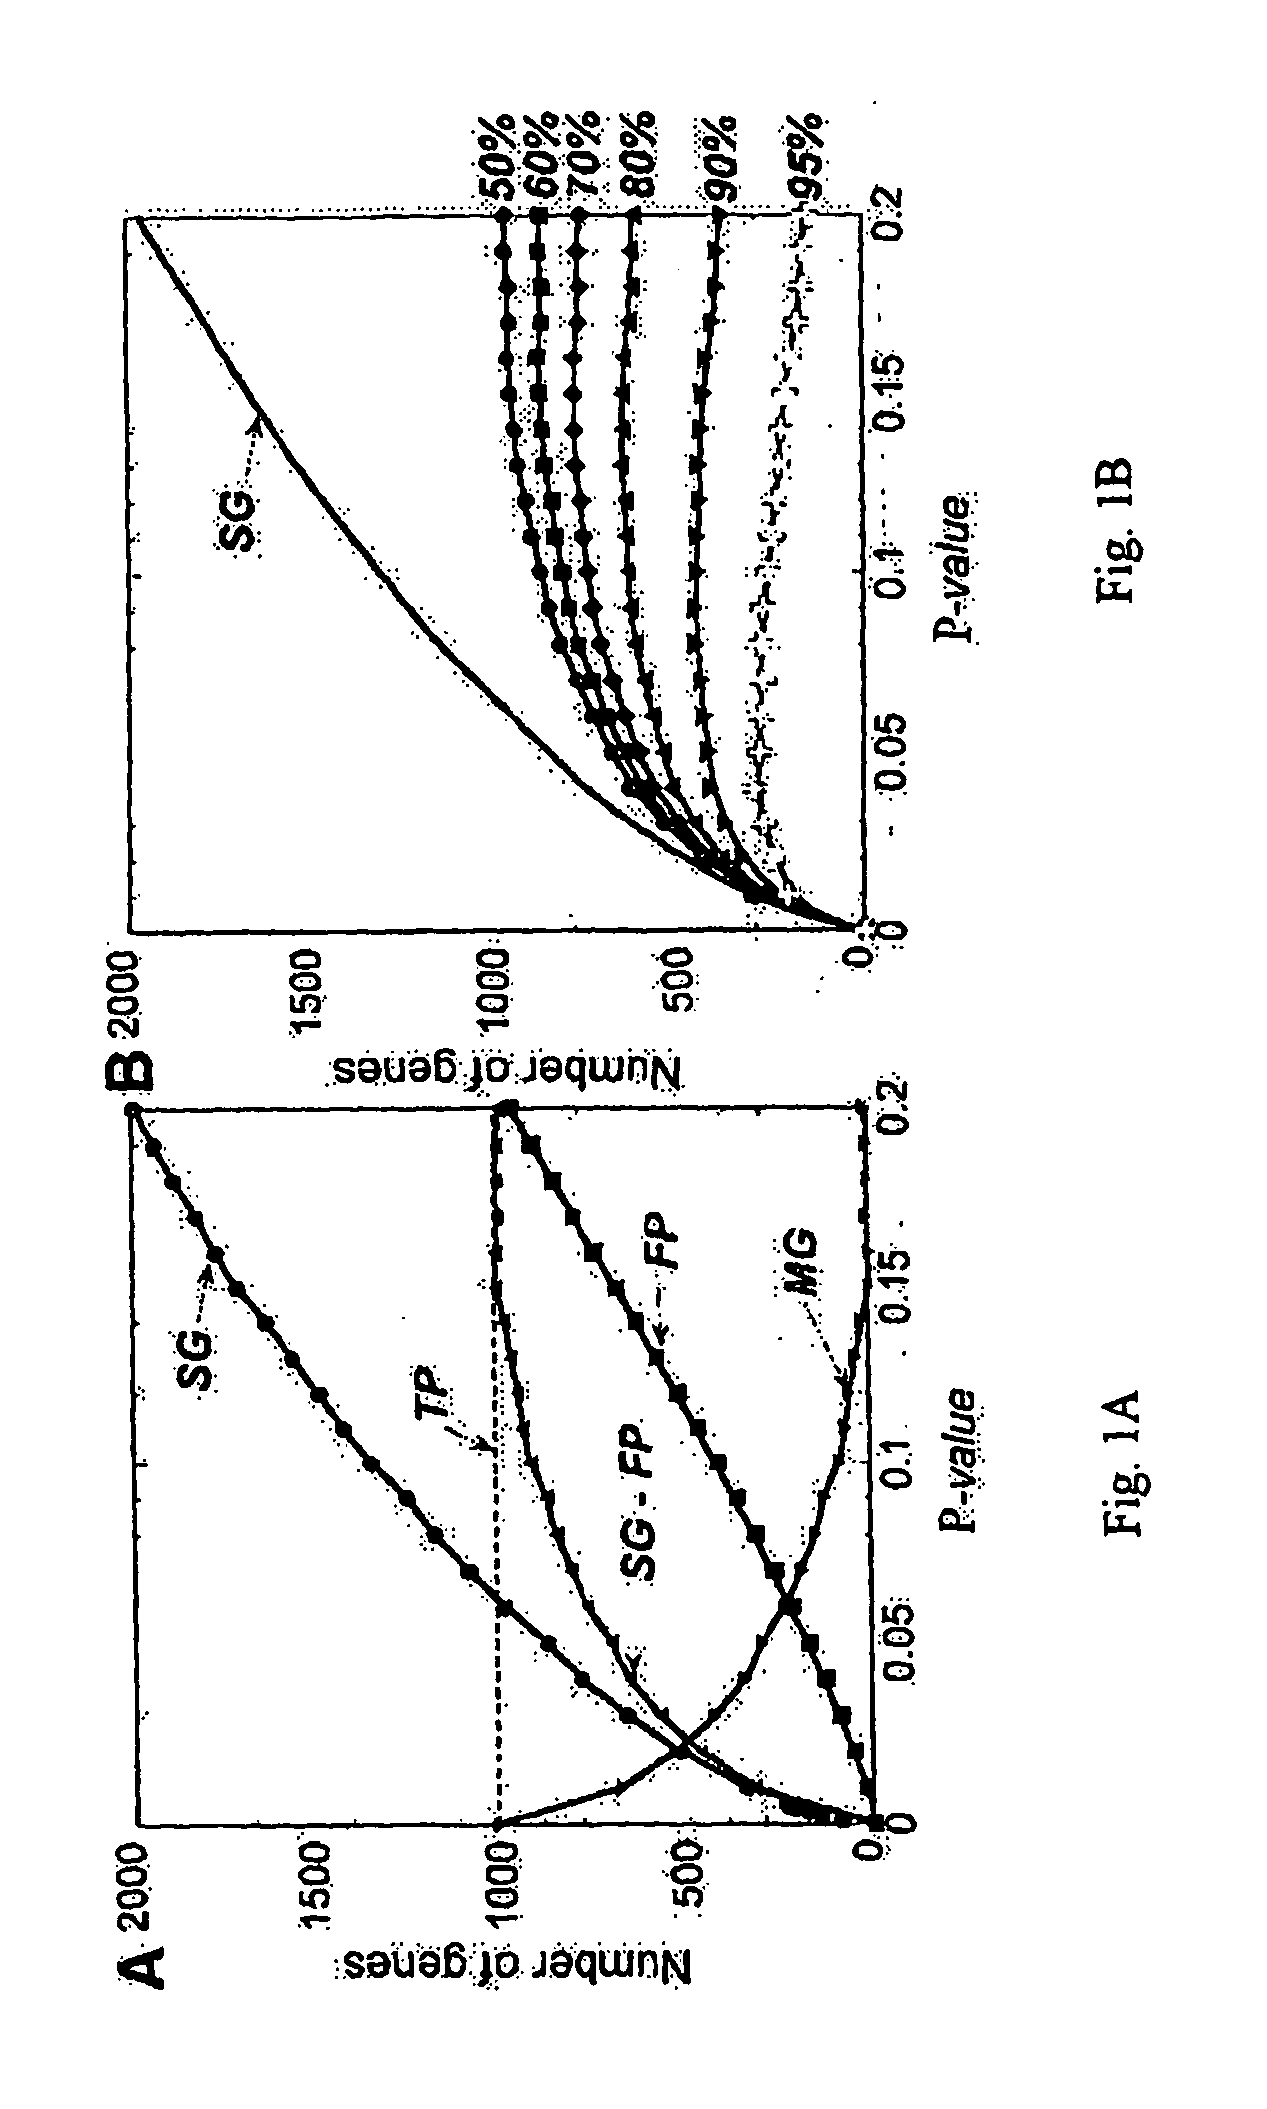
[0167] PDA, as implemented by CLEAVER was used to identify genes with the highest power to correctly distinguish patients from controls. To identify the best genes for distinguishing the two sample classes, the PDA program was trained on the eighteen high Sezary cell samples versus nine Th2-skewed and three untreated controls. Crossvalidation of the samples in these two classes is 100% accurate.

[0168] To select the best features for classification a pHuman Behavior and Principle of Least Effort: An Introduction to Human Ecology Addison Wesley, Cambridge, Mass.), these 200 genes are expected to most effectively differentiate patients from controls.

[0169] As few as four of these genes, for example, either

[0170] 1) STAT4, TOB1, CD26 and TRAIL, or

[0171] 2) STAT4, TOB1, SEC61A1 and GS3686, can be used for correct classificatio...


PUM

PropertyMeasurementUnit
Therapeuticaaaaaaaaaa
Gene expression profileaaaaaaaaaa

Abstract

A method of developing a gene expression profile indicative of the presence or stage of a selected a disease, disorder or genetic pathology in a mammalian subject employs penalized discriminant analysis with recursive feature elimination. A method of diagnosing a cancer in a mammalian subject includes the steps of examining a sample containing the subject's immune cells and detecting a variance in the expression of a statistically significant number of genes, e.g., at least 10 non-tumor genes from those same genes in a characteristic disease or healthy gene expression profile. A significant variance in expression of these genes when compared to a gene expression profile, preferably an average gene expression profile of a normal control, or significant similarities to an average gene profile of subjects with cancer, correlates with a specific type of cancer and/or location of tumor.

Description

STATEMENT REGARDING FEDERALLY SPONSORED RESEARCH OR DEVELOPMENT [0001] This invention was supported in part by the Grant Nos. UO1-CA85060 and P30 CA10815-34S3 from the National Institutes of Health. The United States government has an interest in this invention.BACKGROUND OF THE INVENTION [0002] The present invention relates to the diagnosis of cancer, and more specifically to the use of characteristic patterns of gene expression by circulating cells of the immune system and / or circulating cancer cells and / or tumor cells as a method of diagnosis. [0003] Microarrays of several different types have been used to characterize cancer types in patients, most often to distinguish the tissue of origin or a tumor (Ramaswami et al, 2001, Proc. Natl. Acad. Sci. USA, 98:15149-54) or original cell type of a leukemia (Golub et al, 1999 Science, 218:531-7). In contrast, current practice of cancer diagnosis usually depends on imaging methods, e.g., chest X-rays, histological studies, mammograms, an...

Claims


Application Information

Patent Timeline
IPC IPC(8): G06F19/00G16B25/10A61BA61B5/00C07K16/00C12Q1/68G01N33/567G16B40/30
CPCG06F19/24G06F19/20G16B25/00G16B40/00G16B40/30G16B25/10
Inventor SHOWE, LOUISESHOWE, MICHAELKARI, LASZLONEBOZHYN, MICHAELLOBODA, ANDREY
Owner THE WISTAR INST OF ANATOMY & BIOLOGY
Why Eureka
Try Eureka