

Abnormality monitoring system and abnormality monitoring method
a monitoring system and abnormality technology, applied in the direction of testing/monitoring control systems, program control, instruments, etc., can solve the problems of inability to improve the accuracy of abnormality detection, take a lot of time or labor to adapt parameters, and take a lot of time or labor to adapt threshold values, etc., to achieve high accuracy and high accuracy
- Summary
- Abstract
- Description
- Claims
- Application Information
AI Technical Summary
Benefits of technology
Problems solved by technology
Method used
Image

Examples
first embodiment
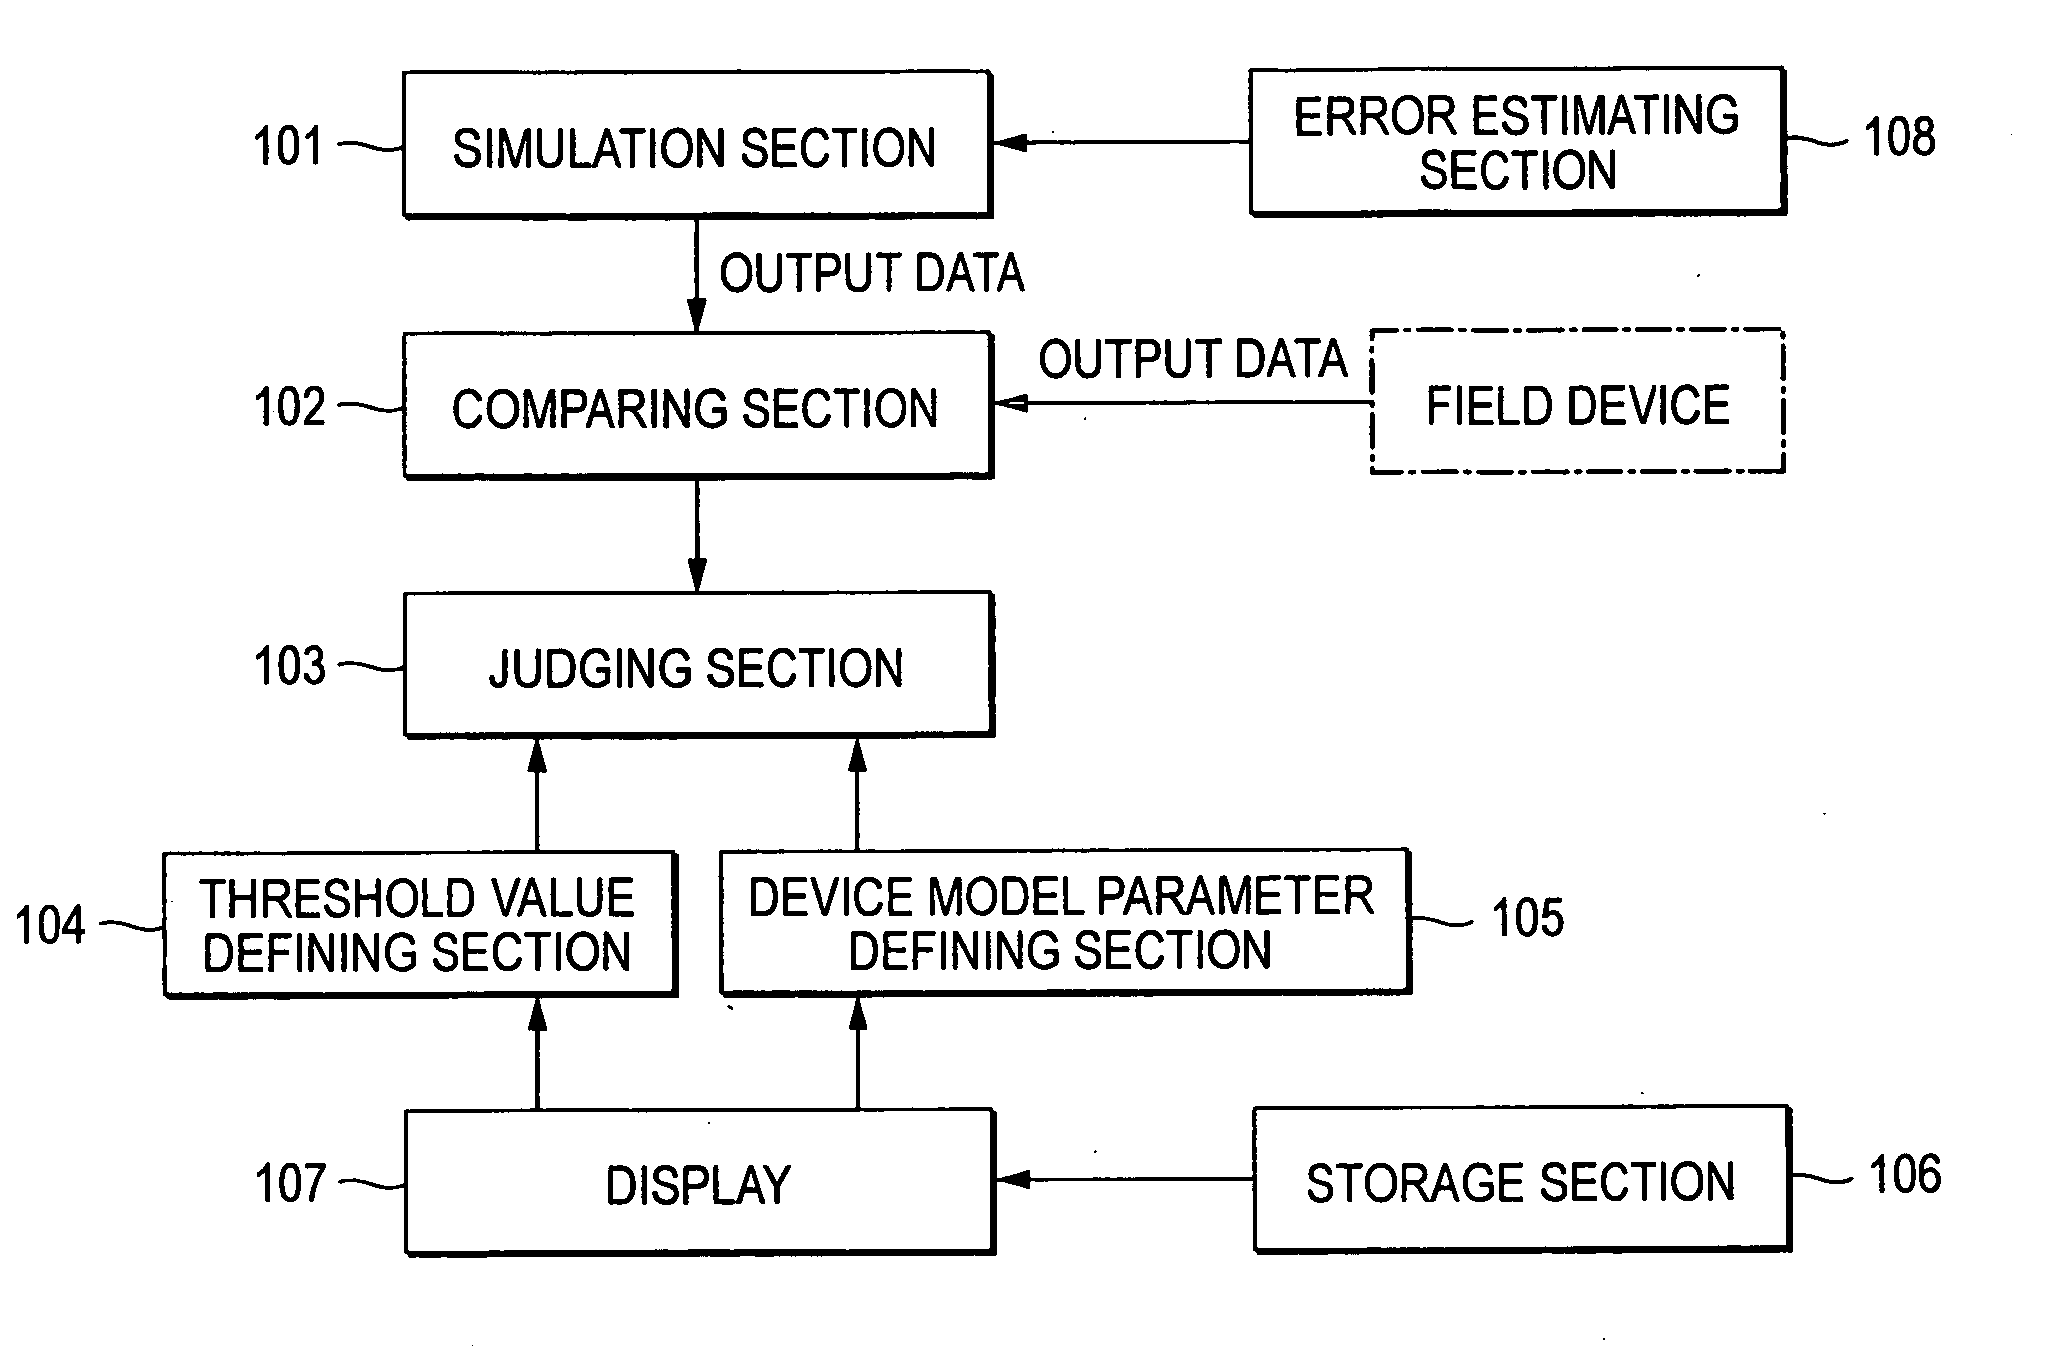
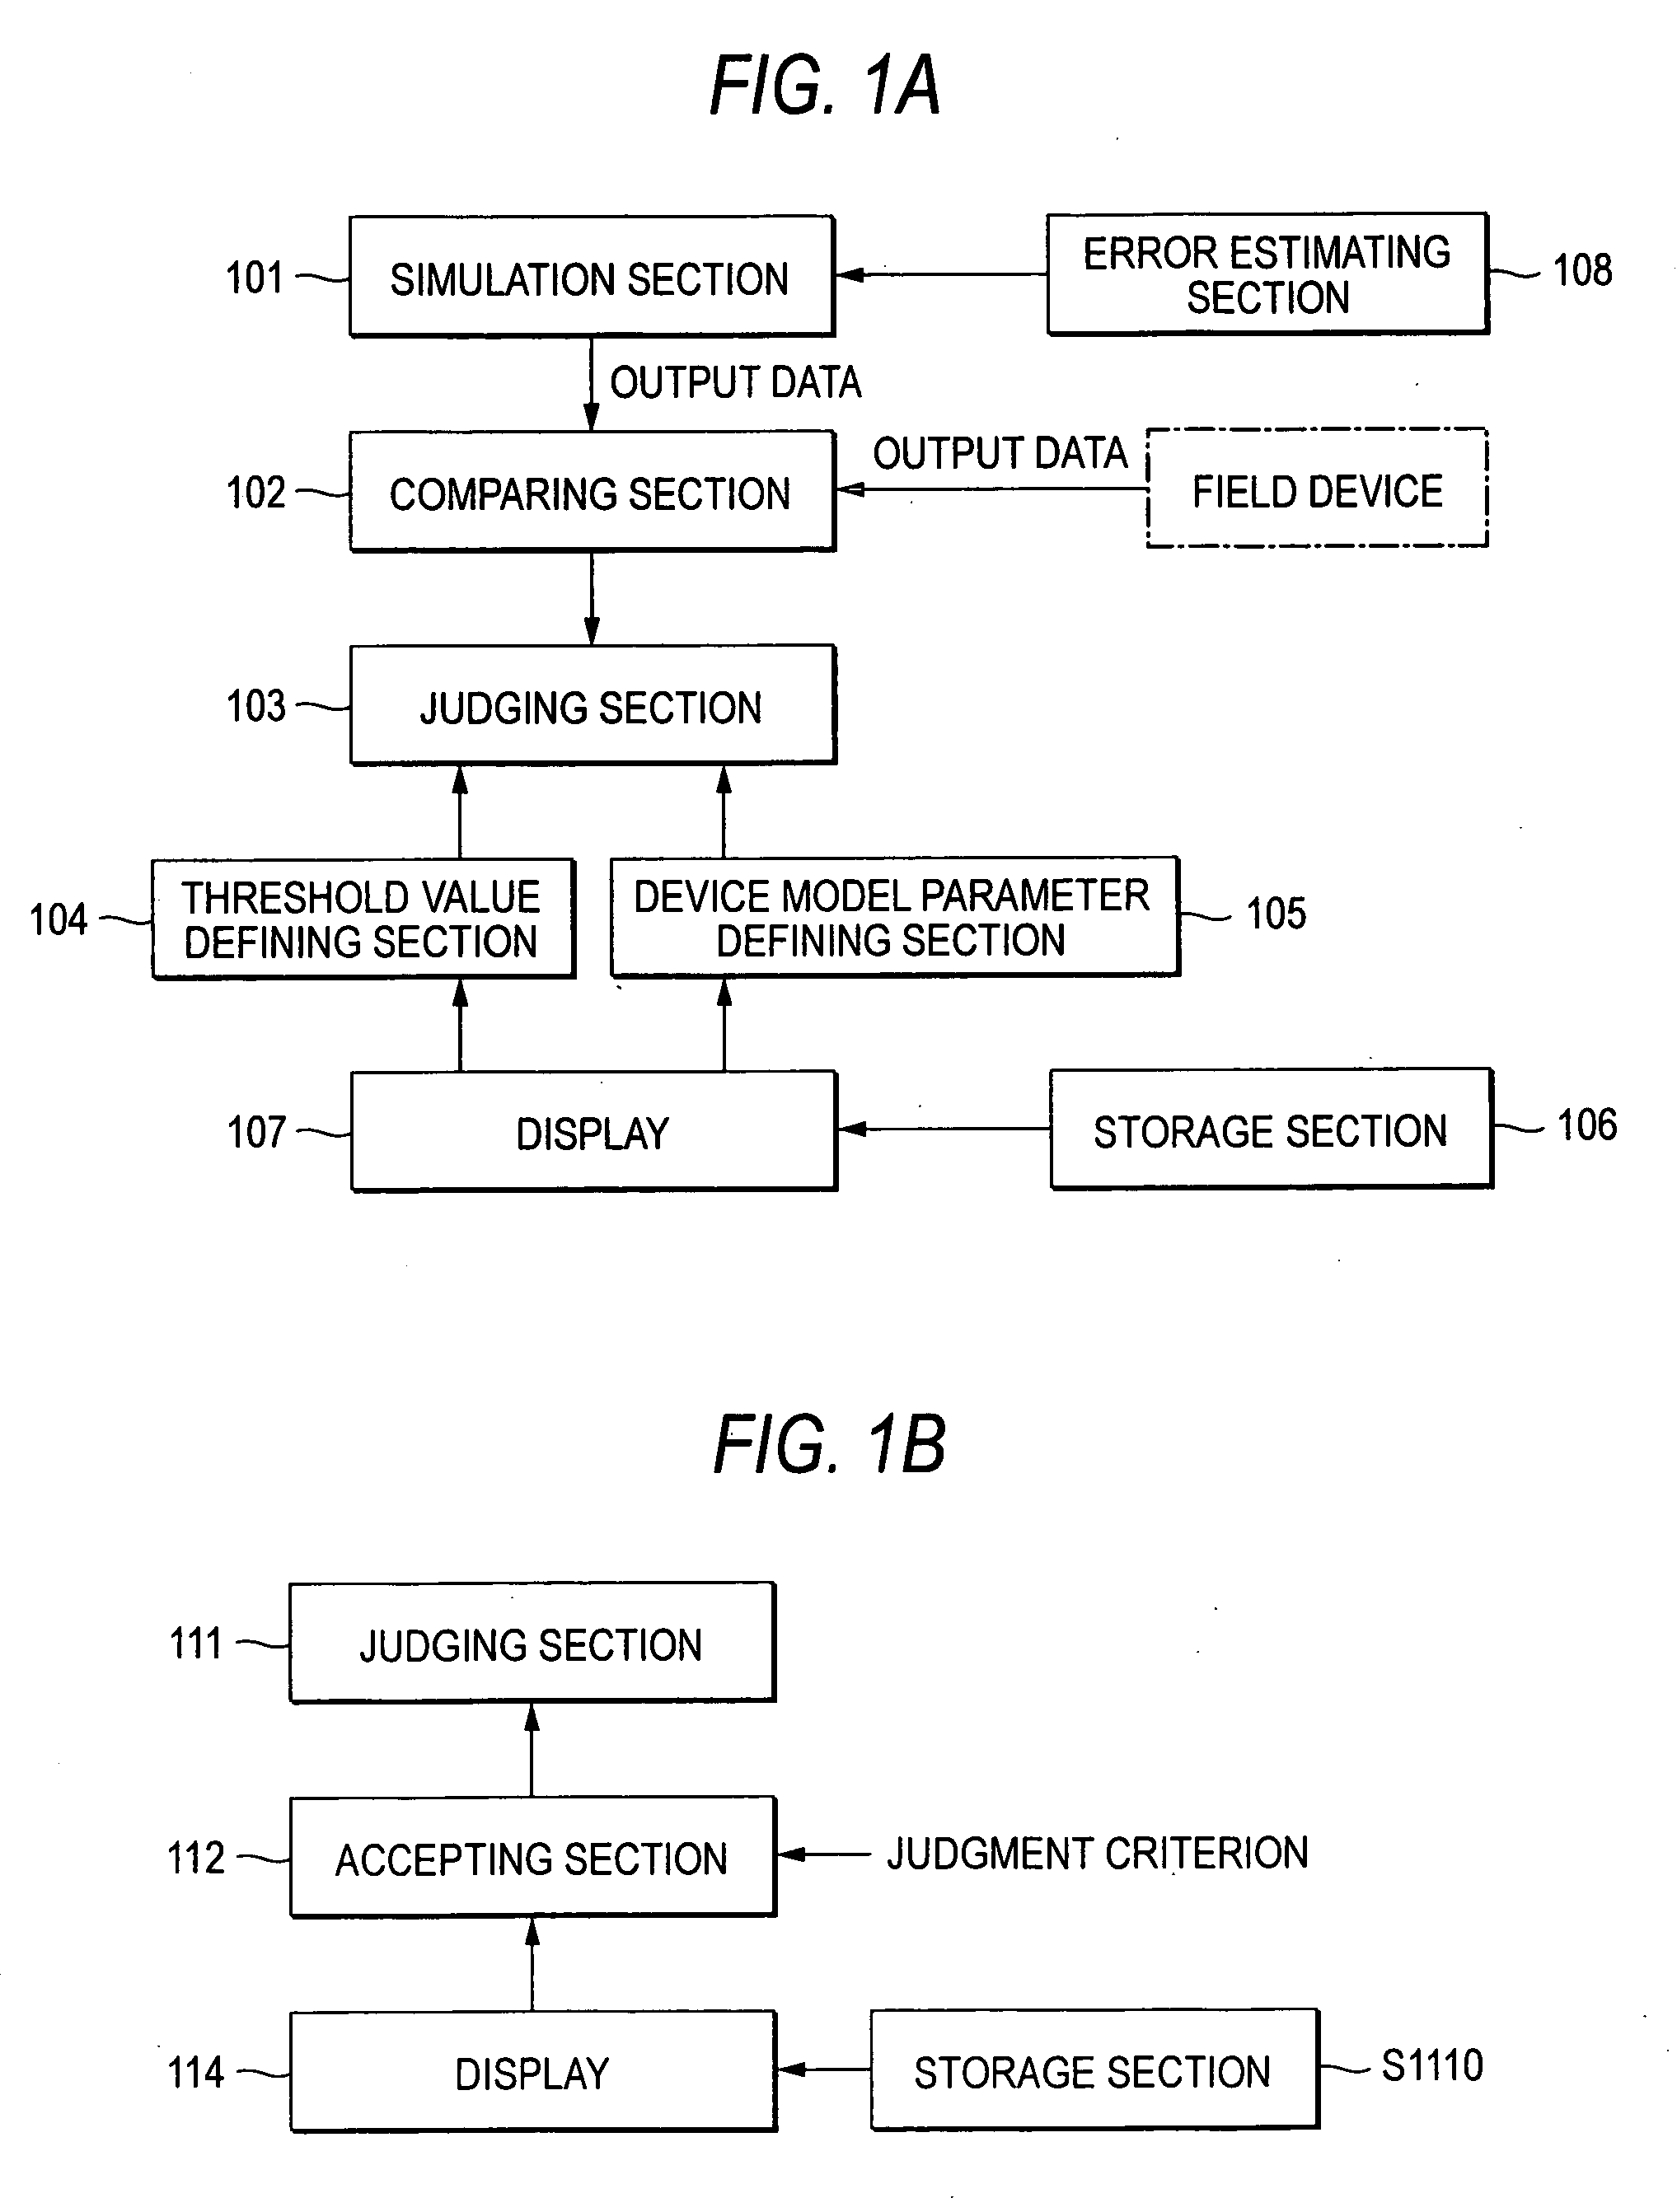
[0091] A first embodiment of the abnormality monitoring system according to the invention will be described below with reference to FIGS. 2 to 4.
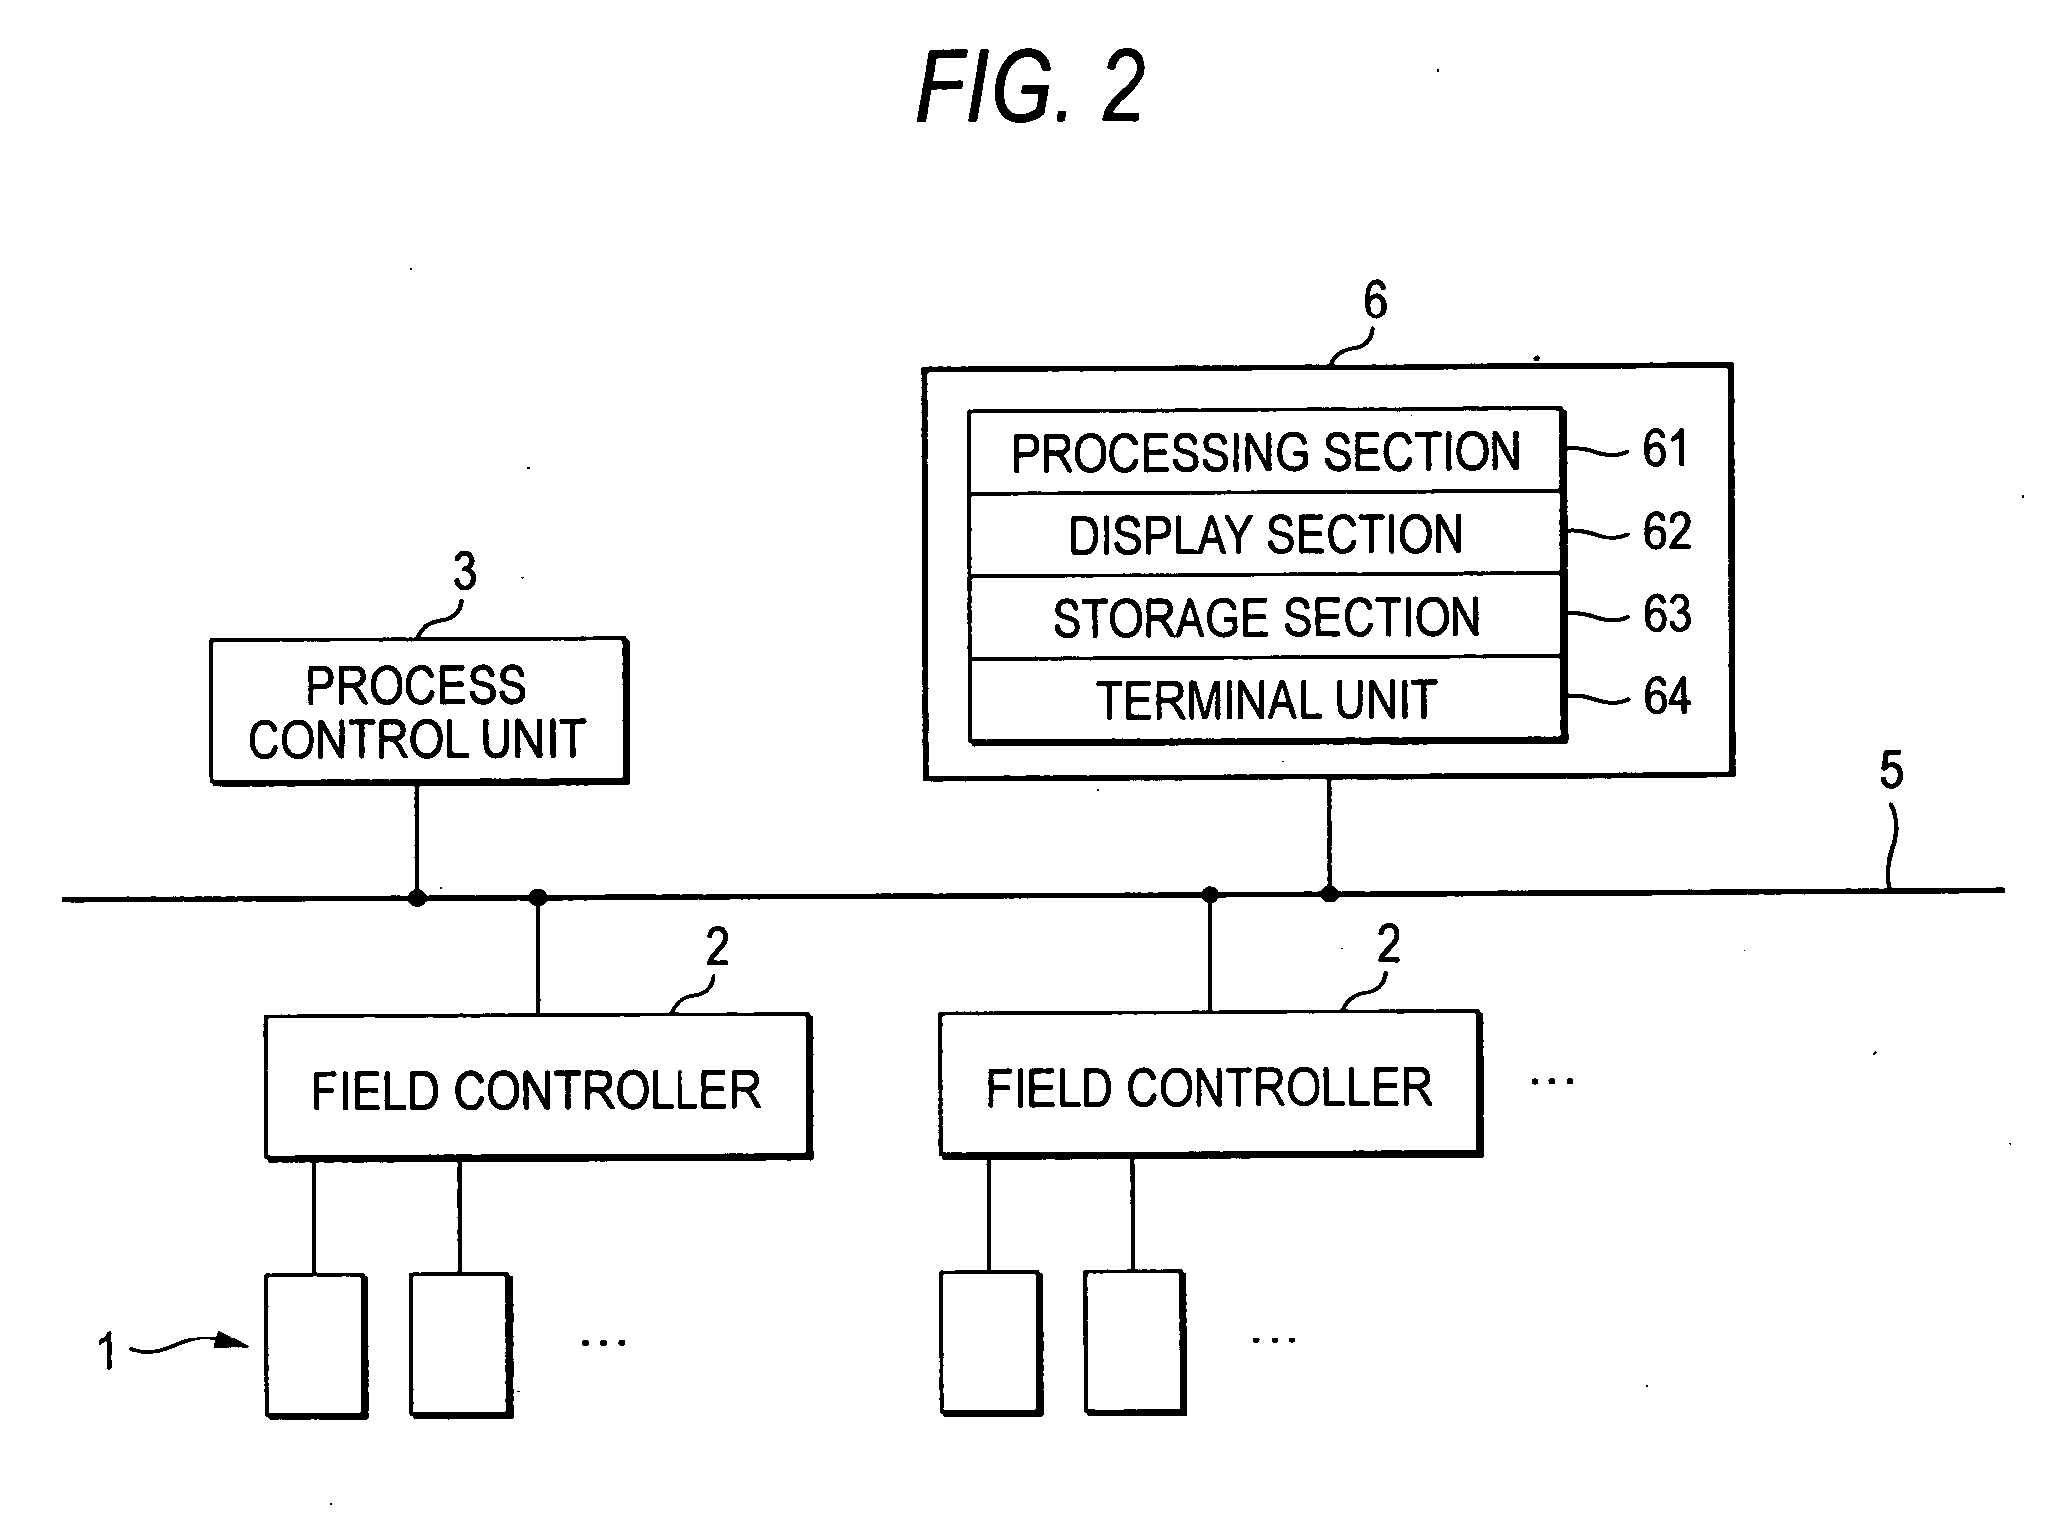
[0092]FIG. 2 is a block diagram showing a configuration of a plant control system to which the abnormality monitoring system of the present embodiment is applied.
[0093] As shown in FIG. 2, the plant control system includes field controllers 2 for controlling field devices 1 such as a heat exchanger, a valve, a compressor or a pump, which are installed in a plant, and a process control unit 3 for conducting communication between the field controllers 2 which are distributed and arranged in the plant, controlling each of the field devices 1, and making an automatic running of a process. As shown in FIG. 2, the field controllers 2 and the process control unit 3 are mutually connected through a communication line 5.
[0094] Also, a device monitoring unit 6 for monitoring abnormality of the plant through operations of the field devices 1 is con...
second embodiment
[0126] A second embodiment of the abnormality monitoring system according to the invention will be described below with reference to FIG. 5.
[0127] In the abnormality monitoring system of the present embodiment, the case of monitoring abnormality of a plant based on input-output data of a field device without simulating the field device is shown.
[0128]FIG. 5 is a diagram illustrating a display image for setting a threshold value used in abnormal diagnosis. This example shows the case of setting a threshold value about a flow rate and an opening of a valve as a field device 1.
[0129] As shown in FIG. 5, the past actual measured values 51 in the field device 1, and a boundary line 53a and a boundary line 53b indicating the present threshold values are displayed on a display screen. The actual measured value 51 are process data stored as history data. Also, an area surrounded by the boundary line 53a and the boundary line 53b indicates normality, and its outside area indicates abnorma...
PUM
 Abstract
Description
Claims
Application Information