Price and risk evaluation system for financial product or its derivatives, dealing system, recording medium storing a price and risk evaluation program, and recording medium storing a dealing program
a risk evaluation and financial product technology, applied in the field of price and risk evaluation system for financial product or its derivatives, can solve the problems of low probability of occurrence of big price change, insufficient reliability of conventional technique for evaluating risk for financial products or derivatives, and inability to provide reliable results. , to achieve the effect of removing defects or drawbacks
- Summary
- Abstract
- Description
- Claims
- Application Information
AI Technical Summary
Benefits of technology
Problems solved by technology
Method used
Image
Examples
example 1
r=0.05, σ2=0.11, and T=0.25 Year
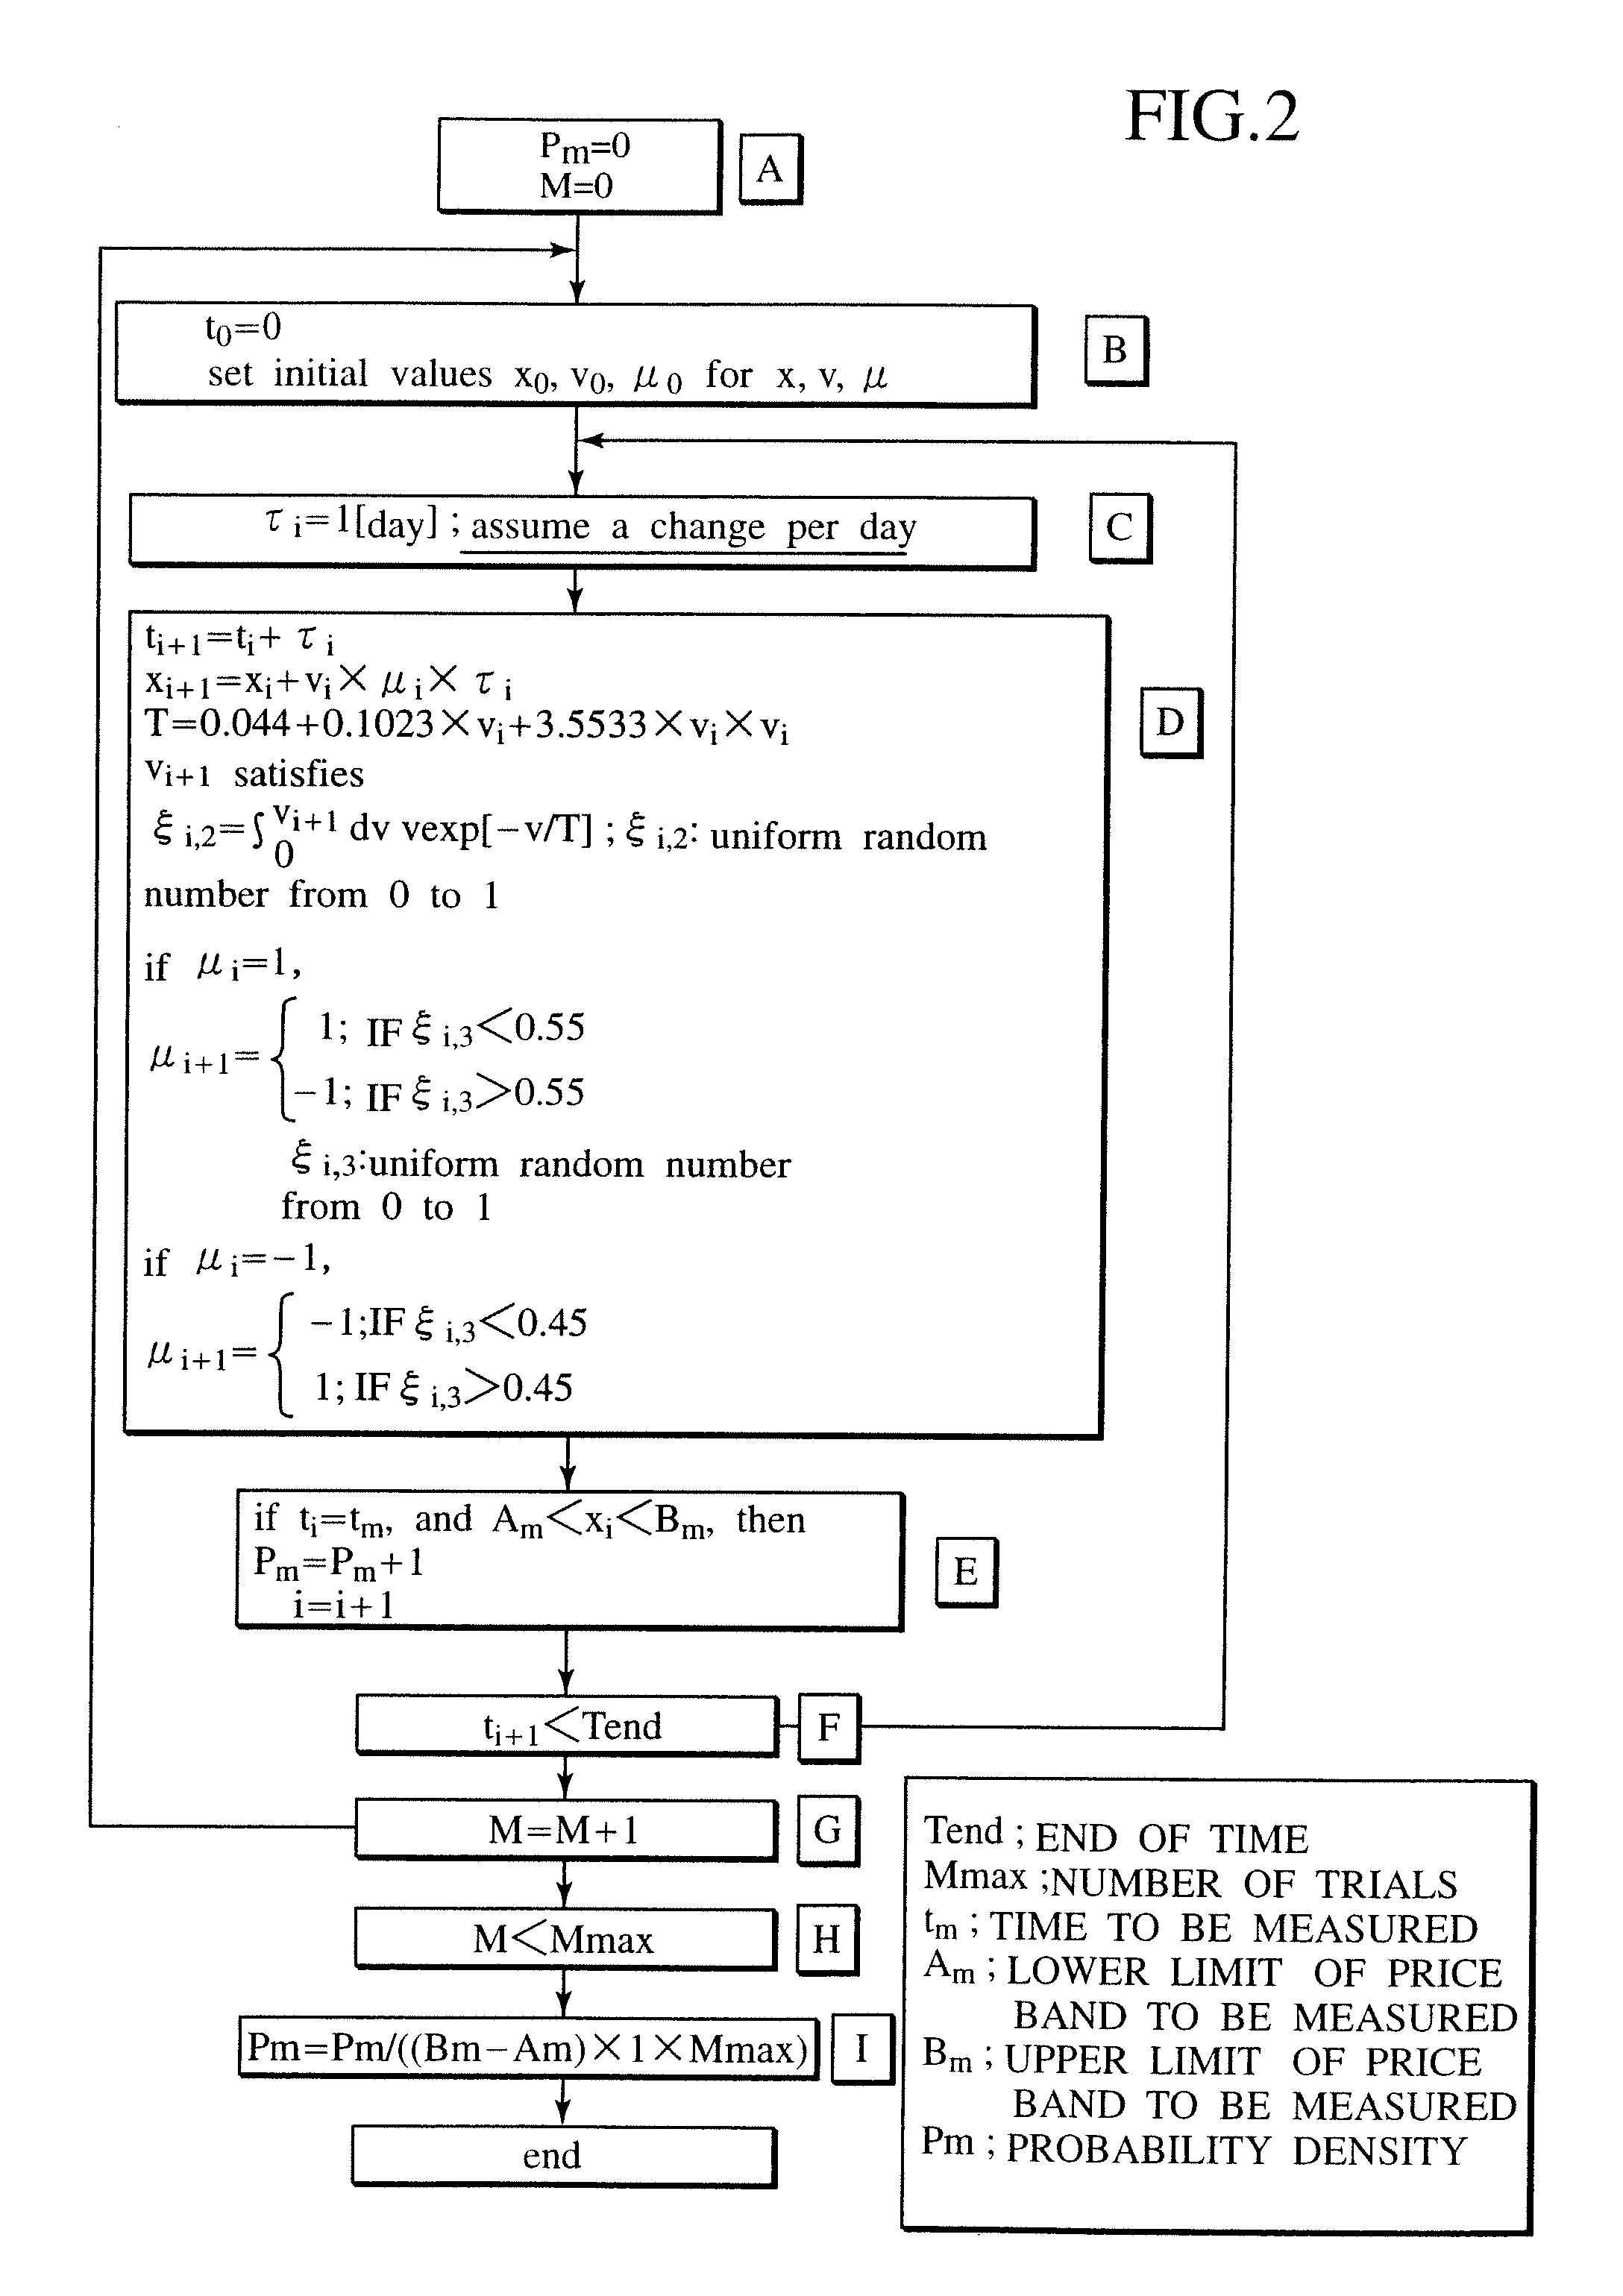
[0261] The lower and upper limits Am and Bm of x (price) shown in the flowchart of FIG. 3 define a price band, which is determined by dividing the range of −3σ>x>3σ(δx=0.1σ) by 60. The lower limit Cm and the upper limit Dm of time t define a time band, where Cm equals 0.25 [years] and Dm equals Cm+(1 / 365) [years]. An evaluation quantity ωi is 1.
[0262]FIG. 6 shows the evaluation result of example 1 using the solid line 22 in comparison with the theoretical distribution (i.e., the logarithmic normal distribution) indicated by the dashed line 21. As is clear from FIG. 6, the simulation result of the present invention indicated by the solid line 22 is almost coincident with the theoretical distribution 21.
example 2
σ2=0.1, r=0.05 and r=0
[0263] The lower and upper limits Am and Bm of x shown in the flowchart of FIG. 3 are set to Am=−∞and Bm=+∞. The time band defined by Cm and Dm are from 0 to 365 [day] with δt=1 [day]. The evaluation quantity ωi is x. In FIG. 7, the dashed line 23 indicates the theoretical distribution 23 under a drift, and the long dashed line 24 indicates the theoretical distribution 24 without a drift. The simulation results 25 and 26 obtained in example 2 substantially reproduce the theoretical distributions with and without a drift.
[0264] The velocity distribution and the direction distribution used in the above-explained simulation are the probability distribution same as the standard Gaussian distribution. Consequently, the probability density obtained by the simulation becomes equivalent to that of the diffusion model.
[0265] In order to realize the Boltzmann model, the velocity distribution and the direction distribution must be evaluated.
[0266] An example of how to...
PUM
 Abstract
Description
Claims
Application Information
 - R&D
- Intellectual Property
- Life Sciences
- Materials
- Tech Scout
- Unparalleled Data Quality
- Higher Quality Content
- 60% Fewer Hallucinations
Browse by: Latest US Patents, China's latest patents, Technical Efficacy Thesaurus, Application Domain, Technology Topic, Popular Technical Reports.
© 2025 PatSnap. All rights reserved.Legal|Privacy policy|Modern Slavery Act Transparency Statement|Sitemap|About US| Contact US: help@patsnap.com


