Efficient statistical timing analysis of circuits

a statistical timing analysis and integrated circuit technology, applied in stochastic cad, instruments, cad techniques, etc., can solve the problems of increasing the number of delays, increasing increasing the susceptibility to noise, so as to reduce the computational burden of the max operation, reduce the size of the tuple mt, and reduce the number of delays

Active Publication Date: 2007-11-29
WISCONSIN ALUMNI RES FOUND
View PDF0 Cites 63 Cited by
  • Summary
  • Abstract
  • Description
  • Claims
  • Application Information

AI Technical Summary

Benefits of technology

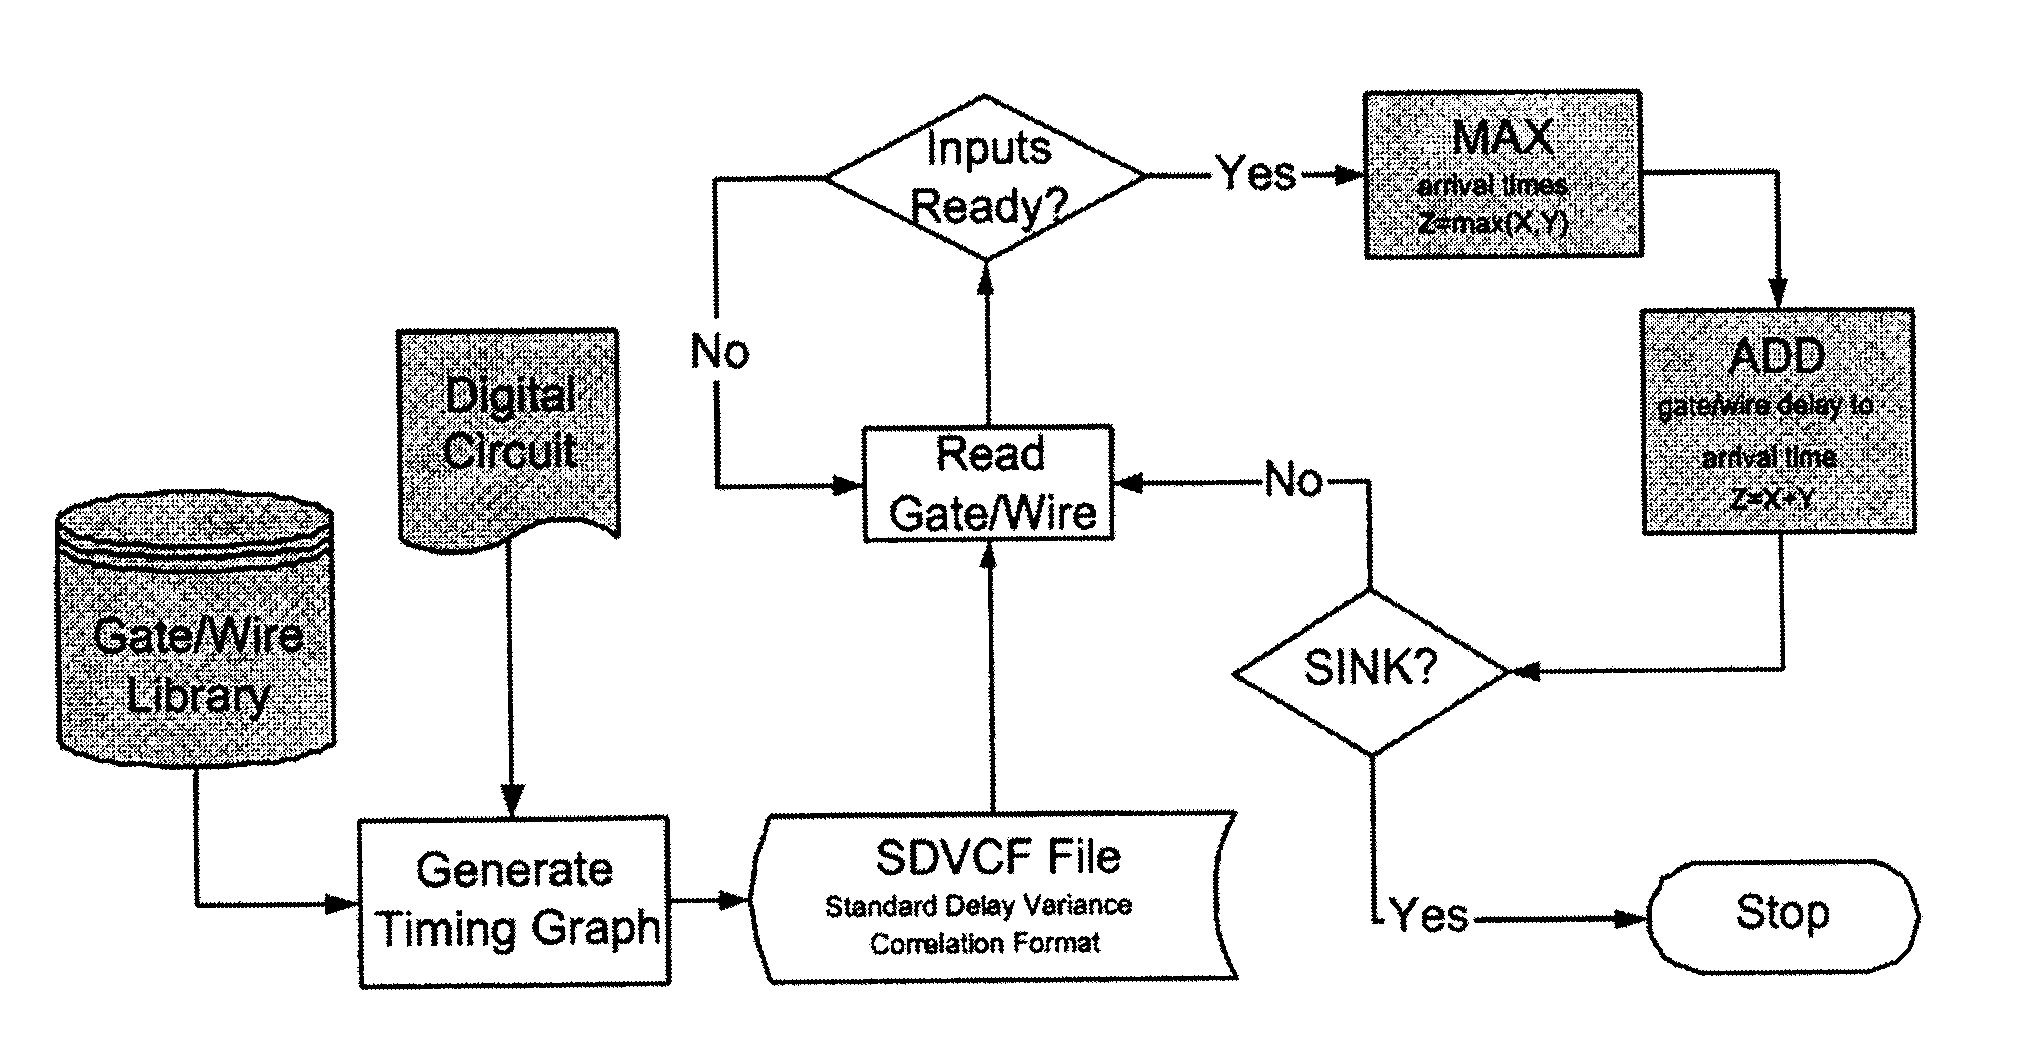
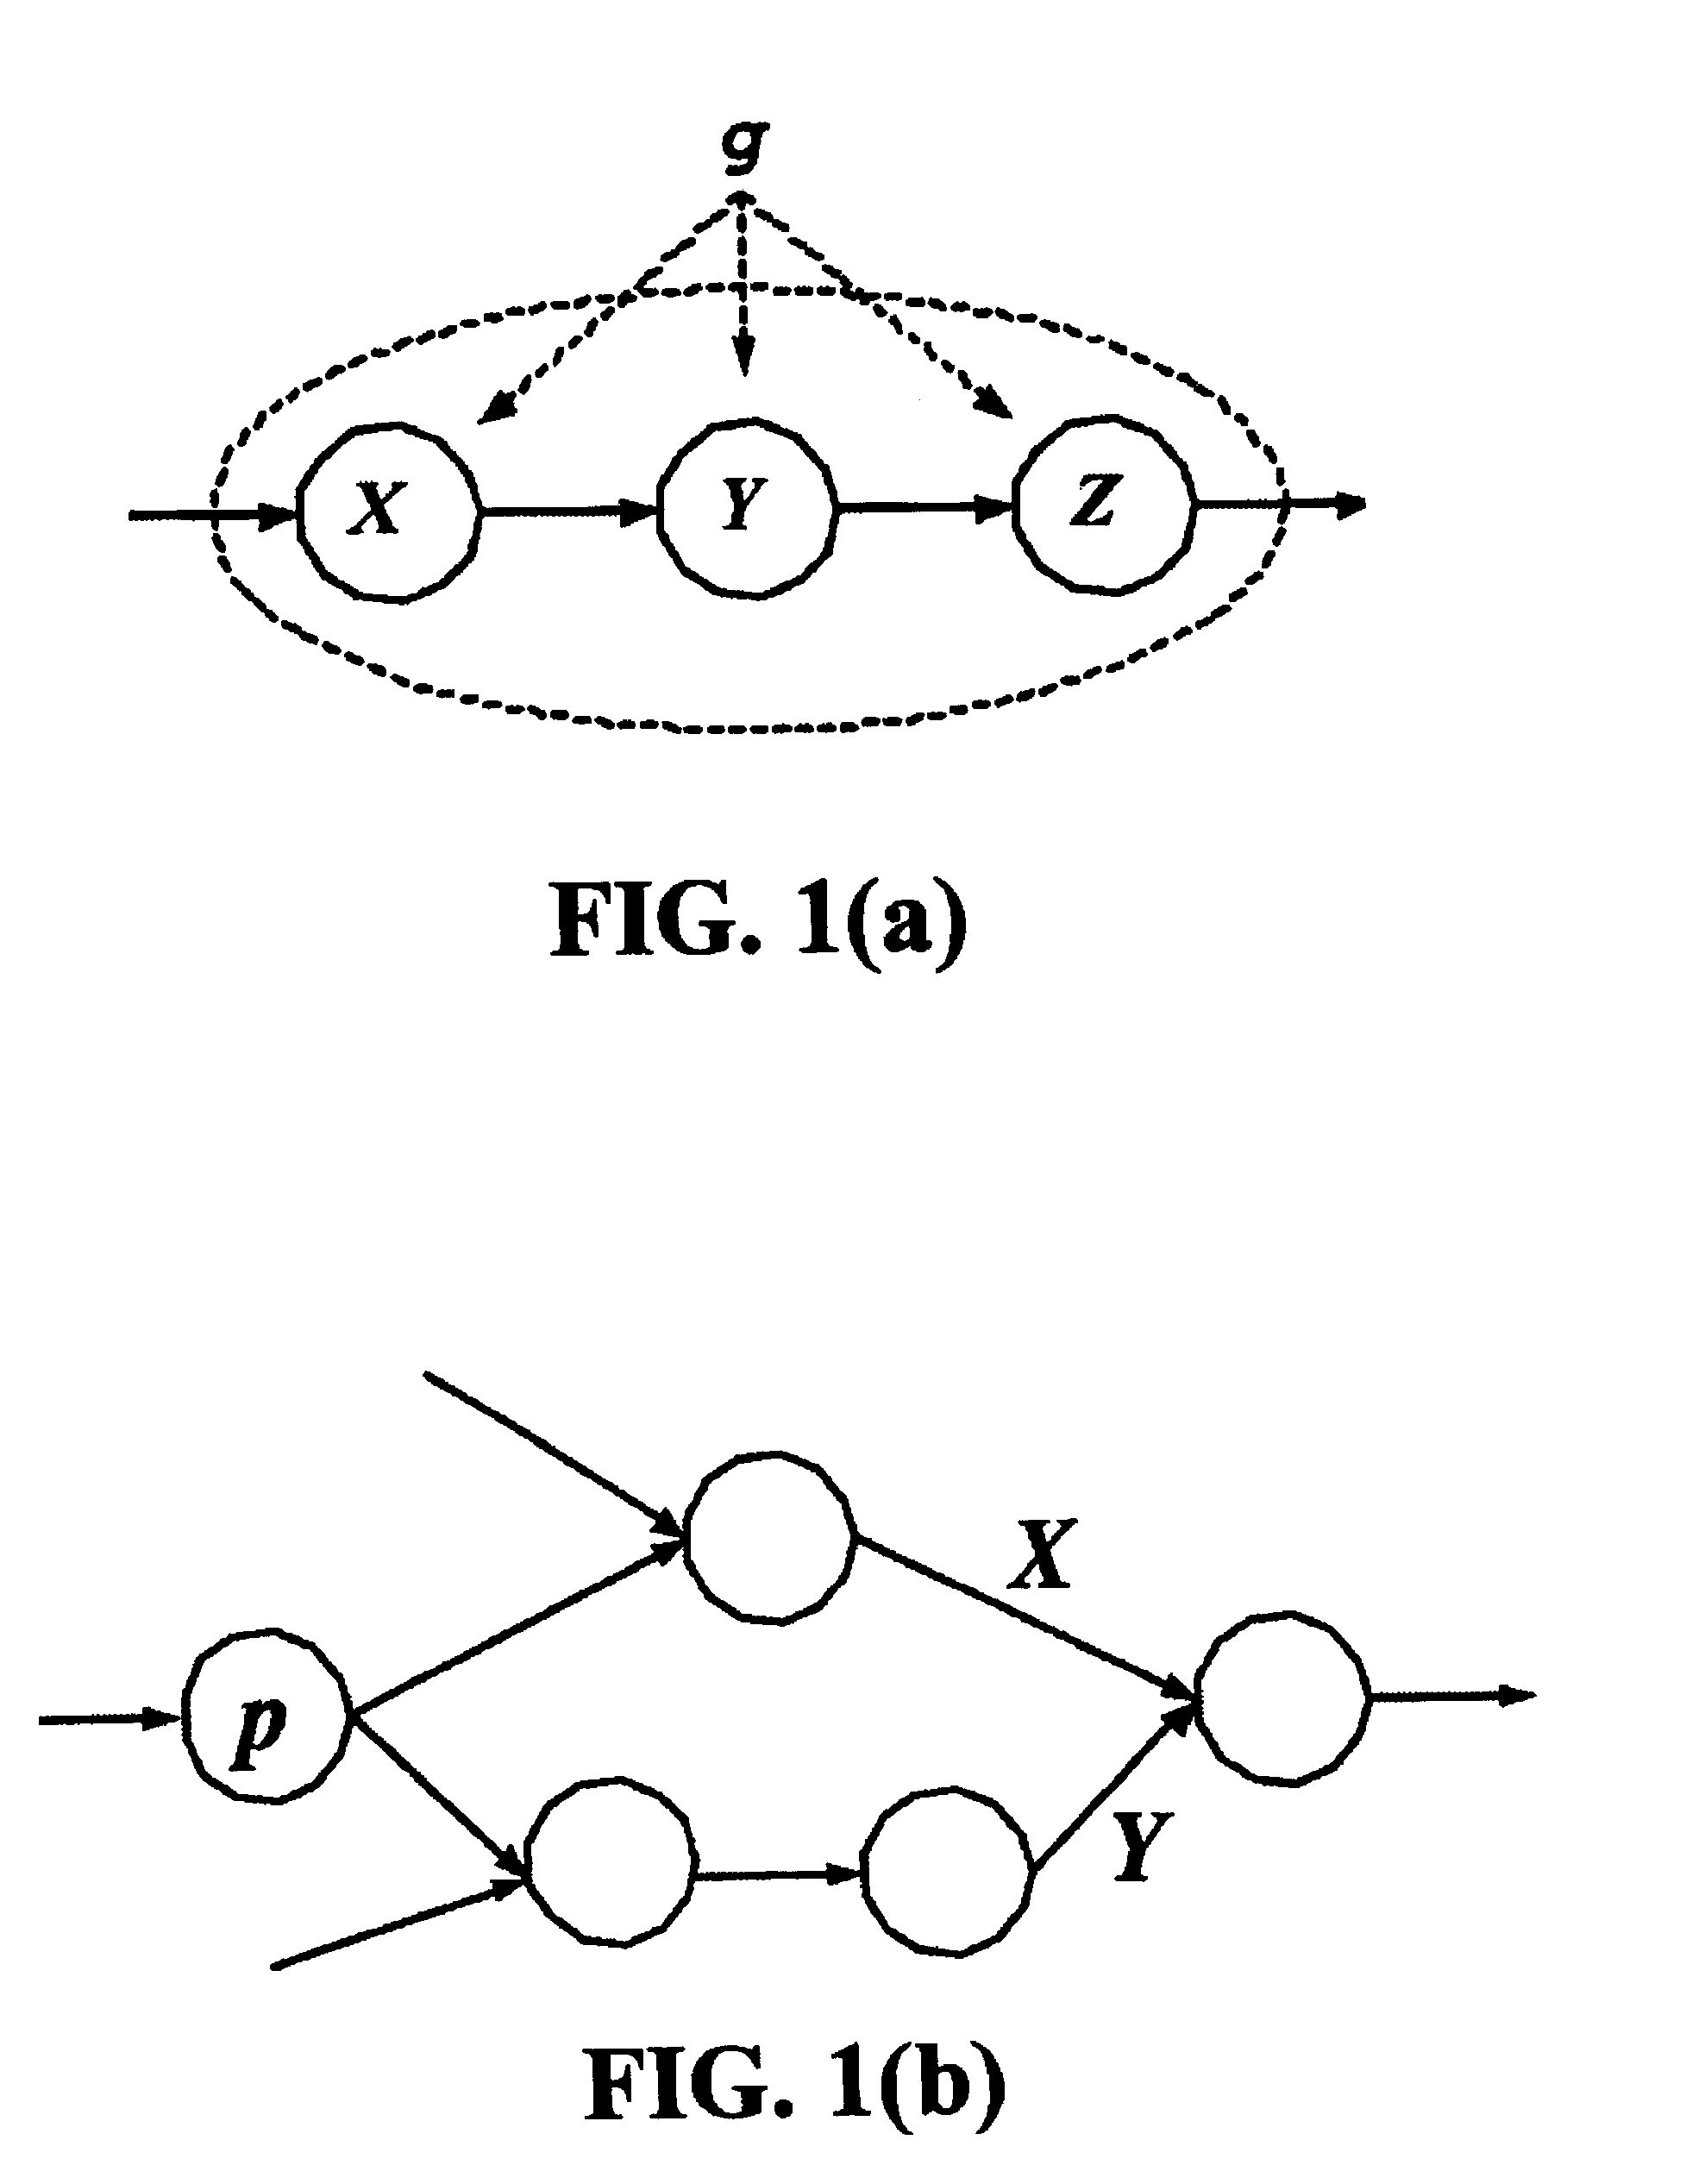
[0043]Section D of this document then discusses the propagation of delays through the chip/circuit, the use of the ADD and MAX operations to effect such propagation, and the use of a convenient data structure—referred to as a MAX tuple—to decrease the computational burden of the MAX operation in circumstances where the inputs to the MAX operation cause it to act nonlinearly (since otherwise a linear MAX operation can be approximated with simpler operations, e.g., by a linear approximation). To illustrate, when a signal (which has its own delay) enters an element (which also has its own delay), the delay at the output of the element is simply the sum of the delays; here, the ADD operation can be performed by simply adding the corresponding quadratic coefficients of the delays. Otherwise, when two delays merge at an intersection, the greater of the two delays controls, and the MAX operation can be performed—and here it is convenient to use a computationally simple approximation for the (nonlinear) max operation, e.g., a linear approximation. However, in some cases, depending on the input delays, the output of the MAX operation is not well represented by a linear approximation. Thus, it is preferred that for any inputs to a MAX operation, the gaussianity (linearity) of the MAX operation should be checked, as by checking the skewness of the MAX output for the inputs in question. If the gaussianity meets some predefined threshold value (i.e., if the MAX operation is deemed sufficiently linear), a linear approximation of the MAX operation can be used for sake of computational ease, an...

Problems solved by technology

As examples, variations in manufacturing process parameters (such as variations in interconnect diameter, gate quality, etc.) can cause timing parameters to deviate from their designed value.
In low-power applications, lower supply voltages can cause increased susceptibility to noise and increased timing variations.
Densely integrated elements and non-ideal on-chip power dissipation can cause “hot spots” on a chip, which can also cause excessive timing variations.
However, this approach produces timing predictions that are often too pessimistic and grossly conservative.
While this will generally yield an accurate timing distribution, it is computationally extremely time-consuming, and is therefore often impractical to use.
Unfortunately, path-based STA has a computational complexity that grows exponentially with the circuit size, and thus it too is difficult to practically apply to many modern circuits.
With the two operators ADD and MAX, the computational complexity of block based STA grows linearly (rather than exponentially) with respect to the circuit ...

Method used


Image

  • Efficient statistical timing analysis of circuits
  • Efficient statistical timing analysis of circuits
  • Efficient statistical timing analysis of circuits

Examples


Embodiment Construction

.

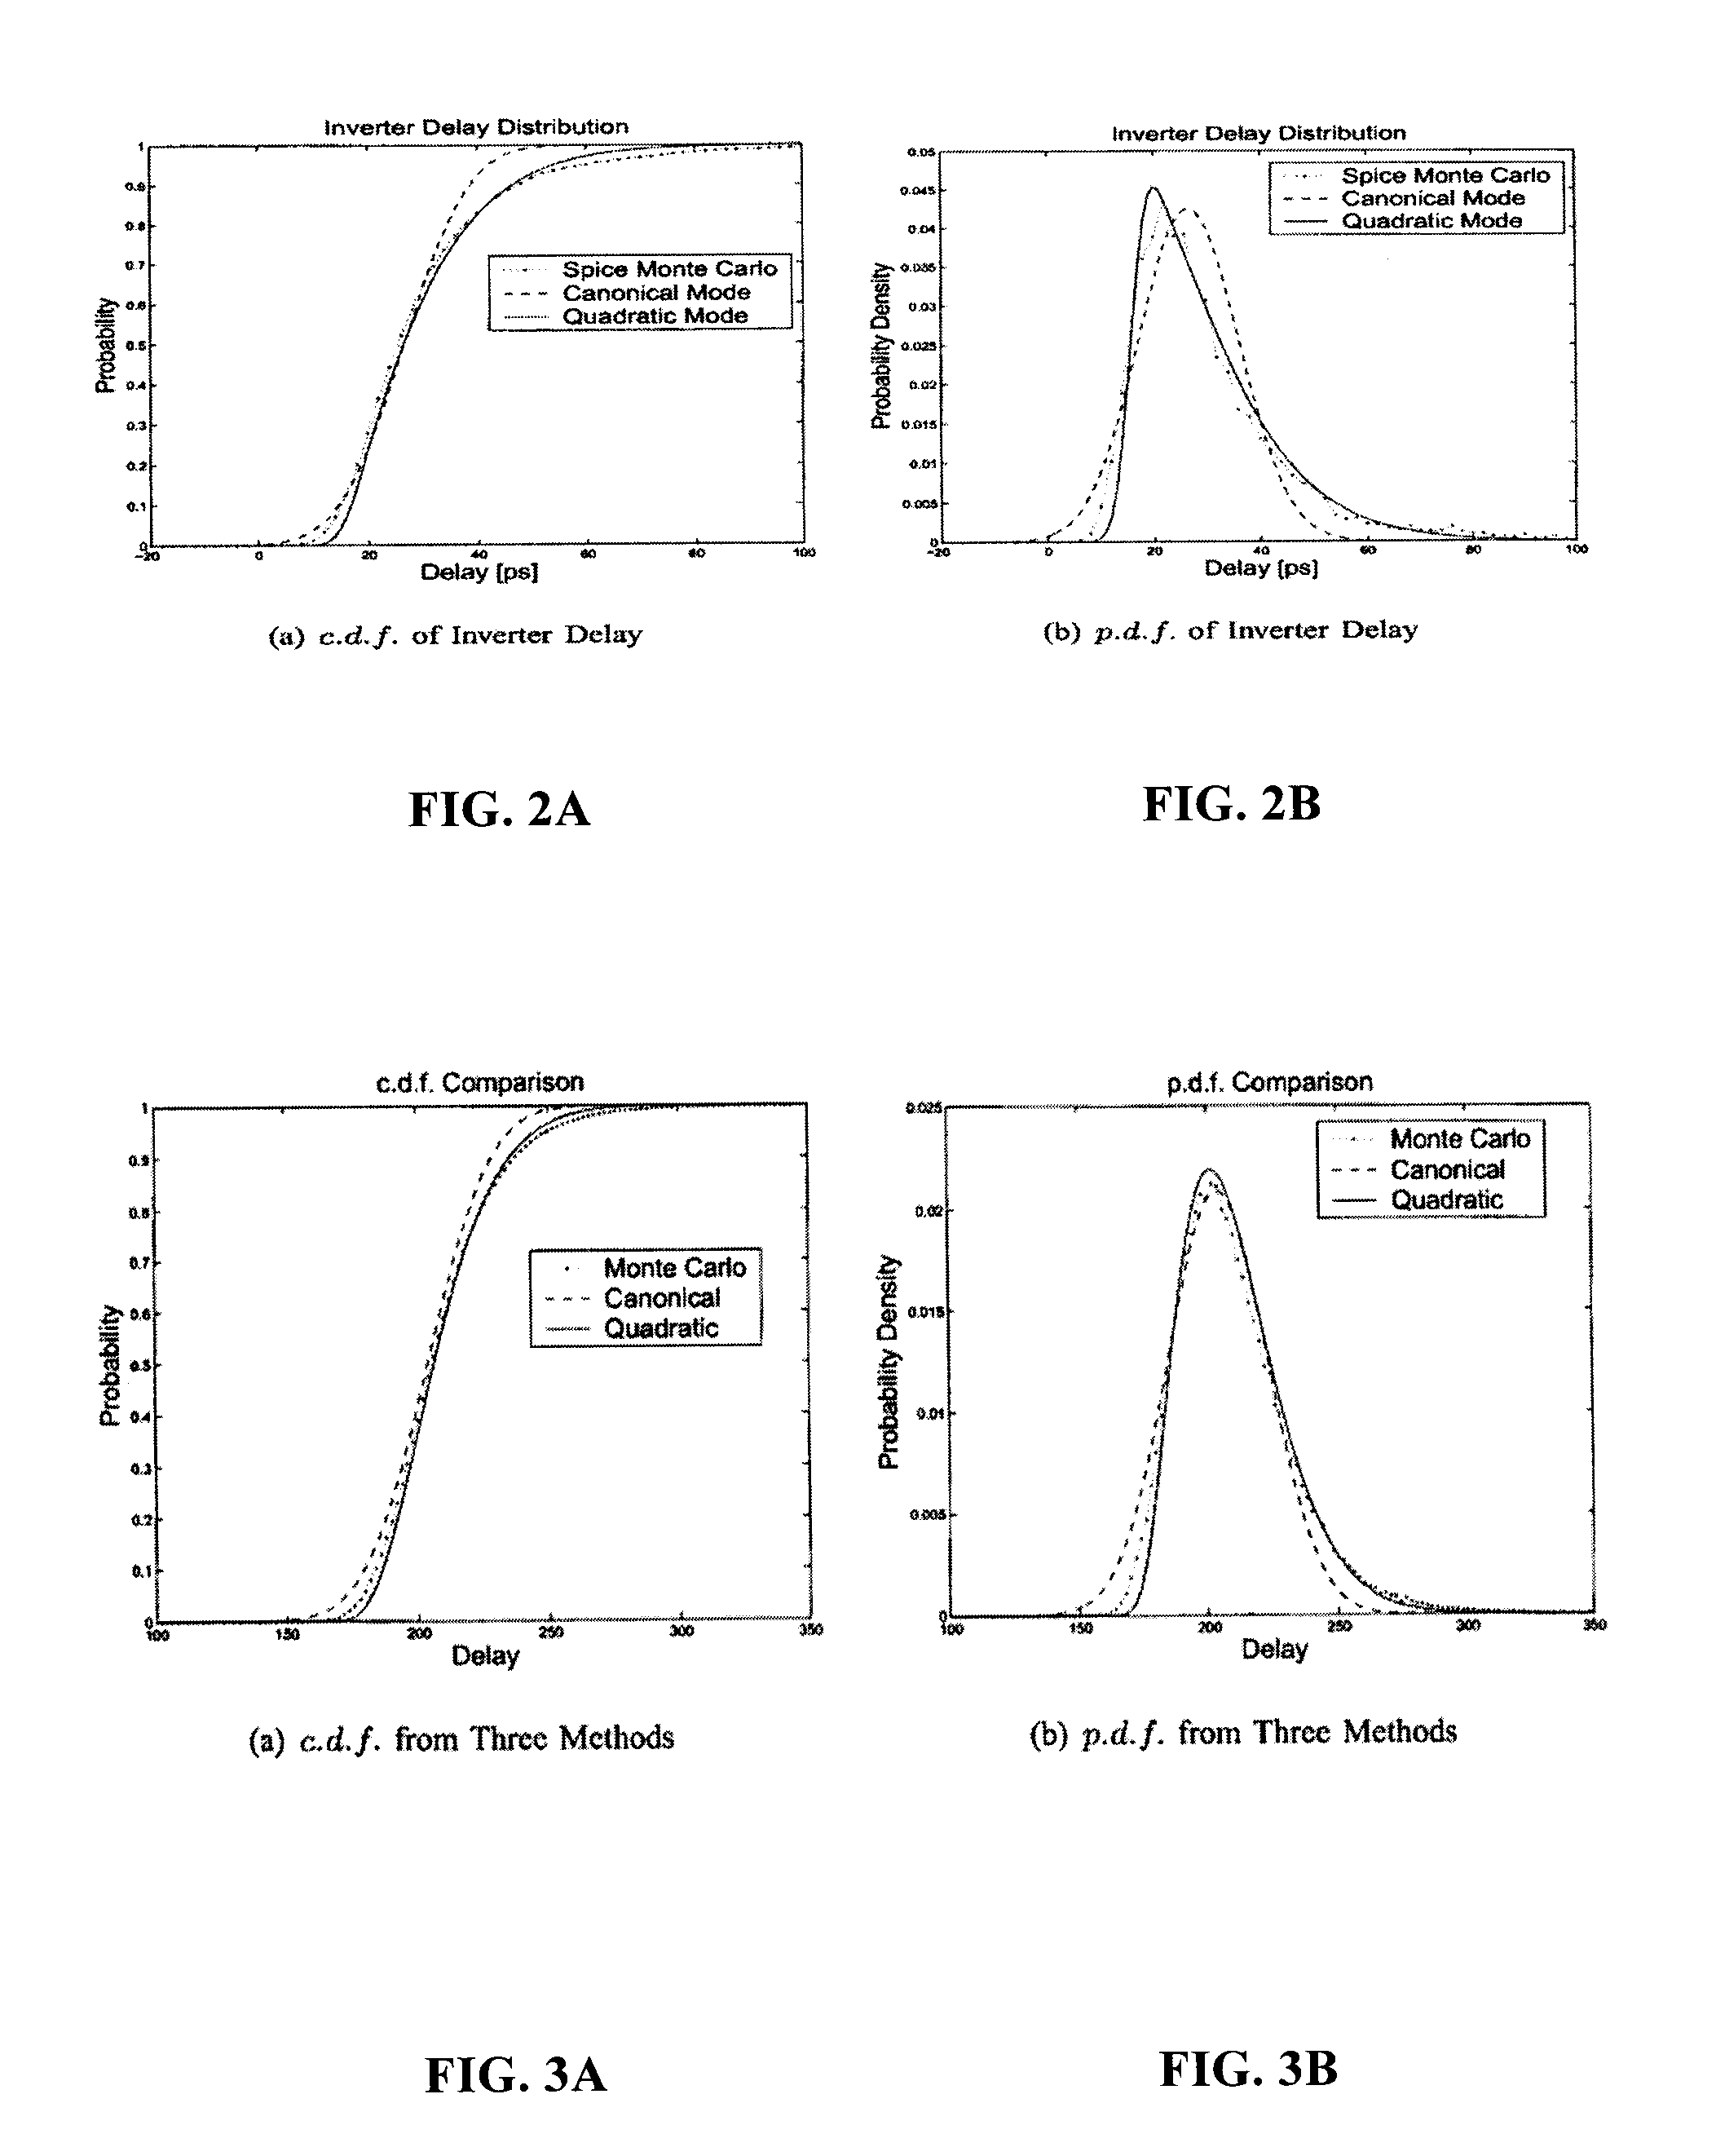
[0027]The following Section A of this document discusses an improved timing model, referred to herein as the quadratic timing model, which can be used to represent all delay elements (both nodes and edges) in a circuit with very high accuracy (approaching that of Monte Carlo simulation). A preferred form for the quadratic timing model represents the signal delay D of each element in a circuit as:

D=μD+∑j=1NαjRj+∑i=1MβiGi+∑i=1M∑k=1MΓi,kGiGk

wherein:[0028]μD is a nominal expected value for signal delay D;[0029]N is the number of signal delays in the circuit;[0030]αj is a weight, referred to as a node sensitivity coefficient, which reflects the dependence of the signal delay D on signal delay j in the circuit;[0031]Rj is a local variation reflecting the uncertainty in the value of signal delay D localized in the signal delay j;[0032]M is the number of global variations in the circuit;[0033]Gi and Gk are global variations reflecting the uncertainty in the value of signal delay D, with su...


PUM


Abstract

Statistical timing analysis methods for circuits are described which compensate for circuit elements having correlated timing delays with a high degree of computational efficiency. An quadratic timing model is used to represent each delay element along a circuit path, wherein each element's delay has a first-order relationship to local variations and a second-order relationship to global variations. Propagation of the modeled delays through the circuit is efficiently done via straightforward ADD operations where an input propagates through another element in a circuit path, and via a MAX operation (or an approximation thereof) where two or more inputs merge at an intersection. The inputs to the MAX operator can be tested for gaussianity, and can be processed by the MAX operation (or its approximation) if they are substantially gaussian. Otherwise, they may be stored in a tuple for processing at later points along the circuit path.

Description

STATEMENT REGARDING FEDERALLY SPONSORED RESEARCH[0001]This invention was made with United States government support awarded by the following agencies:[0002]National Science Foundation (NSF) Grant No(s).: 0093309The United States has certain rights in this invention.FIELD OF THE INVENTION[0003]This document concerns an invention relating generally to statistical timing analysis of integrated circuits.BACKGROUND OF THE INVENTION[0004]For integrated circuits (e.g., VLSI chips) to work properly, the signals traveling along their gates and interconnects must be properly timed, and several factors are known to cause timing variations. As examples, variations in manufacturing process parameters (such as variations in interconnect diameter, gate quality, etc.) can cause timing parameters to deviate from their designed value. In low-power applications, lower supply voltages can cause increased susceptibility to noise and increased timing variations. Densely integrated elements and non-ideal ...

Claims


Application Information

Patent Timeline
IPC IPC(8): G06F17/50
CPCG06F17/5031G06F2217/84G06F2217/10G06F17/504G06F30/3312G06F2111/08G06F30/3323G06F2119/12
Inventor ZHANG, LIZHENGHU, YUHENCHEN, CHUN-PING
Owner WISCONSIN ALUMNI RES FOUND
Why Eureka
Try Eureka