Method for employing SEC-FTIR data to predict mechanical properties of polyethylene

Inactive Publication Date: 2007-12-27
CHEVRON PHILLIPS CHEMICAL CO LP
View PDF11 Cites 40 Cited by
  • Summary
  • Abstract
  • Description
  • Claims
  • Application Information

AI Technical Summary

Benefits of technology

[0005]a) providing at least two polymer training samples, each training sample having a MWD profile, a SCBD, and a known value of the respective physical or chemical property;
[0009](3) the number of short chain branches per 1000 carbon atoms at the respective molecular weight;
[0010]c) plotting each weighted cross term versus the logarithm of the respective molecular weight for each of the at least two polymer training samples and the at least one polymer test sample;
[0084]Composite resin density likewise can be determined by any means known to one of ordinary skill in the art. Analytical techniques include, but are not limited to, refractive index or molded density per ASTM D 1238. The composite resin density is the density of the polymer as a whole, across all molecular weights.
[0085

Problems solved by technology

This procedure is cumbersome not only due to the time required for fabricating the article or test specimen, but also the time required to perform the respective analytical test procedure.
Further

Method used


Image

  • Method for employing SEC-FTIR data to predict mechanical properties of polyethylene
  • Method for employing SEC-FTIR data to predict mechanical properties of polyethylene
  • Method for employing SEC-FTIR data to predict mechanical properties of polyethylene

Examples


Example

Example 1

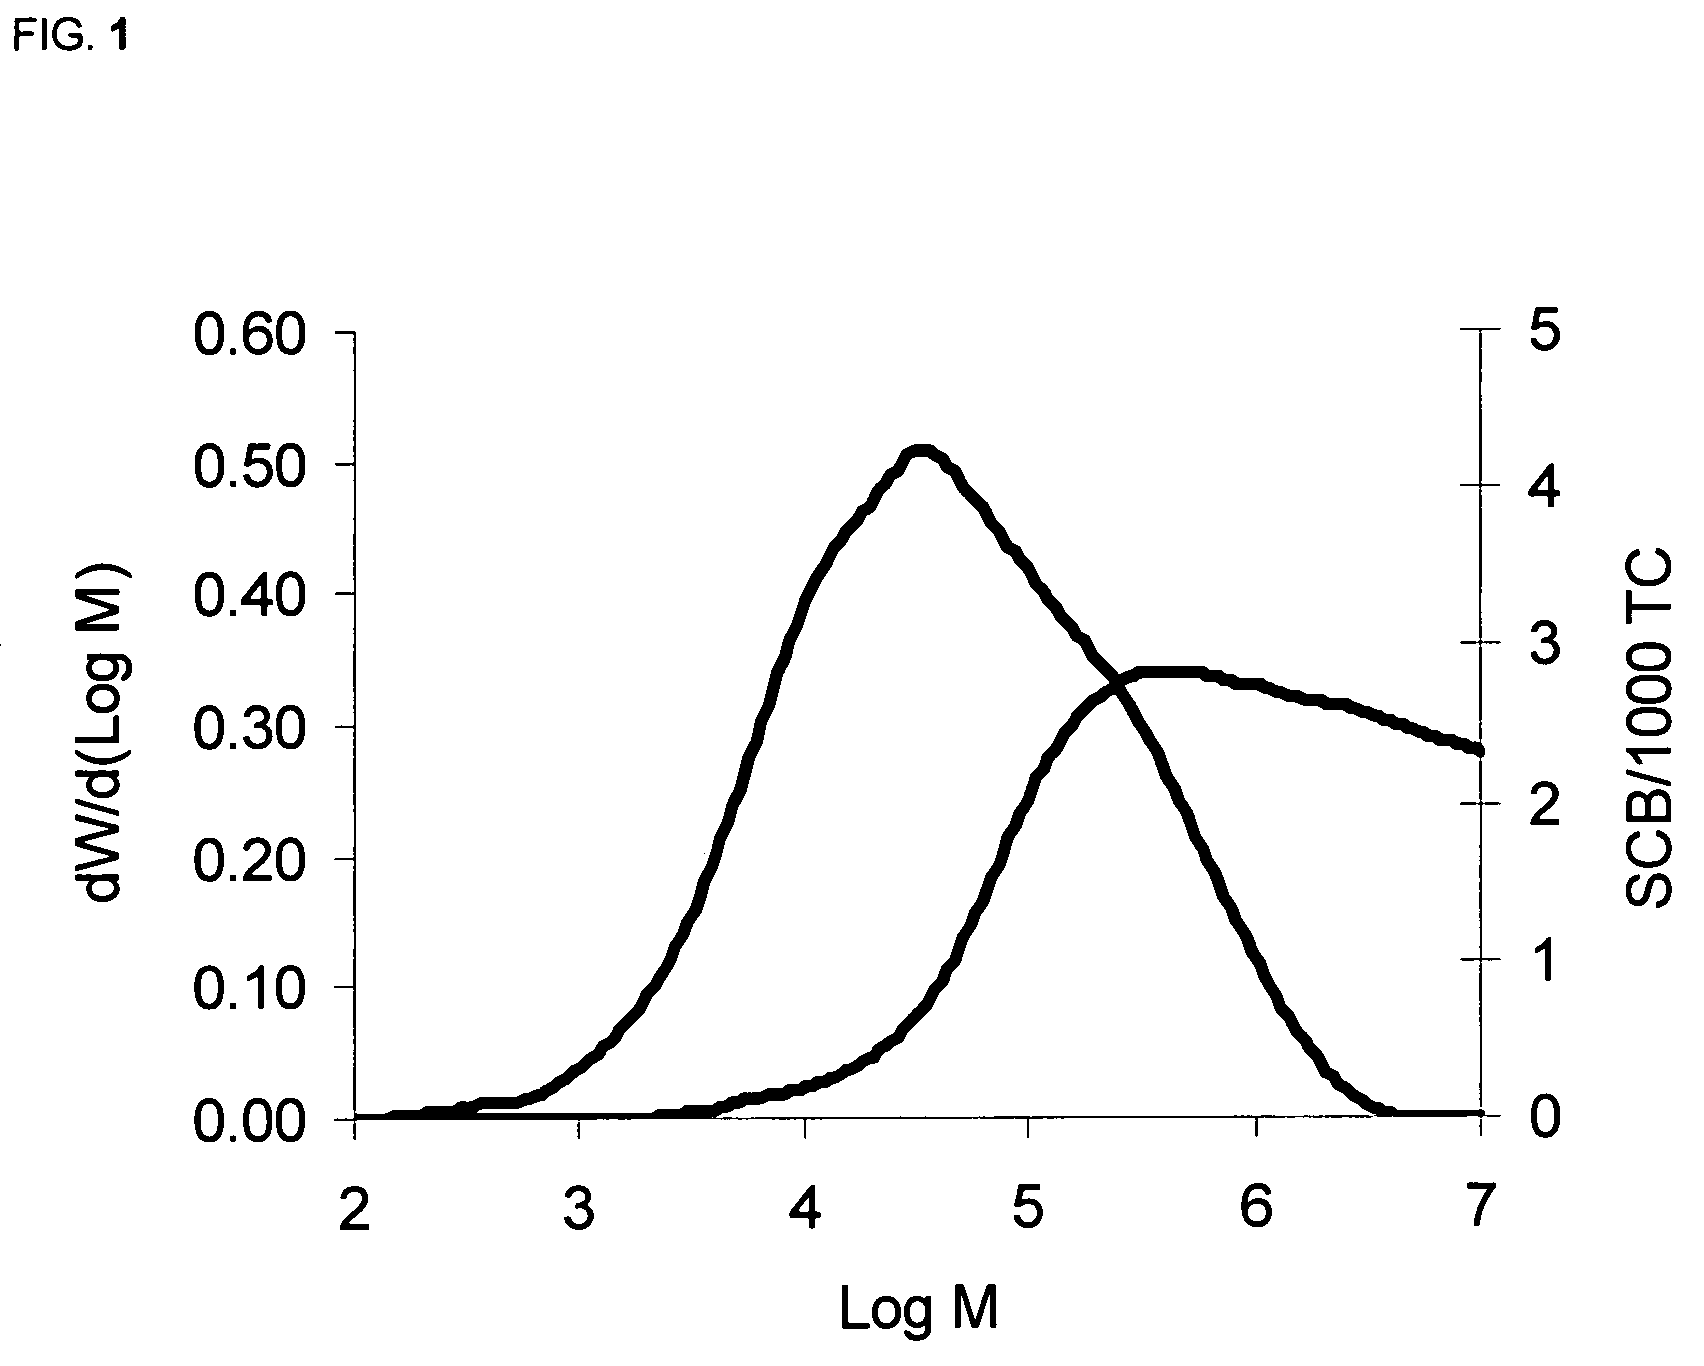
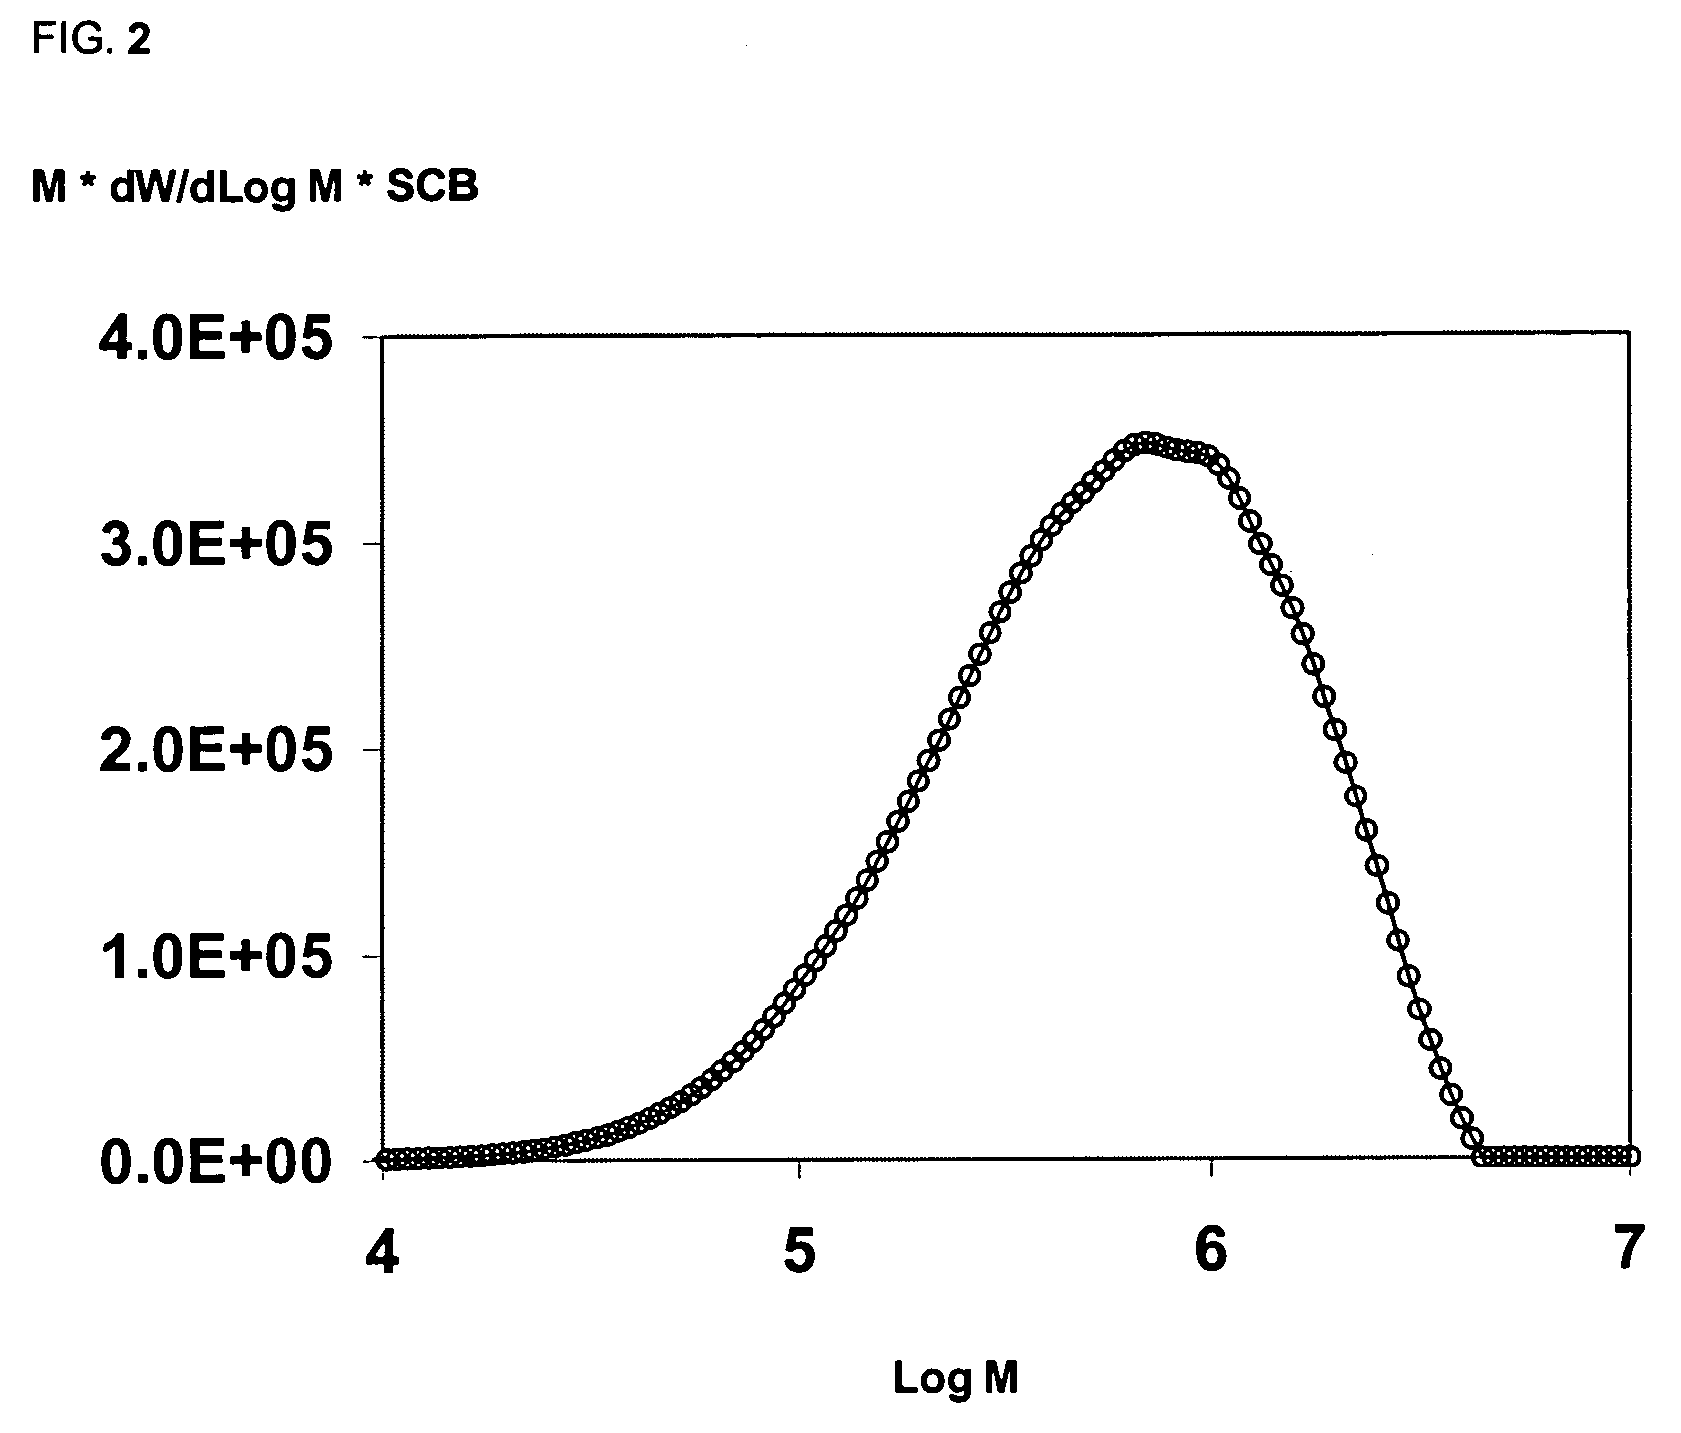
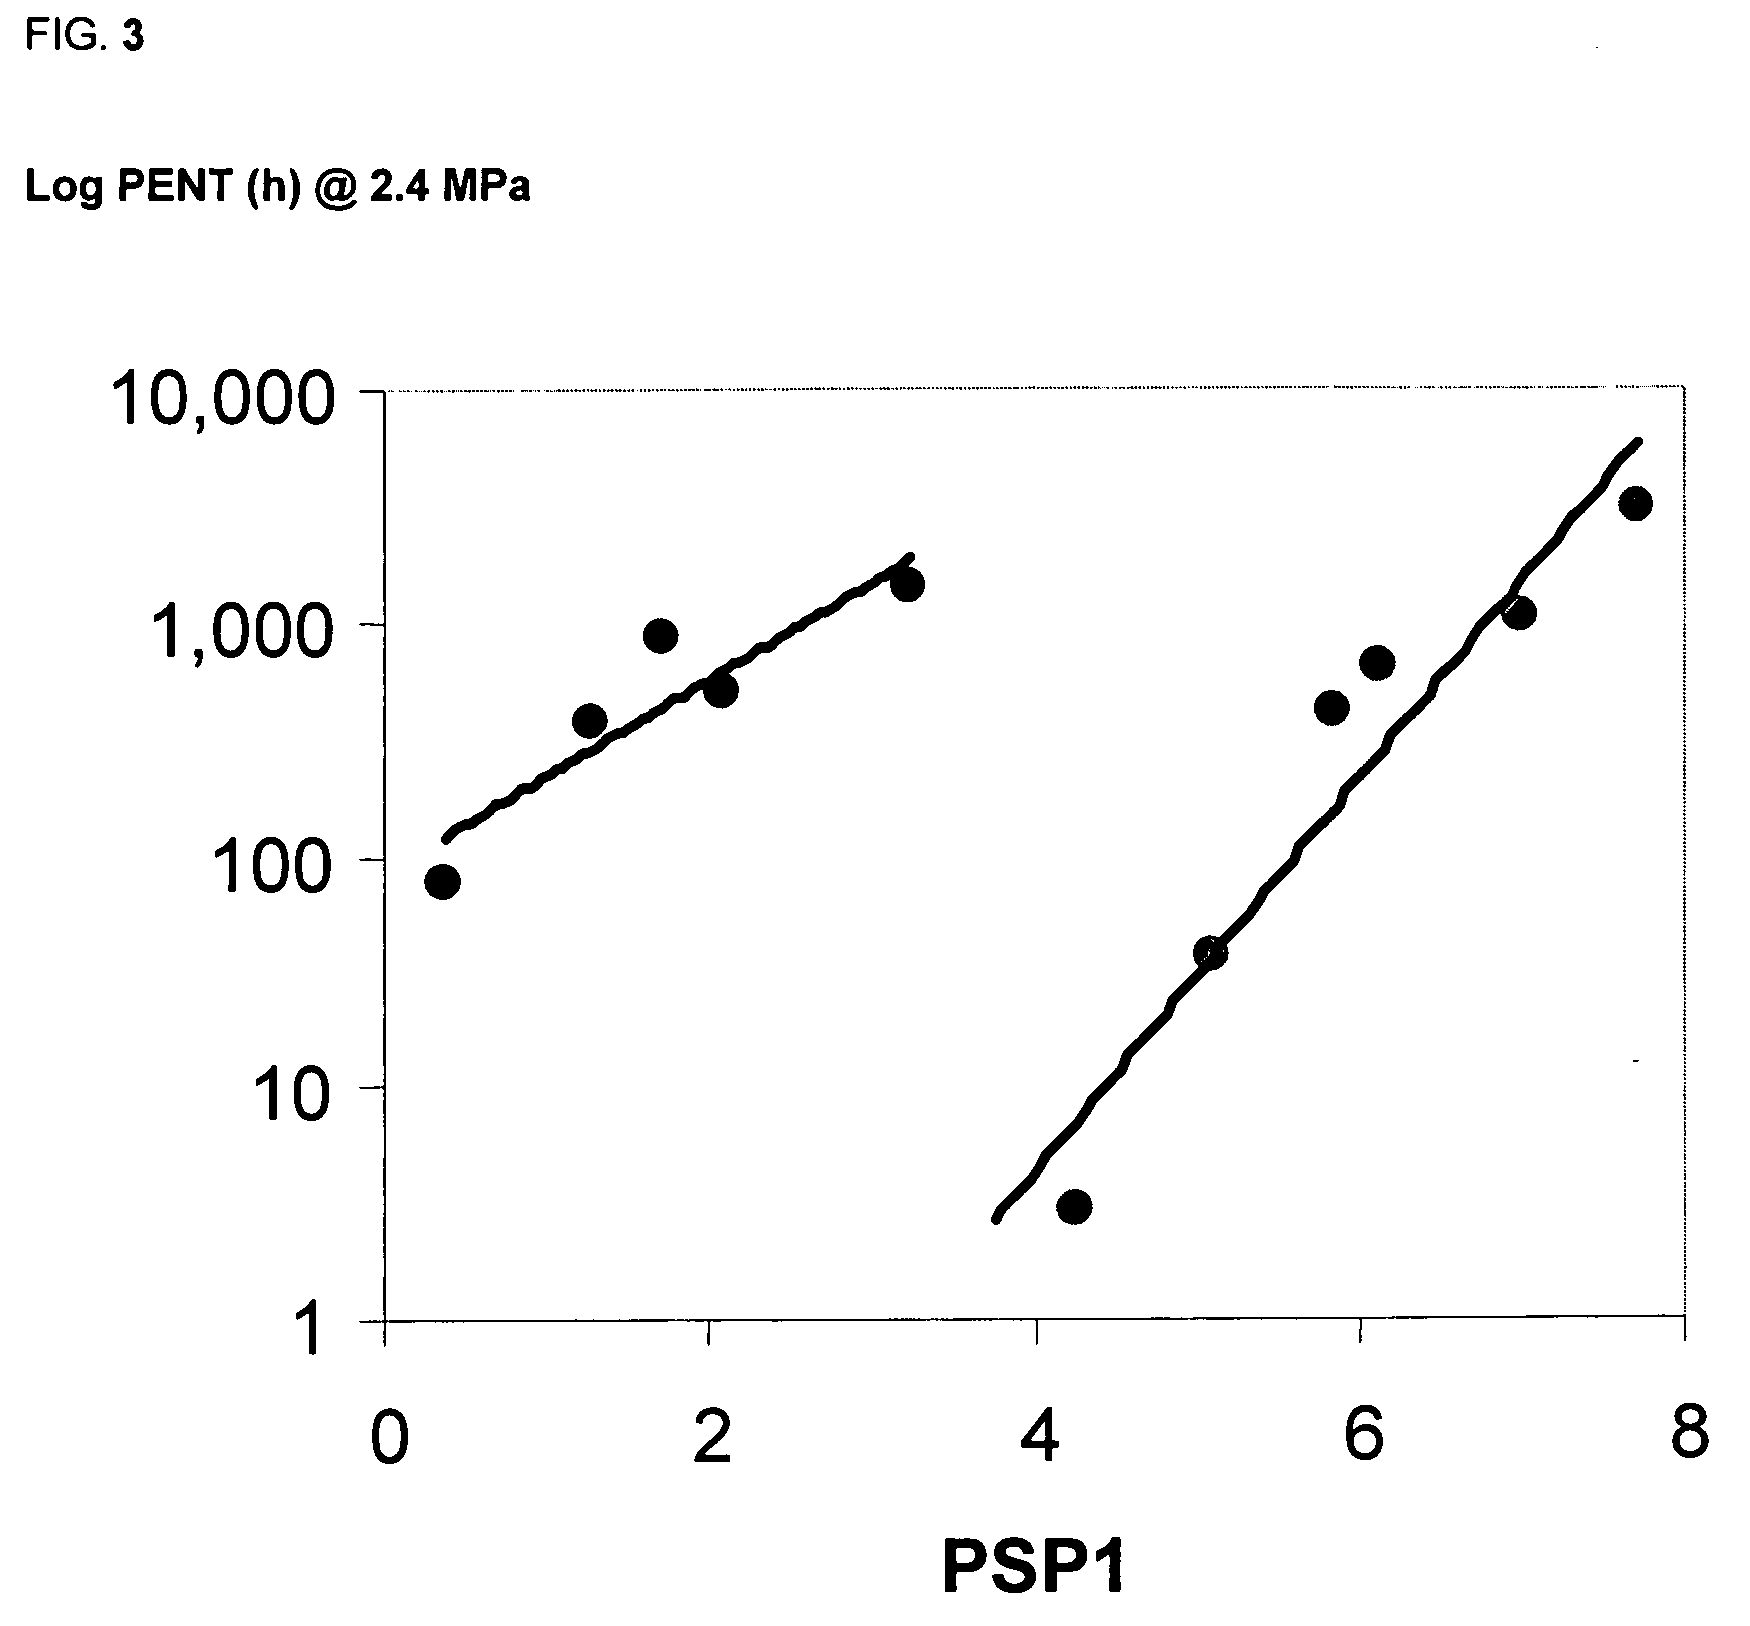
[0161]Table I lists the Mw, composite density, and measured PENT (hours) at 2.4 MPa for seven (7) bimodal polyethylene polymers produced using Ziegler-Natta catalysts. FIGS. 9-15 are the MWD profile and SCBD of these seven polymer training samples. These figures illustrate the measured data and the fitted SCBD using an SEC-FTIR technique, as described in U.S. Pat. No. 6,632,680 and U.S. patent application Ser. No. 10 / 463,849. Due to the low weight fraction at very high molecular weights, it is often difficult to accurately measure the SCB's at these respective molecular weights. Application of the methodology discussed earlier relative to the weighted cross terms of these seven training samples resulted in the curves illustrated in FIG. 16. The areas under the curves in FIG. 16 decrease from polyethylene polymer resin BM-1 to BM-7. FIG. 17 illustrates that a strong linear correlation exists between the Log PENT value and PSP1 for these polymers. Since an exact PENT value wa...

Example

Example 2

[0162]Five (5) unimodal polyethylene polymers were produced using a chromium-based catalyst. These polymers had composite densities in the range of about 0.948 to about 0.950 and Mw in the range of about 260 to about 320 kg / mol. The PENT value at 2.4 MPa, the MWD profile, and the SCBD of these five polymer training samples were also provided. Although the MWD profile and SCBD data are not shown, this information is exemplified in FIGS. 9-15 related to Example 1. Application of the methodology discussed earlier relative to the weighted cross terms of these five training samples resulted in the curves illustrated in FIG. 18. FIG. 19 illustrates that a strong linear correlation exists between the Log PENT value and PSP1 for these polymers. Thus, the PENT value of a test sample from the same polymer family could be determined by applying the correlation in FIG. 19 to the PSP1 value of the test sample.

Example

[0163]Example 3 uses the same bimodal polyethylene polymers discussed in Example 1. Table II lists a specific molecular weight, the weight fraction at that molecular weight, the SCB's at that molecular weight, and the measured PENT (hours) at 2.4 MPa for six (6) bimodal polyethylene polymers. Weighted cross terms were calculated for each of these six training samples, divided by 100,000, and plotted against the measured PENT value. Even with this single point method (i.e., taking data only at one molecular weight, Log M=6.05), FIG. 20 illustrates that a strong linear correlation exists between the Log PENT value and the weighted cross term divided by 100,000. Thus, the PENT value of a test sample from the same bimodal polymer family could be determined by applying the correlation in FIG. 20 to a single weighted cross term of the test sample.


PUM

PropertyMeasurementUnit
Pressureaaaaaaaaaa
Pressureaaaaaaaaaa
Massaaaaaaaaaa

Abstract

The present invention provides several methods of determining values of physical or chemical properties of polymers. In these methods, at least two polymer training samples are provided. Characteristics of the polymer microstructures of the training samples are correlated with values of physical or chemical properties of the training samples. These correlations are subsequently applied to the respective characteristics of polymer test samples in order to determine the values of physical or chemical properties of the test samples.

Description

BACKGROUND OF THE INVENTION[0001]The present invention is directed to methods of determining values of physical or chemical properties of polymers. Traditionally, in order to determine a value of a specific physical or chemical property, a certain quantity of the particular polymer resin was needed to fabricate an article or a test specimen, and then the resulting article or test specimen was subsequently tested via the prescribed analytical test procedure to determine the value of the physical or chemical property. This procedure is cumbersome not only due to the time required for fabricating the article or test specimen, but also the time required to perform the respective analytical test procedure. Further, the traditional method, depending upon the particular test, could require large amounts of polymer, often more than could be produced in small-scale research laboratory or pilot plant apparatus.[0002]Hence, there exists a need for a method of determining a value of a desired c...

Claims


Application Information

Patent Timeline
IPC IPC(8): G01N33/44
CPCC08F10/00C08F2400/02C08L23/04G01N21/3563G01N30/02G01N33/442Y10T436/25G01N2021/3595C08F2/00C08L2666/04B01D15/34
Inventor DESLAURIERS, PAUL J.ROHLFING, DAVID C.
Owner CHEVRON PHILLIPS CHEMICAL CO LP
Why Eureka
Try Eureka