

Method for the Determination of the Concentration of a Non-Volatile Analyte
a non-volatile analyte, concentration technology, applied in the direction of naphthalimide/phthalimide dye, optical radiation measurement, instruments, etc., can solve the problems of unsatisfactory plurality of fluids and other supplies, requiring expensive apparatus, and requiring time-consuming calibrating procedures involving various calibrating media prior to actual measuremen
- Summary
- Abstract
- Description
- Claims
- Application Information
AI Technical Summary
Benefits of technology
Problems solved by technology
Method used
Image

Examples
example 1.1
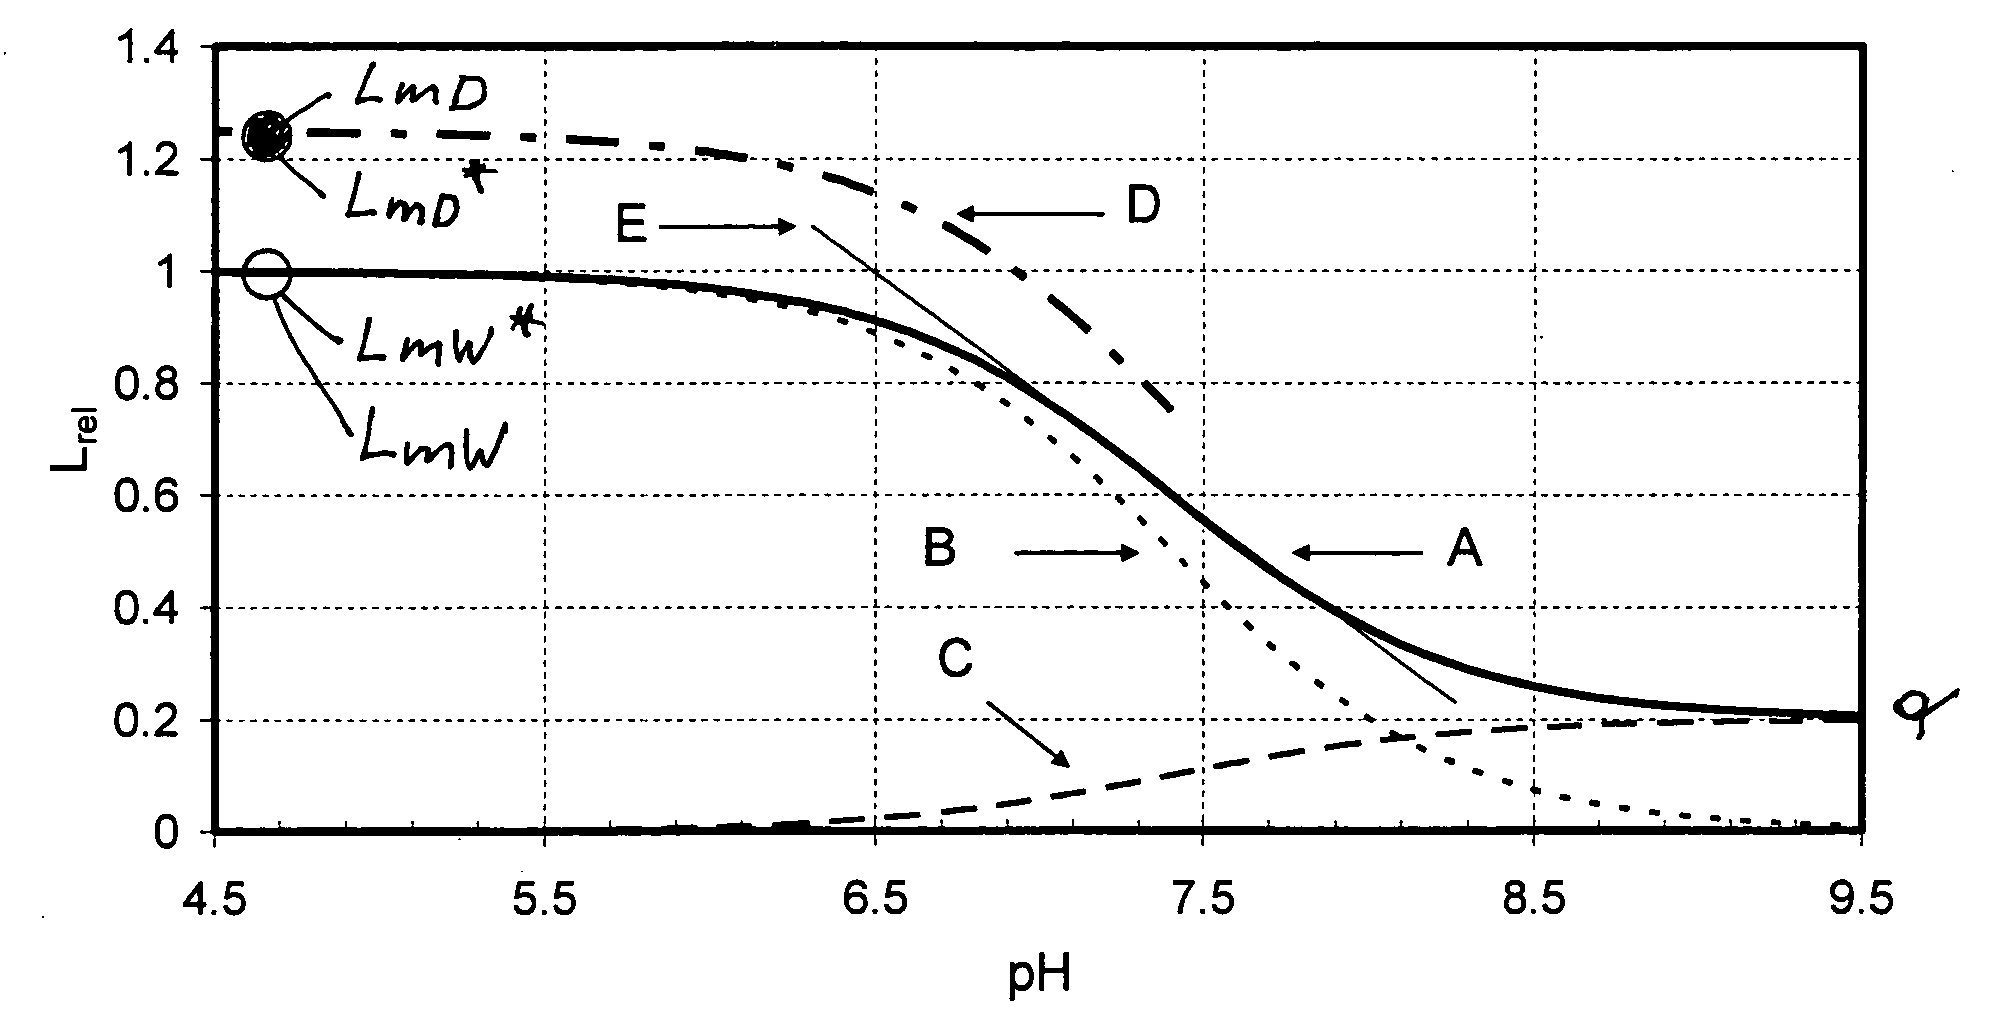
FIG. 1a
[0201]Surprisingly it has been found that for sensors made in the same way and measured with devices of the same type, the ratio
RmD / W=LmD / LmW=LmD* / LmW* (13)
is constant and can be determined by factory-site calibration. Thus the scaling factor LmW may be determined from LmD / RmD / W. At the user site therefore only a single-point-dry-calibration will be necessary for determination of the scaling factor LmW and no calibrating medium will be required. This means that a true dry calibration of a luminescence-optical sensor is obtained at the user site, such that liquid calibration media for single-point-calibration may be altogether dispensed with.
[0202]LmD*, respectively LmD, are the maximum intensity values measured with dry sensors at the factory site, respectively at the user site. These values can be determined if the indicator dye of the sensor is set up in such a way that in the dry state the whole mass of the indicator is present in the form of species B, i.e. the luminesc...
example 1.2
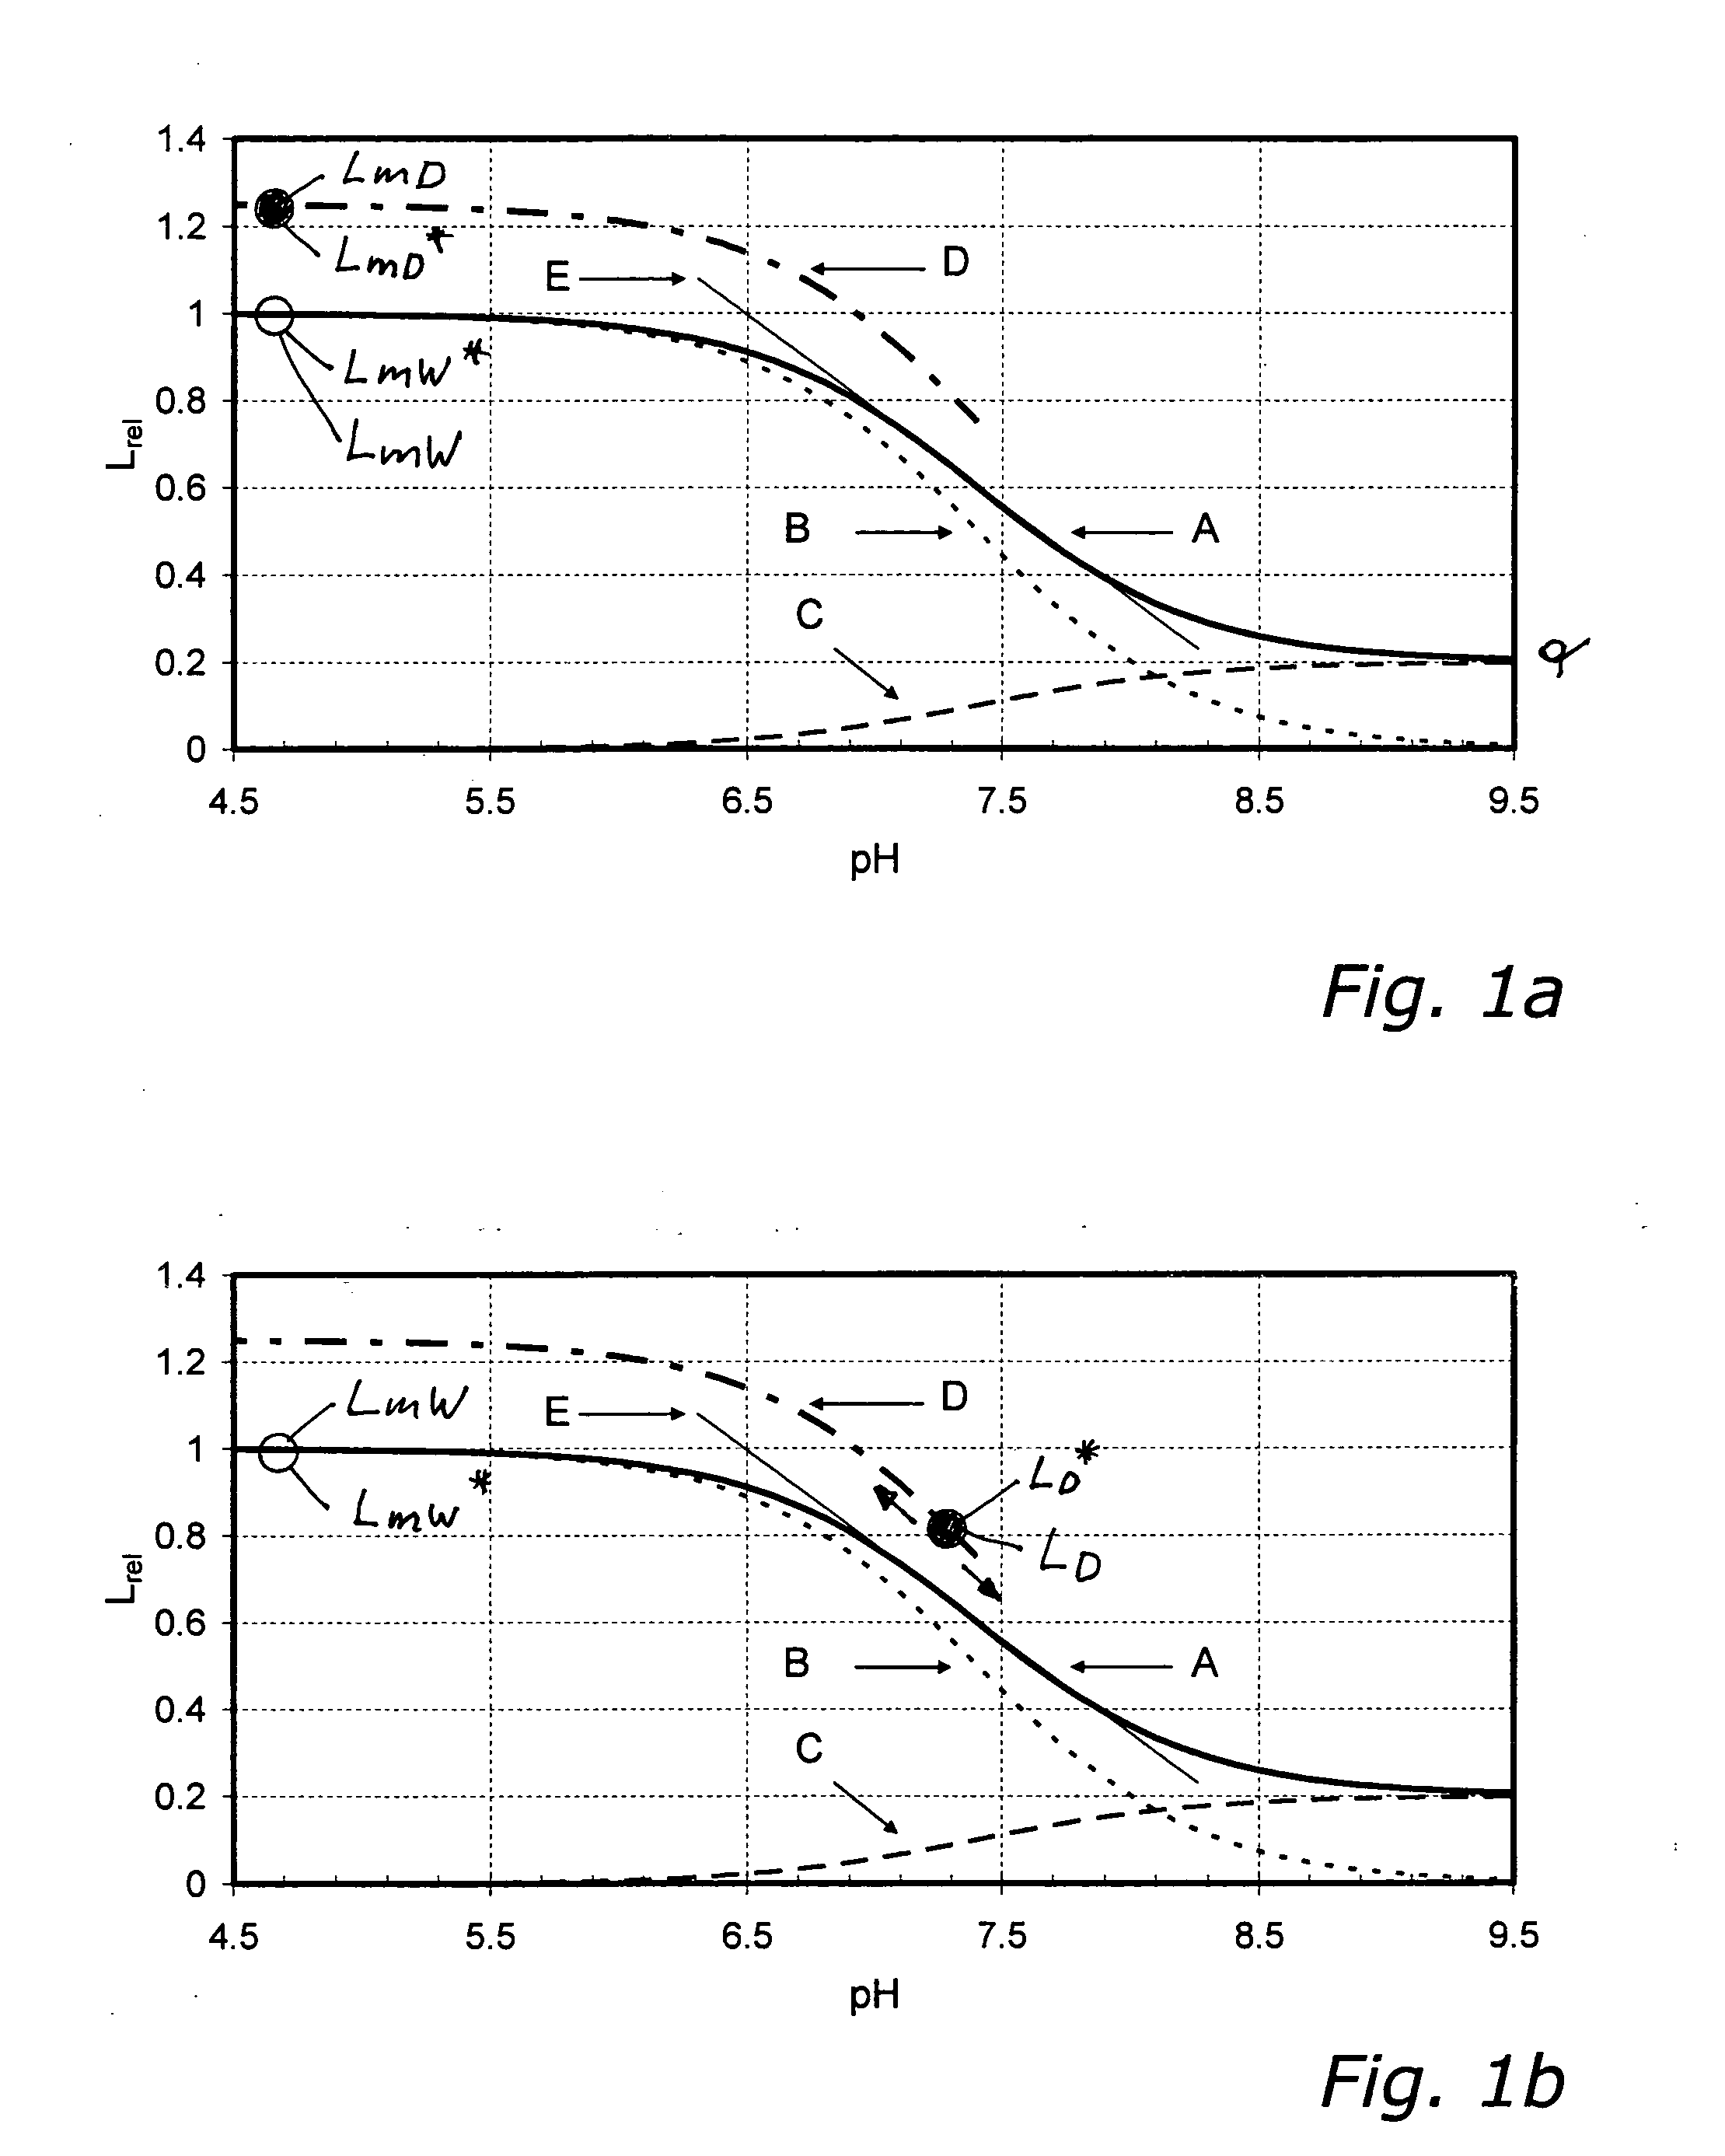
FIG. 1b
[0219]In example 1.1 the ratio V of the concentration of species B—to which the analyte S is bound—to the total concentration D of the indicator is 1. In other words: in the dry state the indicator dye is completely present in the form of species B.
[0220]Typically optical sensors are manufactured in such a way that in the dry state the ratio V=cB / cD has a value between 0.1 and 0.9 and preferably lies between 0.3 and 0.7. For each value of the ratio V there exists a value RD / W which may be used to deduce the maximum wet luminescence intensity LmW from the intensity LD measured in the dry state. If—as illustrated in example 1.1—cA tends to zero, essentially only species B is present and the equality RD / W=RmD / W holds.
[0221]In modification of eqn. 13 one obtains from eqn. 15
RD / W=LD / LmW=LD* / LmW* (15)
a ratio RD / W by which the relative characteristic can be related to the user-site dry calibration value.
[0222]The second subvariant according to the invention (see FIG. 1b) is thus c...
example 1.3
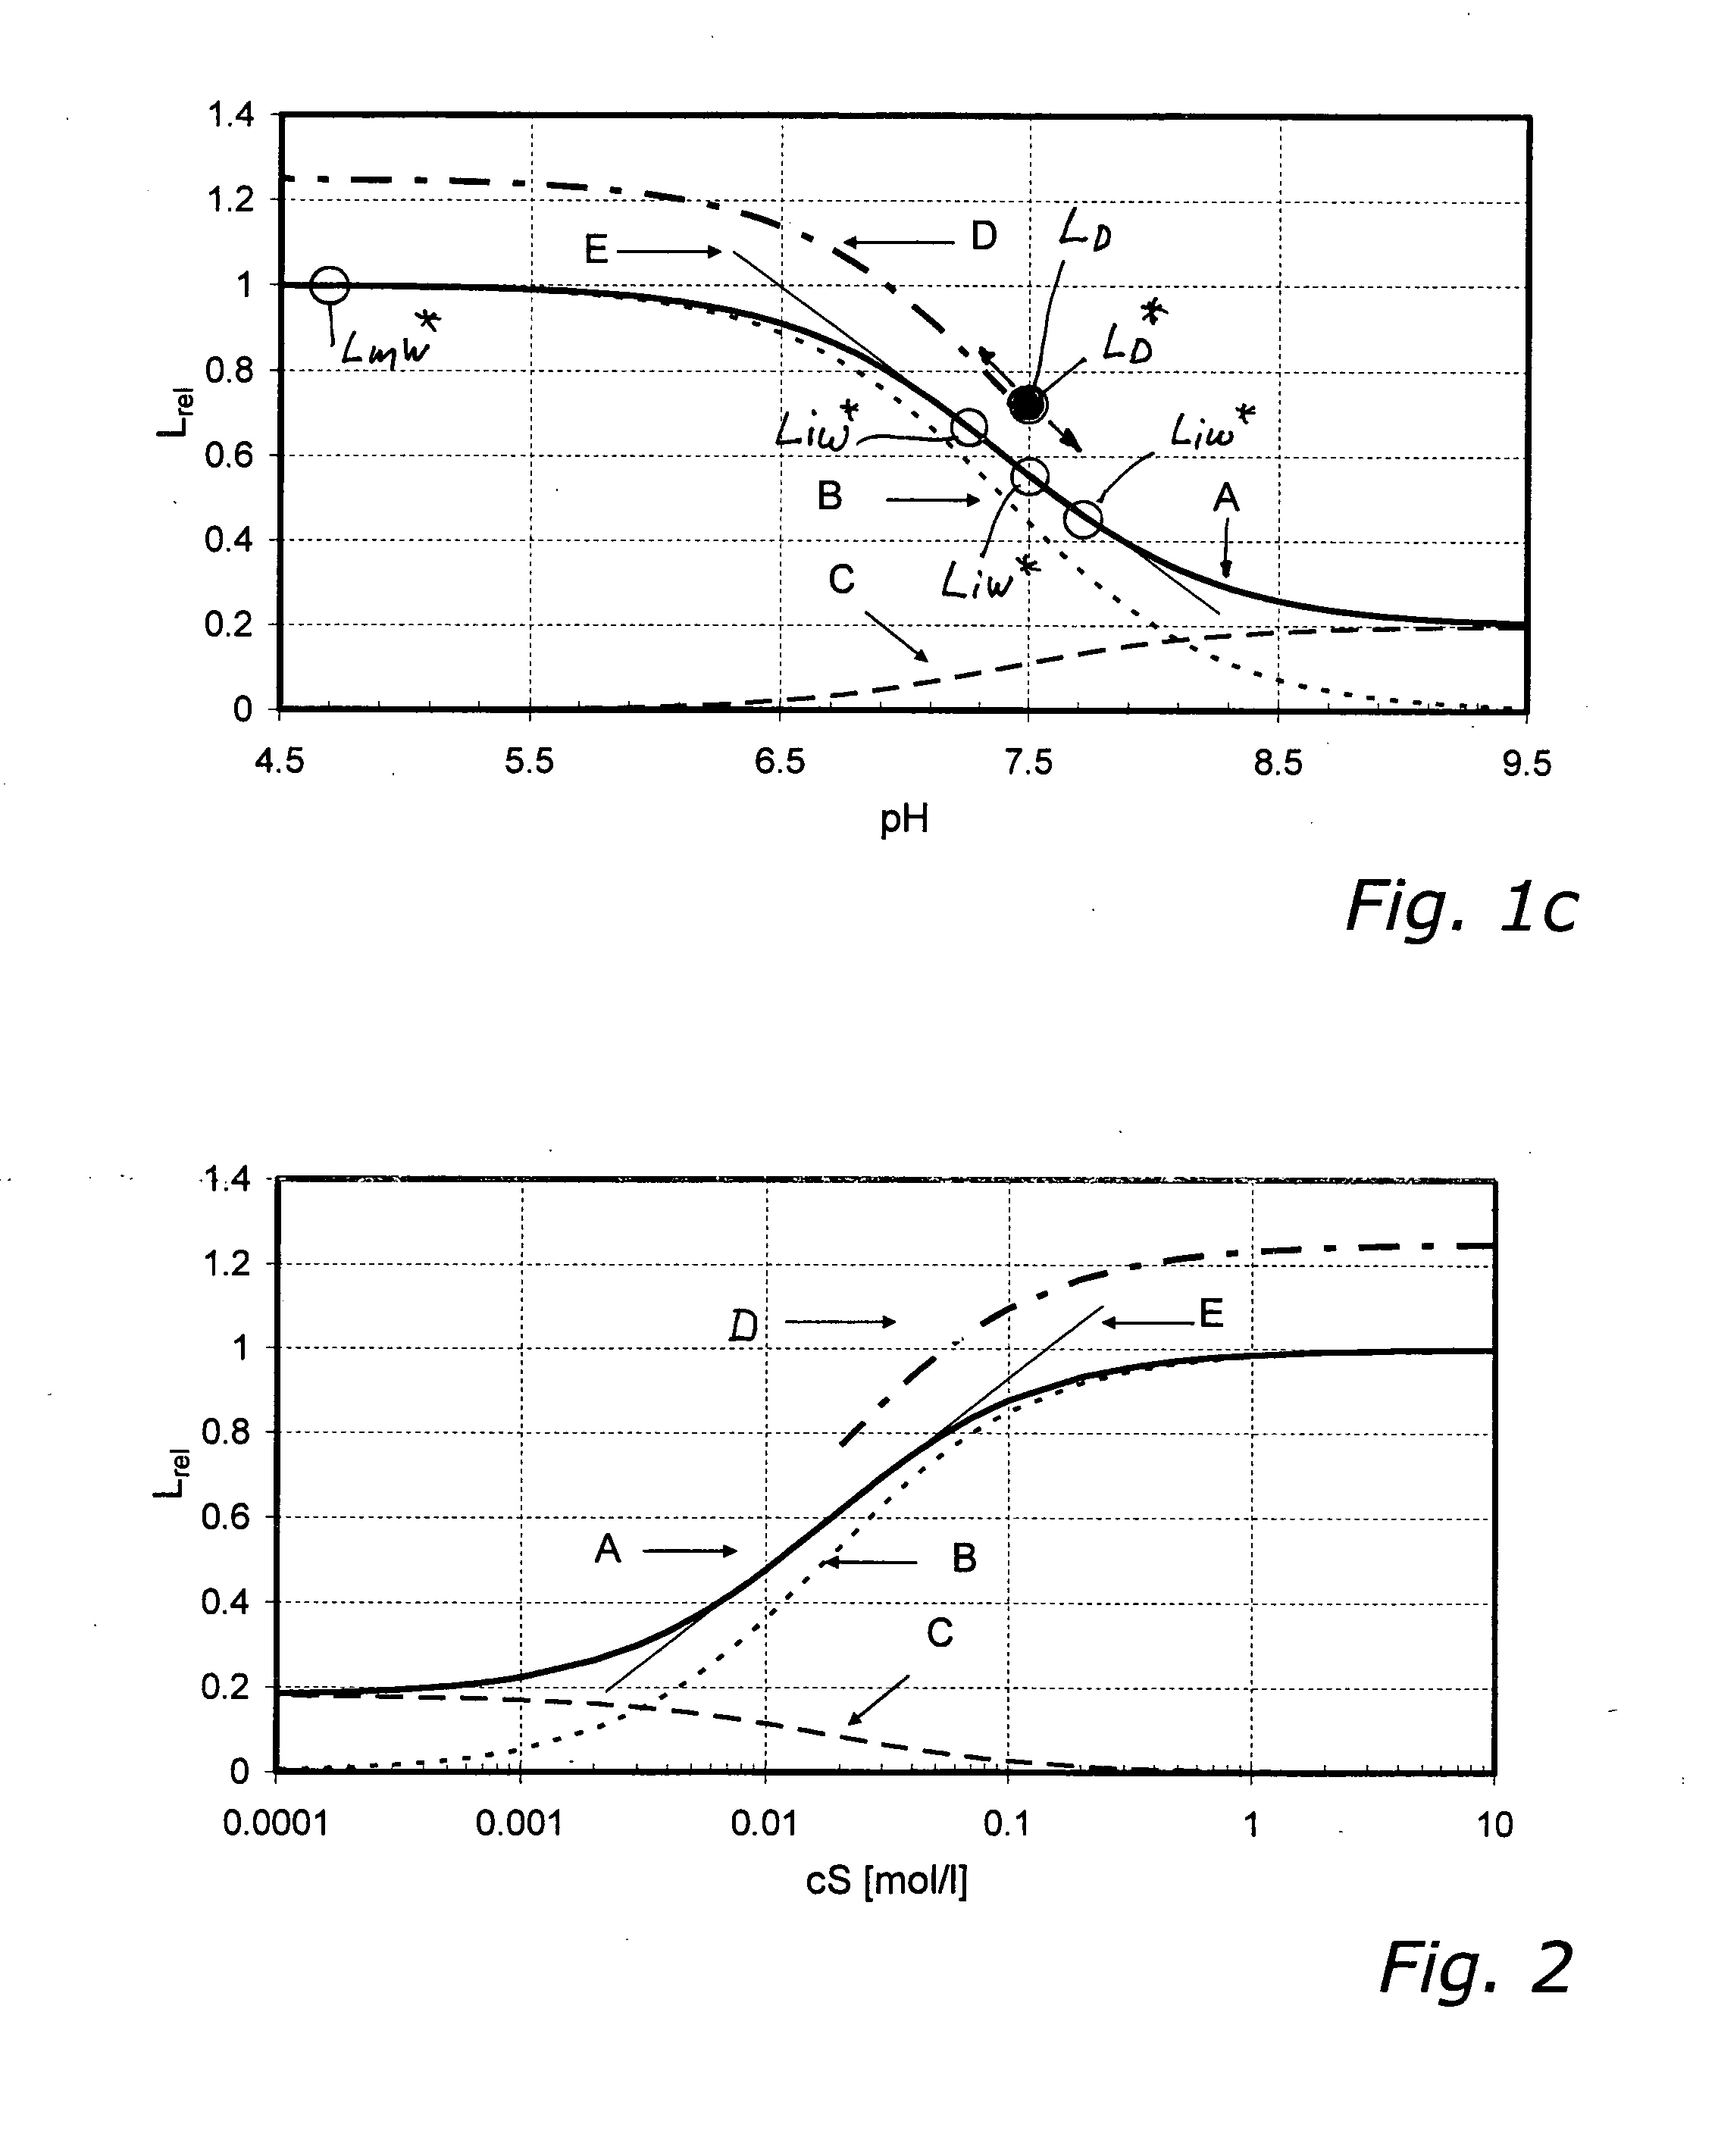
FIG. 1c
[0235]In the examples 1.1 and 1.2 described above, the concentration of the analyte S for measuring the wet factory calibration value LmW* must be chosen such that essentially only species B of the indicator is present.
[0236]In practice it is frequently undesirable and in the case of some sensors or analytes outright disadvantageous or impossible, to set the analyte concentration in a calibrating medium in such a way that after wet-up and equilibration (eqn. 1 or 2) essentially only species B is present, permitting direct measurement of LmW* (see above under a.iii). The reason for this is that—in order to shift equilibrium completely to the left in eqn. 1—very high analyte concentrations (>1 mol / l) would have to be achieved in some cases.
[0237]A Na+ sensor for measuring physiological Na+ concentrations ideally has a Kd value of roughly 0.150 mol / l, for instance. To shift the equilibrium (in eqn. 1 and 2) to the left side, such that essentially only species B is present, the ...
PUM
| Property | Measurement | Unit |
|---|---|---|
| concentration | aaaaa | aaaaa |
| luminescence | aaaaa | aaaaa |
| luminescence measurement | aaaaa | aaaaa |
Abstract
Description
Claims
Application Information