
Indicators For A Spectrophotometric System

Active Publication Date: 2008-12-04
EDWARDS LIFESCIENCES CORP
View PDF13 Cites 32 Cited by
  • Summary
  • Abstract
  • Description
  • Claims
  • Application Information

AI Technical Summary

Benefits of technology

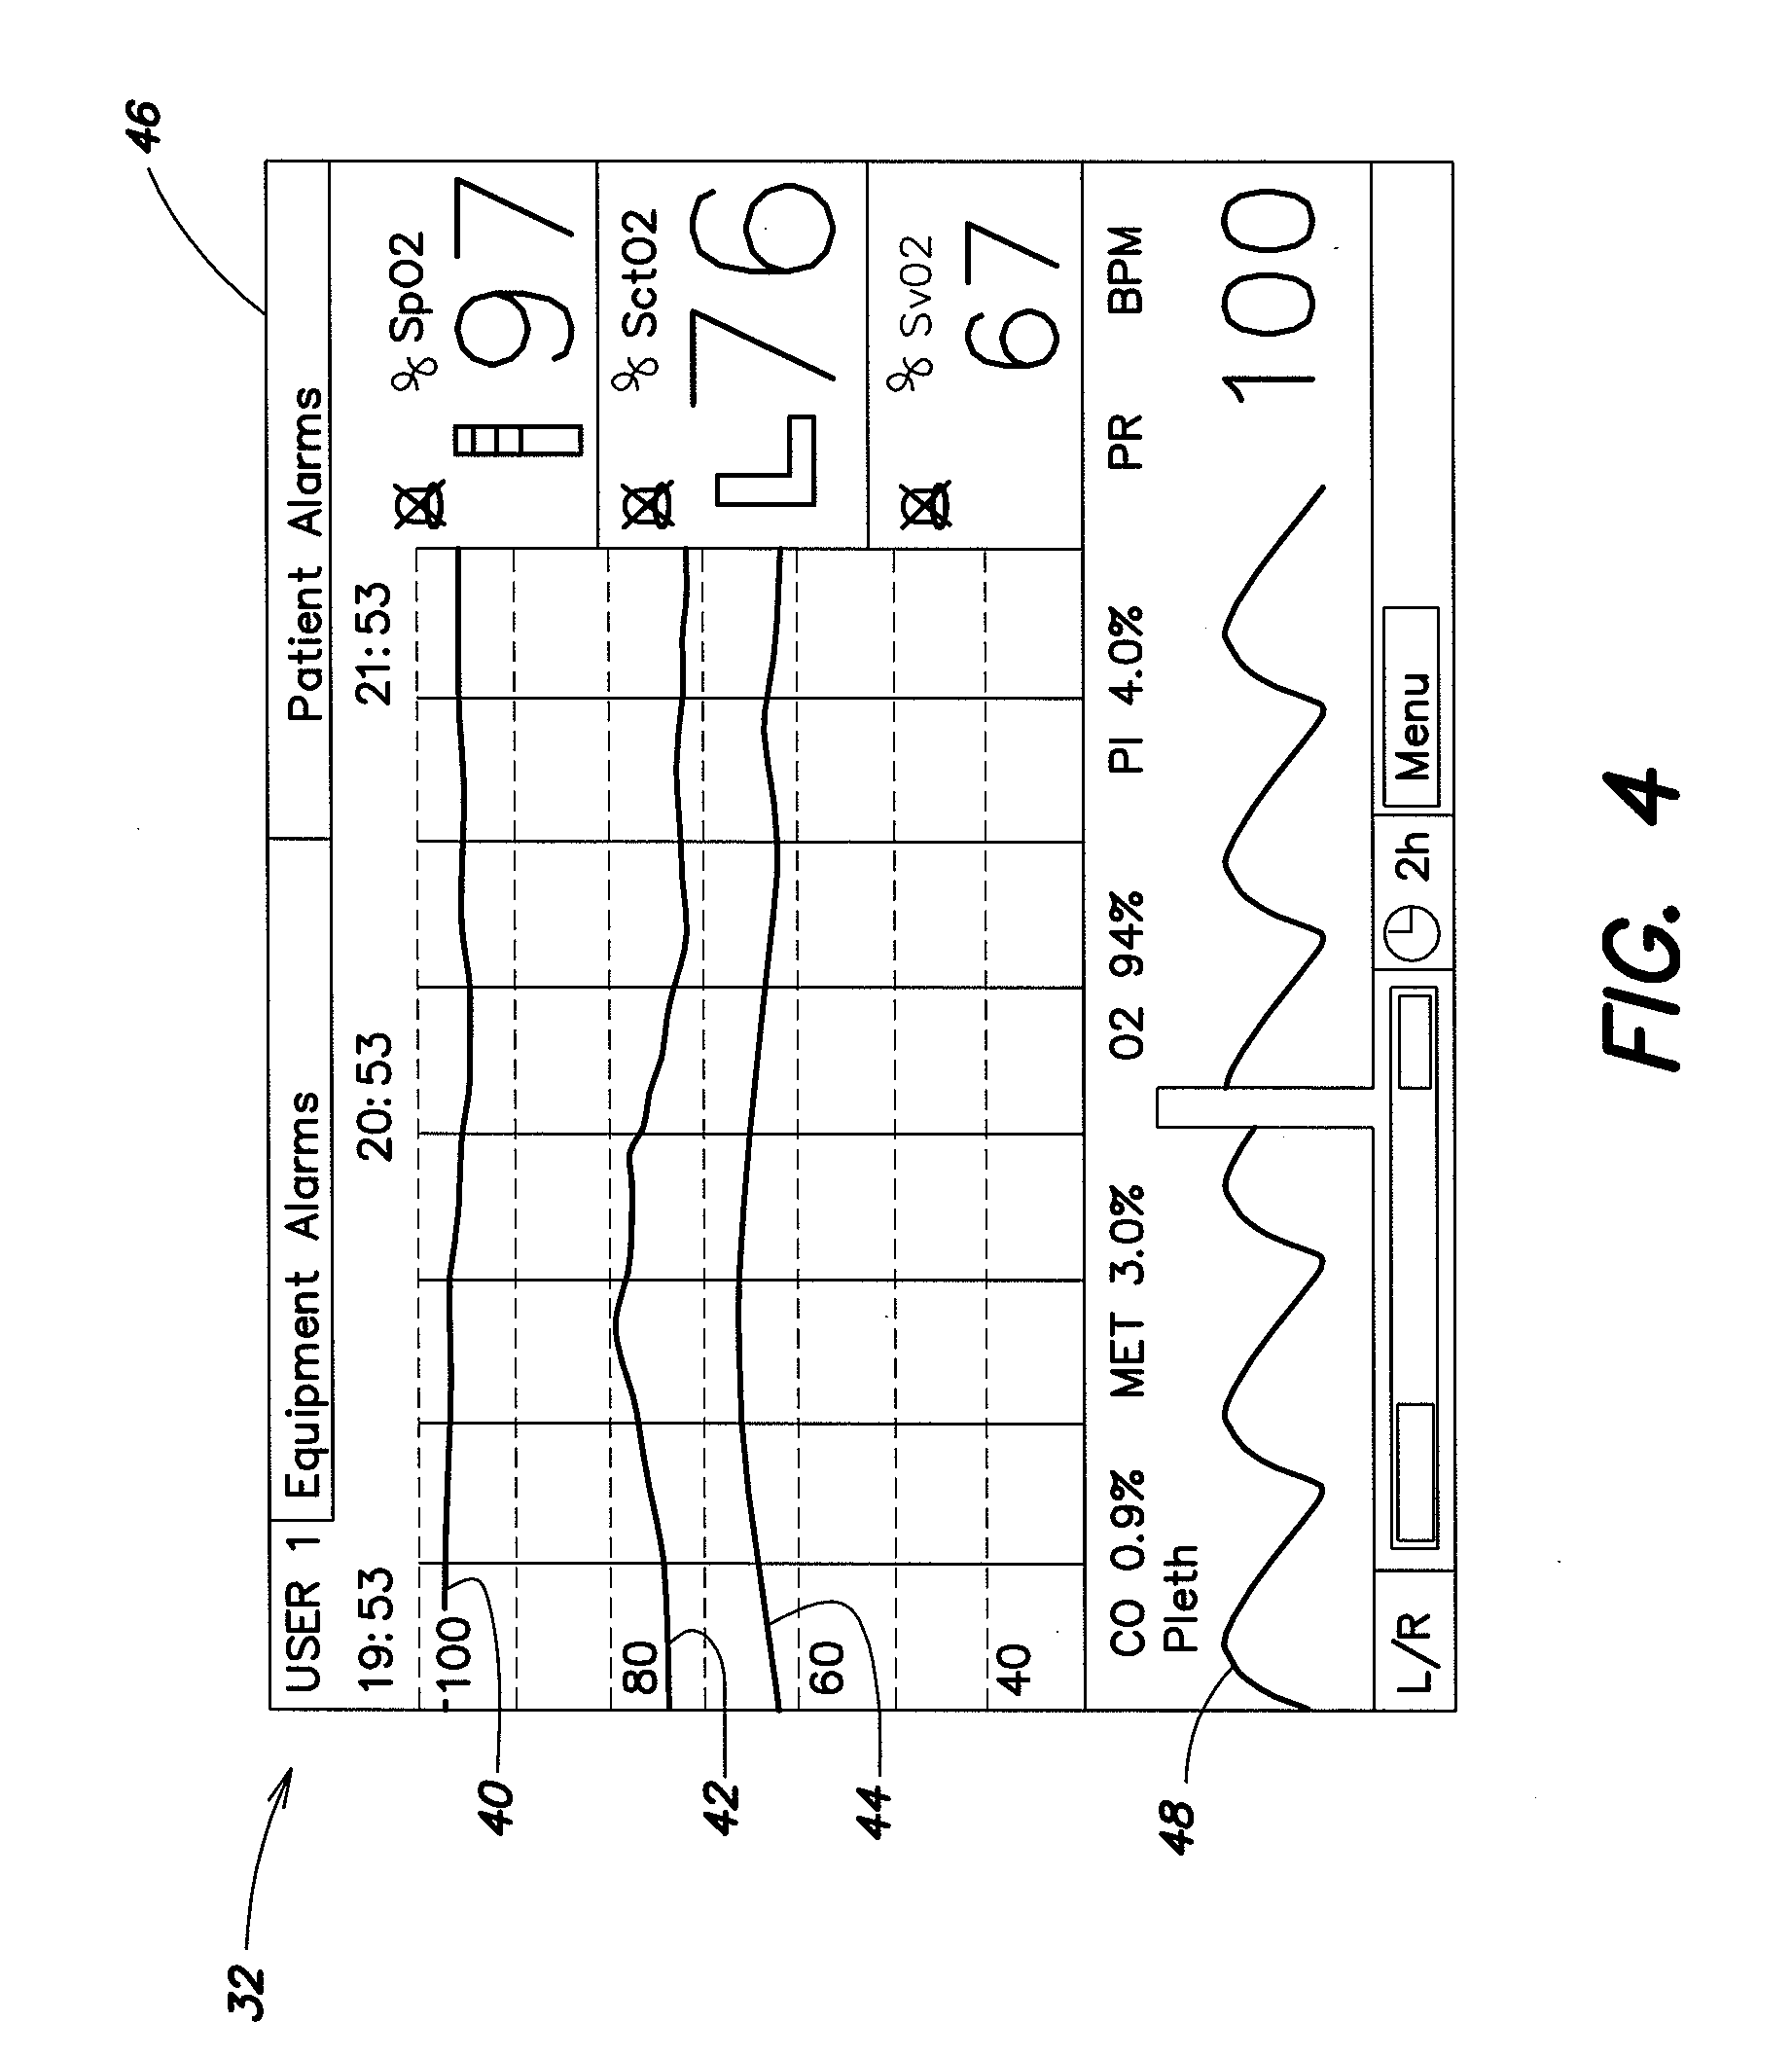
[0020]Various visual indicators may be provided with the spectrophotometric system for display on the visual display provided as part of the system. The visual indicators may include, for example, graphs of the determined oxygenation values versus time, or the aforementioned diffuse optical tomography visual presentation. The tissue oxygenation values (e.g., the absolute tissue oxygen saturation values) may be color coded, or multiple values may be individually and independently color coded, or a two- or three-dimensional diffuse optical tomography image, with regions color coded, may be provided to indicate and alert the system user, for example, whether one hemisphere of the brain, or one or more regions of the brain, is in danger of adverse and potentially permanent damage. In addition, relatively simplified display indicators for multiple-sensor monitor systems may be provided. For example, data may be pre-processed by selecting the most clinically concerning sensor value (e.g., the sensor with the lowest value), and displaying only that sensor value and its identification on the display screen. This reduces screen clutter and increases the speed of interpretation by the system user. Also, the data may be pre-processed by averaging all sensor values, and displaying the average value on the display screen, again to reduce screen clutter and speed up interpretation. Further, the pulse oximetry measured arterial oxygen saturation value may be displayed on the same display screen as the NIRS tissue oxygen saturation parameters, to thereby simultaneously provide the system user with arterial, tissue and venous oxygen saturation information.

Problems solved by technology

Since venous blood is not pulsatile, pulse oximetry cannot provide any information about venous blood.
Also, it is difficult to detect arterial pulse within the brain tissue itself by optical non-invasive means, which reduces the usefulness of pulse oximetry techniques in those applications.
While this approach to determining oxygenation levels has some utility, it is limited somewhat in that the information it provides relates to a change in the level of oxygenation within the tissue.
This approach does not provide for the total value or the absolute value of the oxygen saturation within the biological tissue.
However, the estimation technique and the invasive technique have obvious drawbacks, primarily relating to accuracy and to the invasive nature, respectively.
However, drawbacks with these comparative spectroscopy methods typically include the need to compare an oxygenation measurement of one region or hemisphere of the brain to oxygenation measurements of other regions of the brain to determine adverse physiological changes by differential analysis or by measuring differential changes from a predetermined initial baseline.
Therefore a particular disadvantage of comparative spectroscopy is that potential brain damage indications may be missed, because measurements from two or more sensors may give a similar value in which a differential value may be near zero.

Method used


Image

  • Indicators For A Spectrophotometric System
  • Indicators For A Spectrophotometric System
  • Indicators For A Spectrophotometric System

Examples


Embodiment Construction

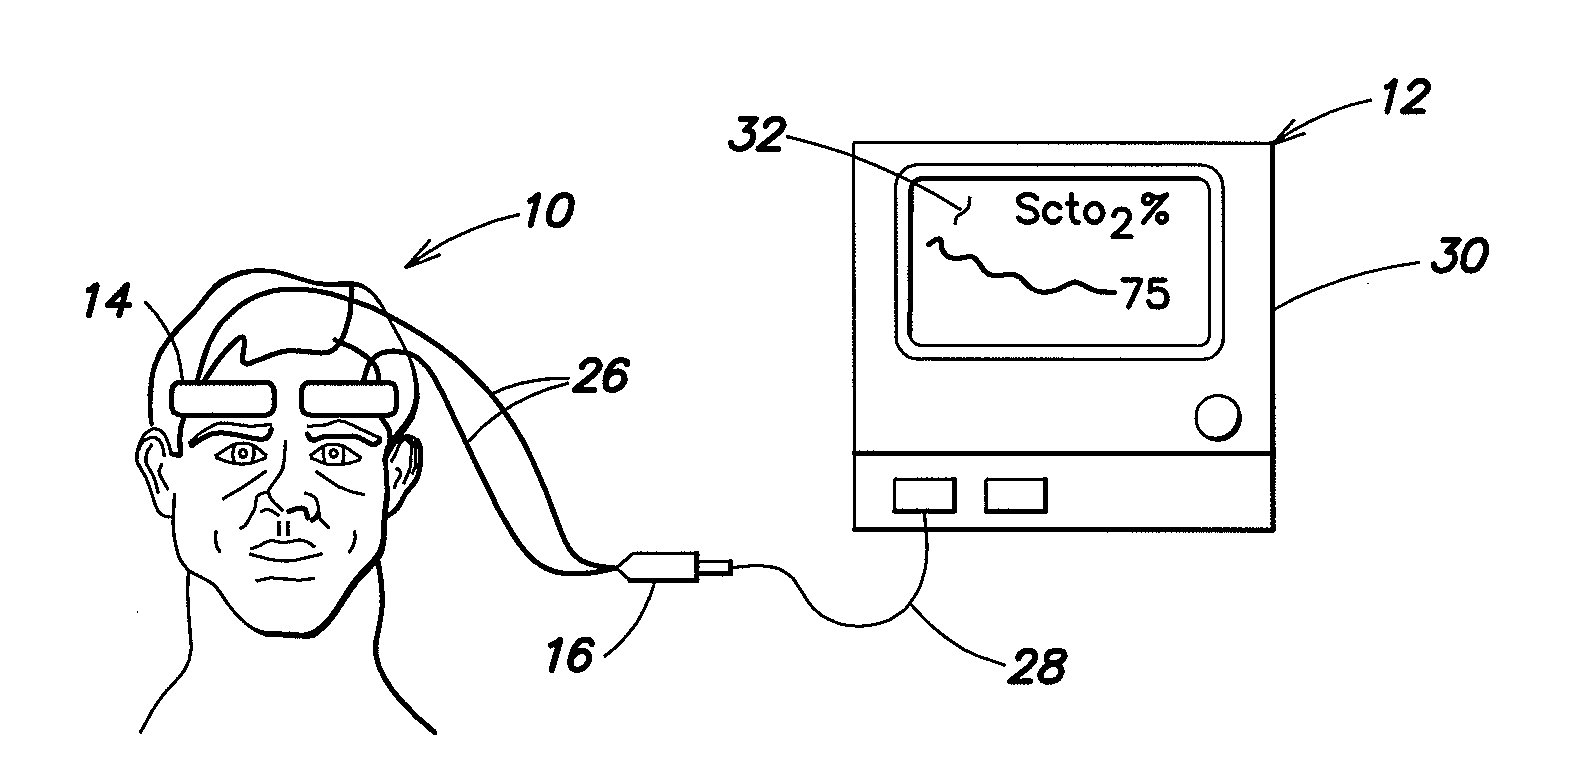
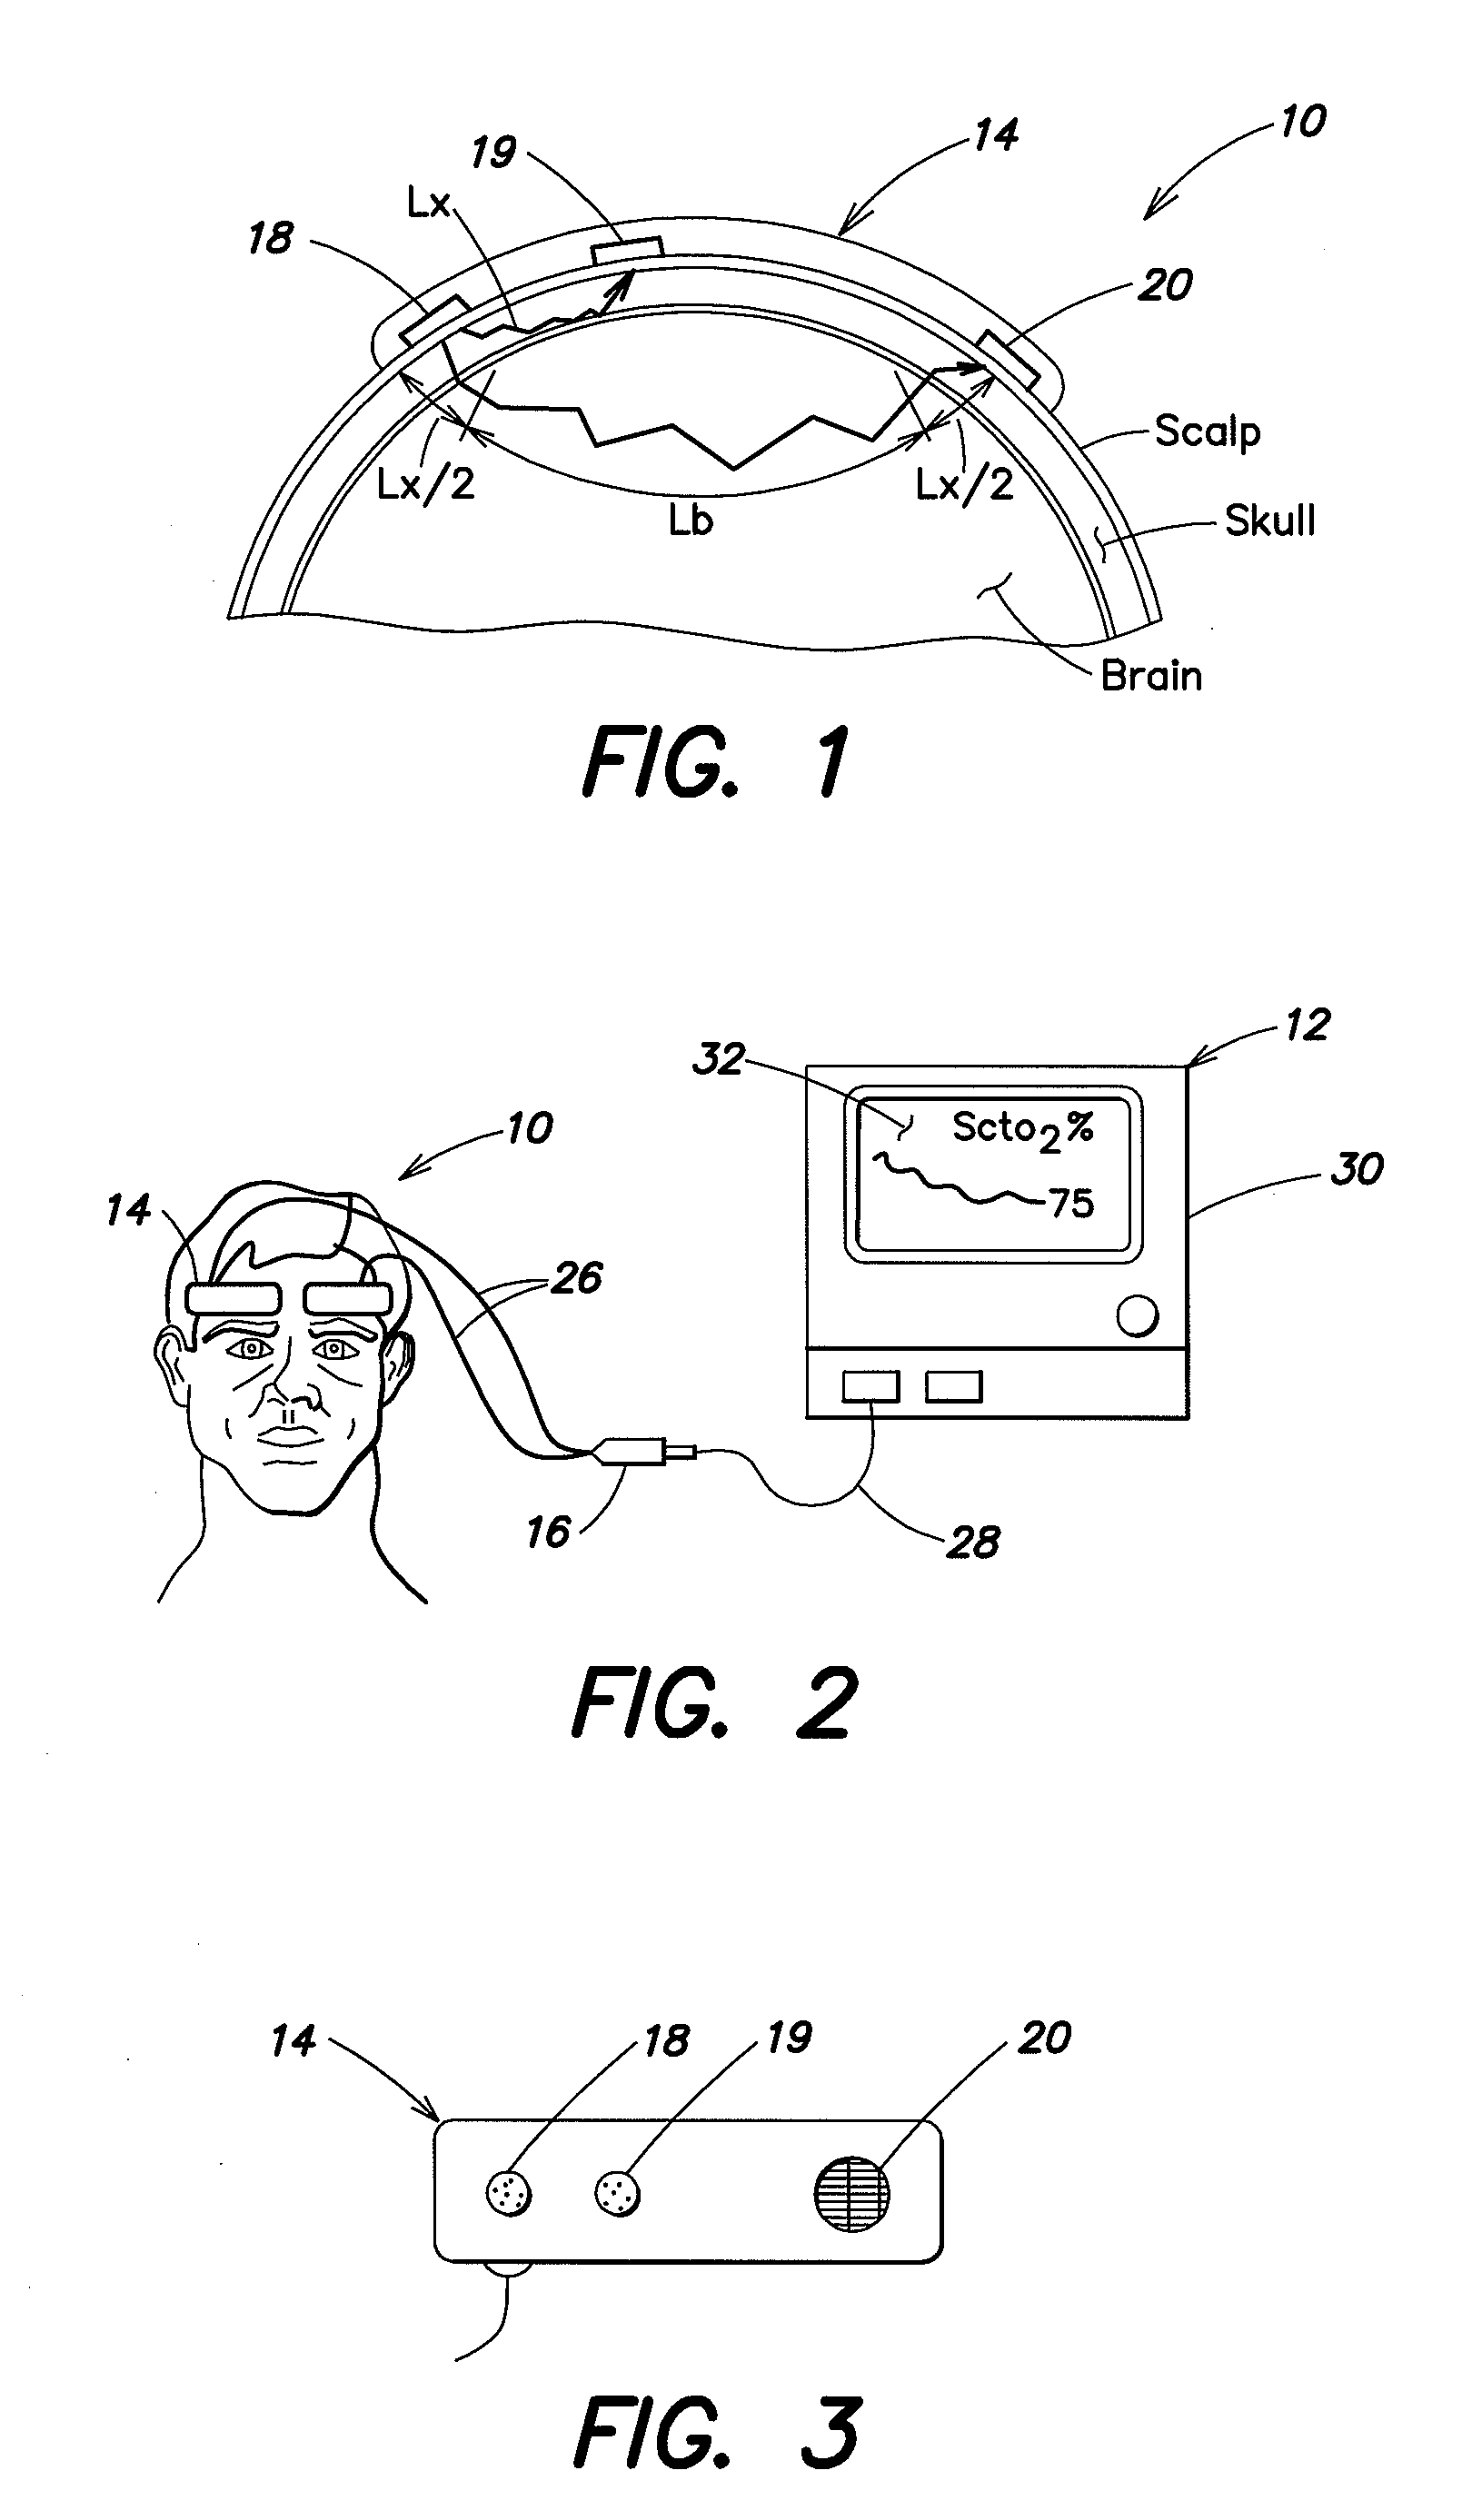
[0028]Referring to FIGS. 1-3, a spectrophotometric system may be similar to that described and illustrated in the aforementioned U.S. Published Patent Application No. 2004 / 0024297, which provides for determined absolute values of tissue oxygen saturation. However, the spectrophotometric system described herein is not limited to use with any particular type of oxygenation information. For example, it may be used with absolute tissue oxygen saturation, such as those determined by the aforementioned U.S. Pat. No. 6,456,862, or with determined relative changes in oxygen concentration. The spectrophotometric system includes a sensor portion 10 and monitor portion 12. The sensor portion 10 includes a pair of sensor assembly housings 14 and a connector housing 16. Each sensor assembly housing 14 is a flexible structure that can be attached directly to a location on the body (e.g., the head) of a human subject. The sensor assembly housing 14 may also be referred to hereinafter for simplicit...


PUM


Abstract

A near-infrared spectrophotometric system (e.g., a cerebral oximeter) includes a sensor portion and a monitor portion. The monitor portion includes a processor that runs an algorithm which utilizes the amount of detected light to determine the value of the oxygen concentration (e.g., the absolute level of oxygen concentration). The monitor portion also includes a visual display that displays the determined oxygen concentration values in various formats. The monitor portion may also include an audible device (e.g., a speaker), that provides audible indications of the determined oxygen concentration values. Various visual indicators may include, for example, color-coded graphs of the determined oxygenation values to alert the system user, for example, whether one hemisphere of the brain, or one or more regions of the brain, is in danger of adverse and potentially permanent damage. Also, data may be pre-processed by selecting the most clinically concerning sensor value (e.g., the sensor with the lowest value), and displaying only that sensor value and its identification on the display screen. Alternatively, an average value of multiple sensor measurements may be displayed. This reduces screen clutter and increases the speed of interpretation by the system user. Also, all sensor values may be averaged, and the average value displayed. The determined oxygenation values may also be provided in an audible format.

Description

[0001]Applicant hereby claims priority benefits under 35 U.S.C. § 119(e) of U.S. Provisional Patent Application No. 60 / 742,801 filed Dec. 6, 2005, the disclosure of which is herein incorporated by reference.[0002]This invention was made with Government support under Contract No. 2R44NS45488-01 awarded by the Department of Health & Human Services. The Government has certain rights in the invention.BACKGROUND OF THE INVENTION[0003]1. Technical Field[0004]This invention relates in general to a spectrophotometric system for non-invasively determining oxygenation levels in human tissue utilizing near-infrared spectrophotometric techniques, and in particular to such a system having various types of indicators which provide the user with information relating to the determined oxygenation levels.[0005]2. Background Information[0006]The molecule that carries oxygen in the blood is hemoglobin. Oxygenated hemoglobin is known as oxyhemoglobin (HbO2) and deoxygenated hemoglobin as deoxyhemoglobi...

Claims


Application Information

Patent Timeline
IPC IPC(8): A61B5/1455
CPCA61B5/0073A61B5/14553A61B5/6814A61B5/4076A61B5/742
Inventor BENNI, PAUL B.CHEN, BOKERSEY, ANDREW
Owner EDWARDS LIFESCIENCES CORP
Learn More