

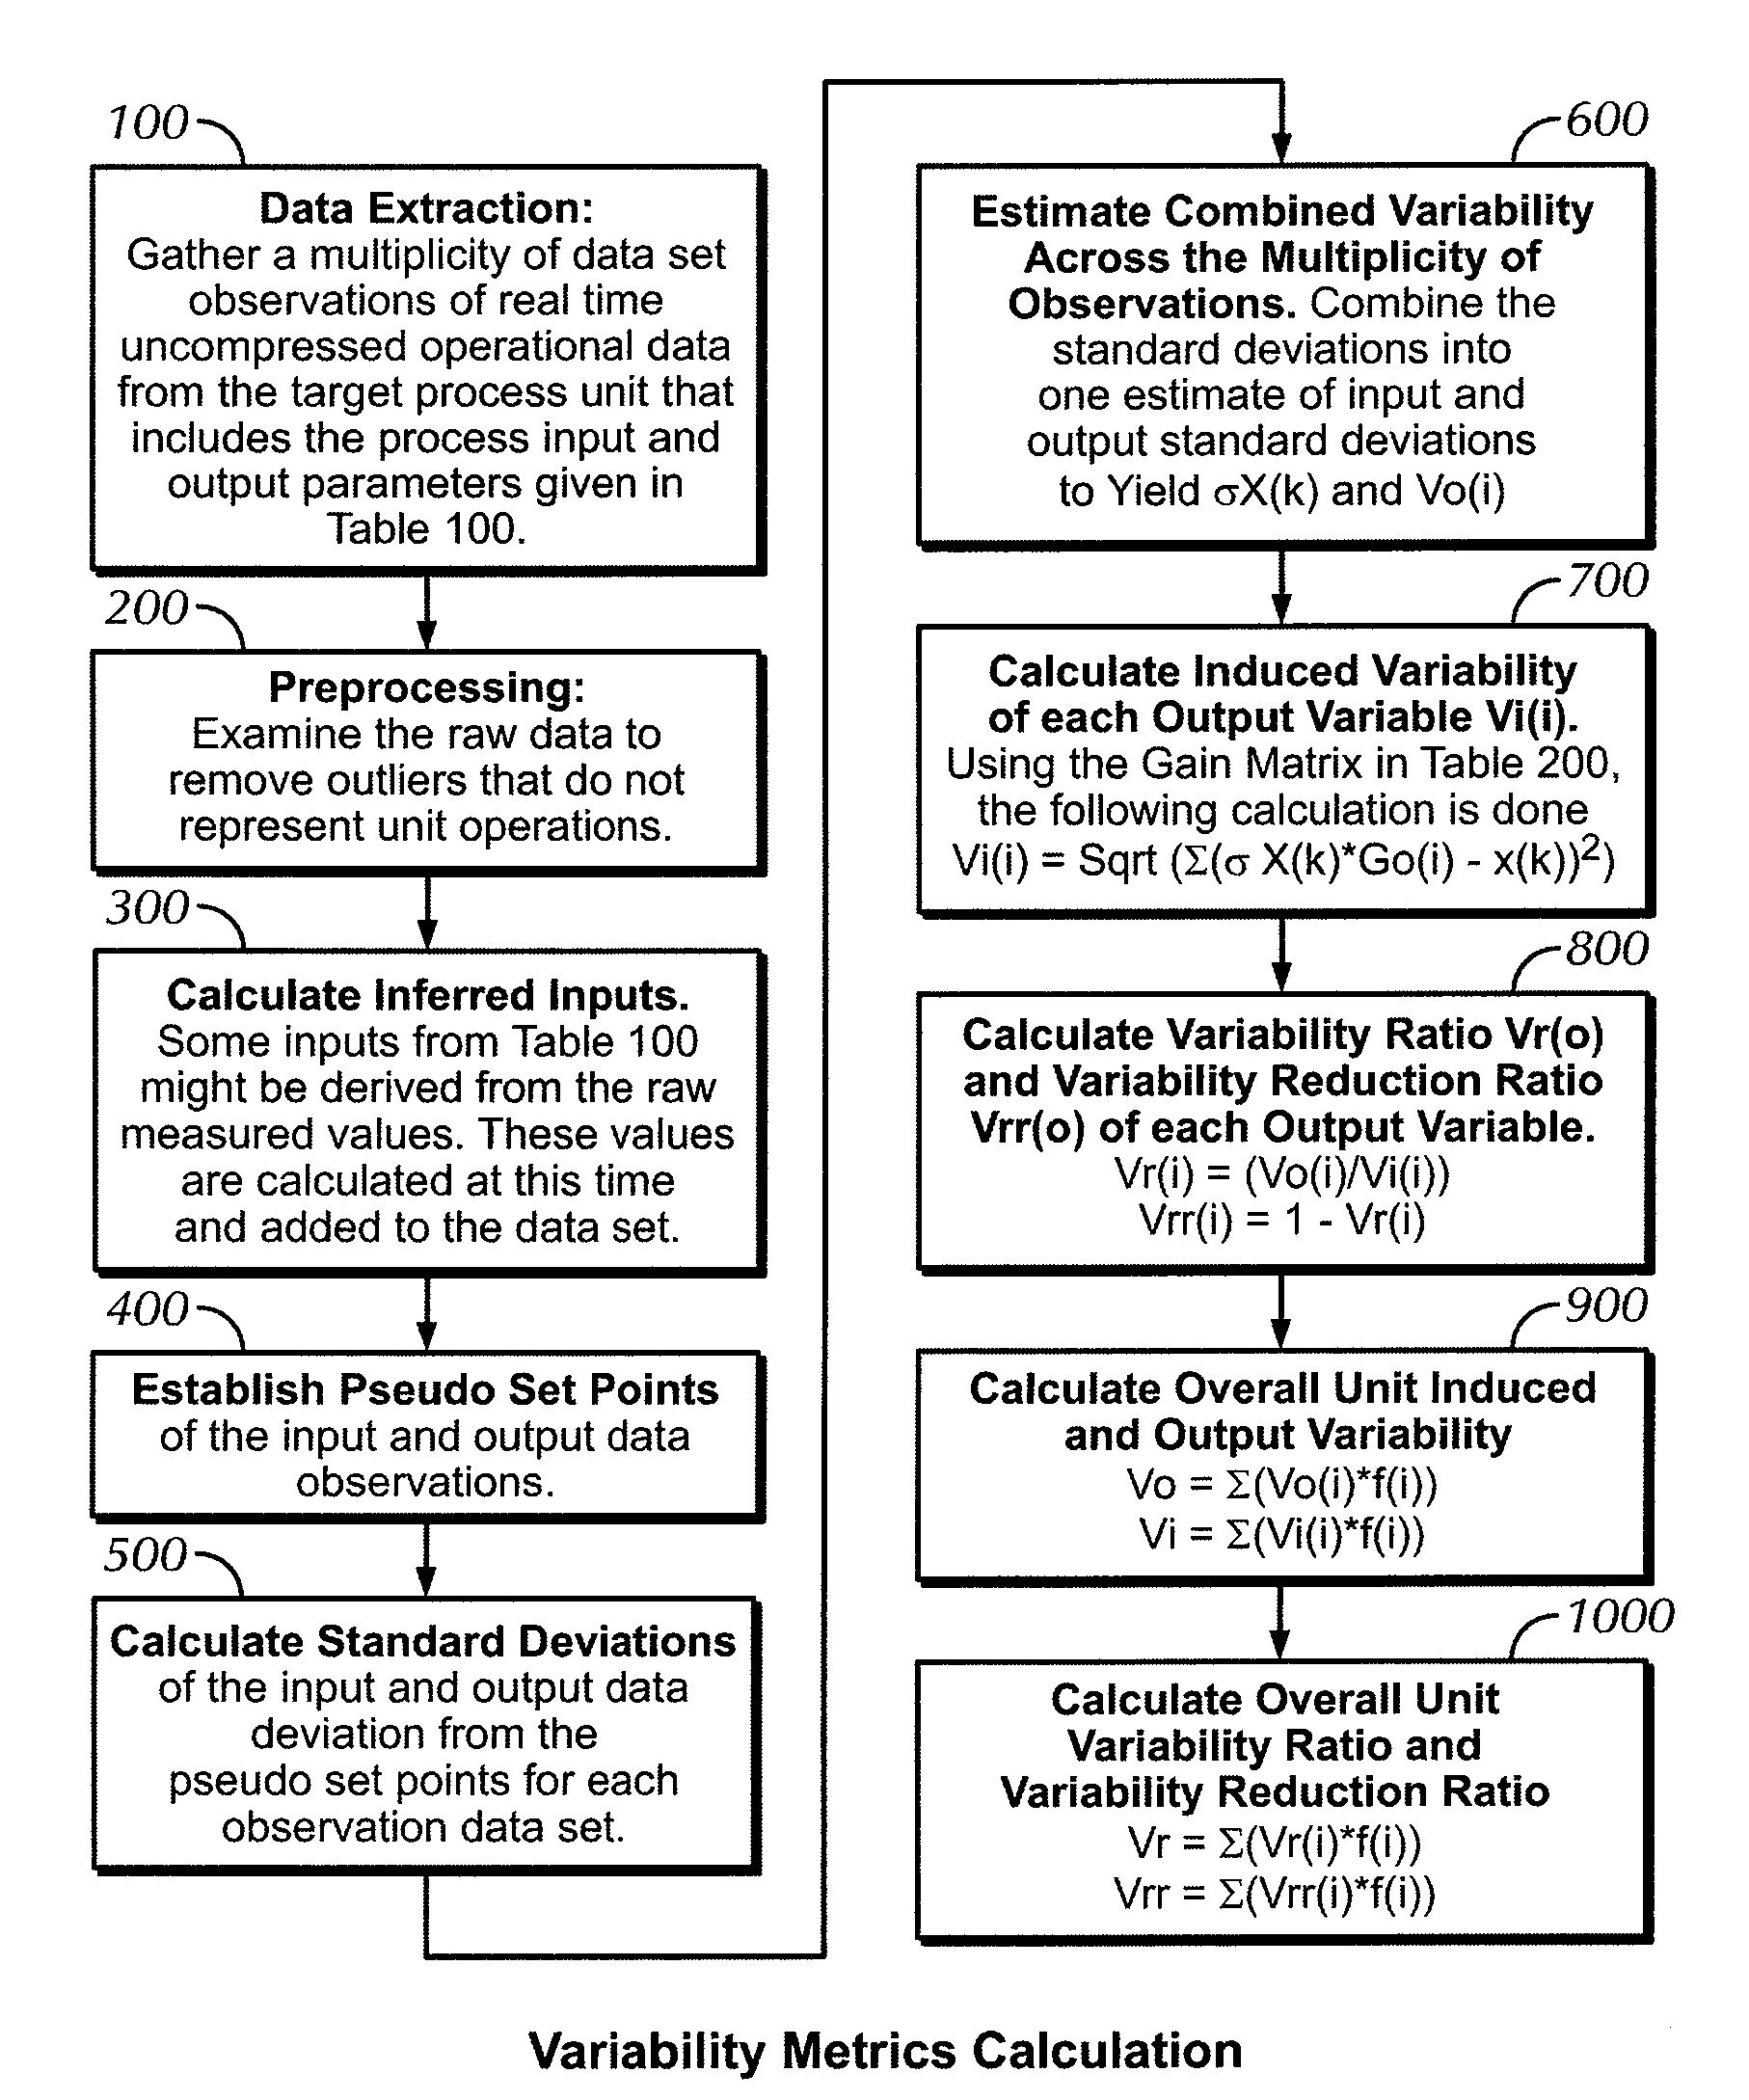
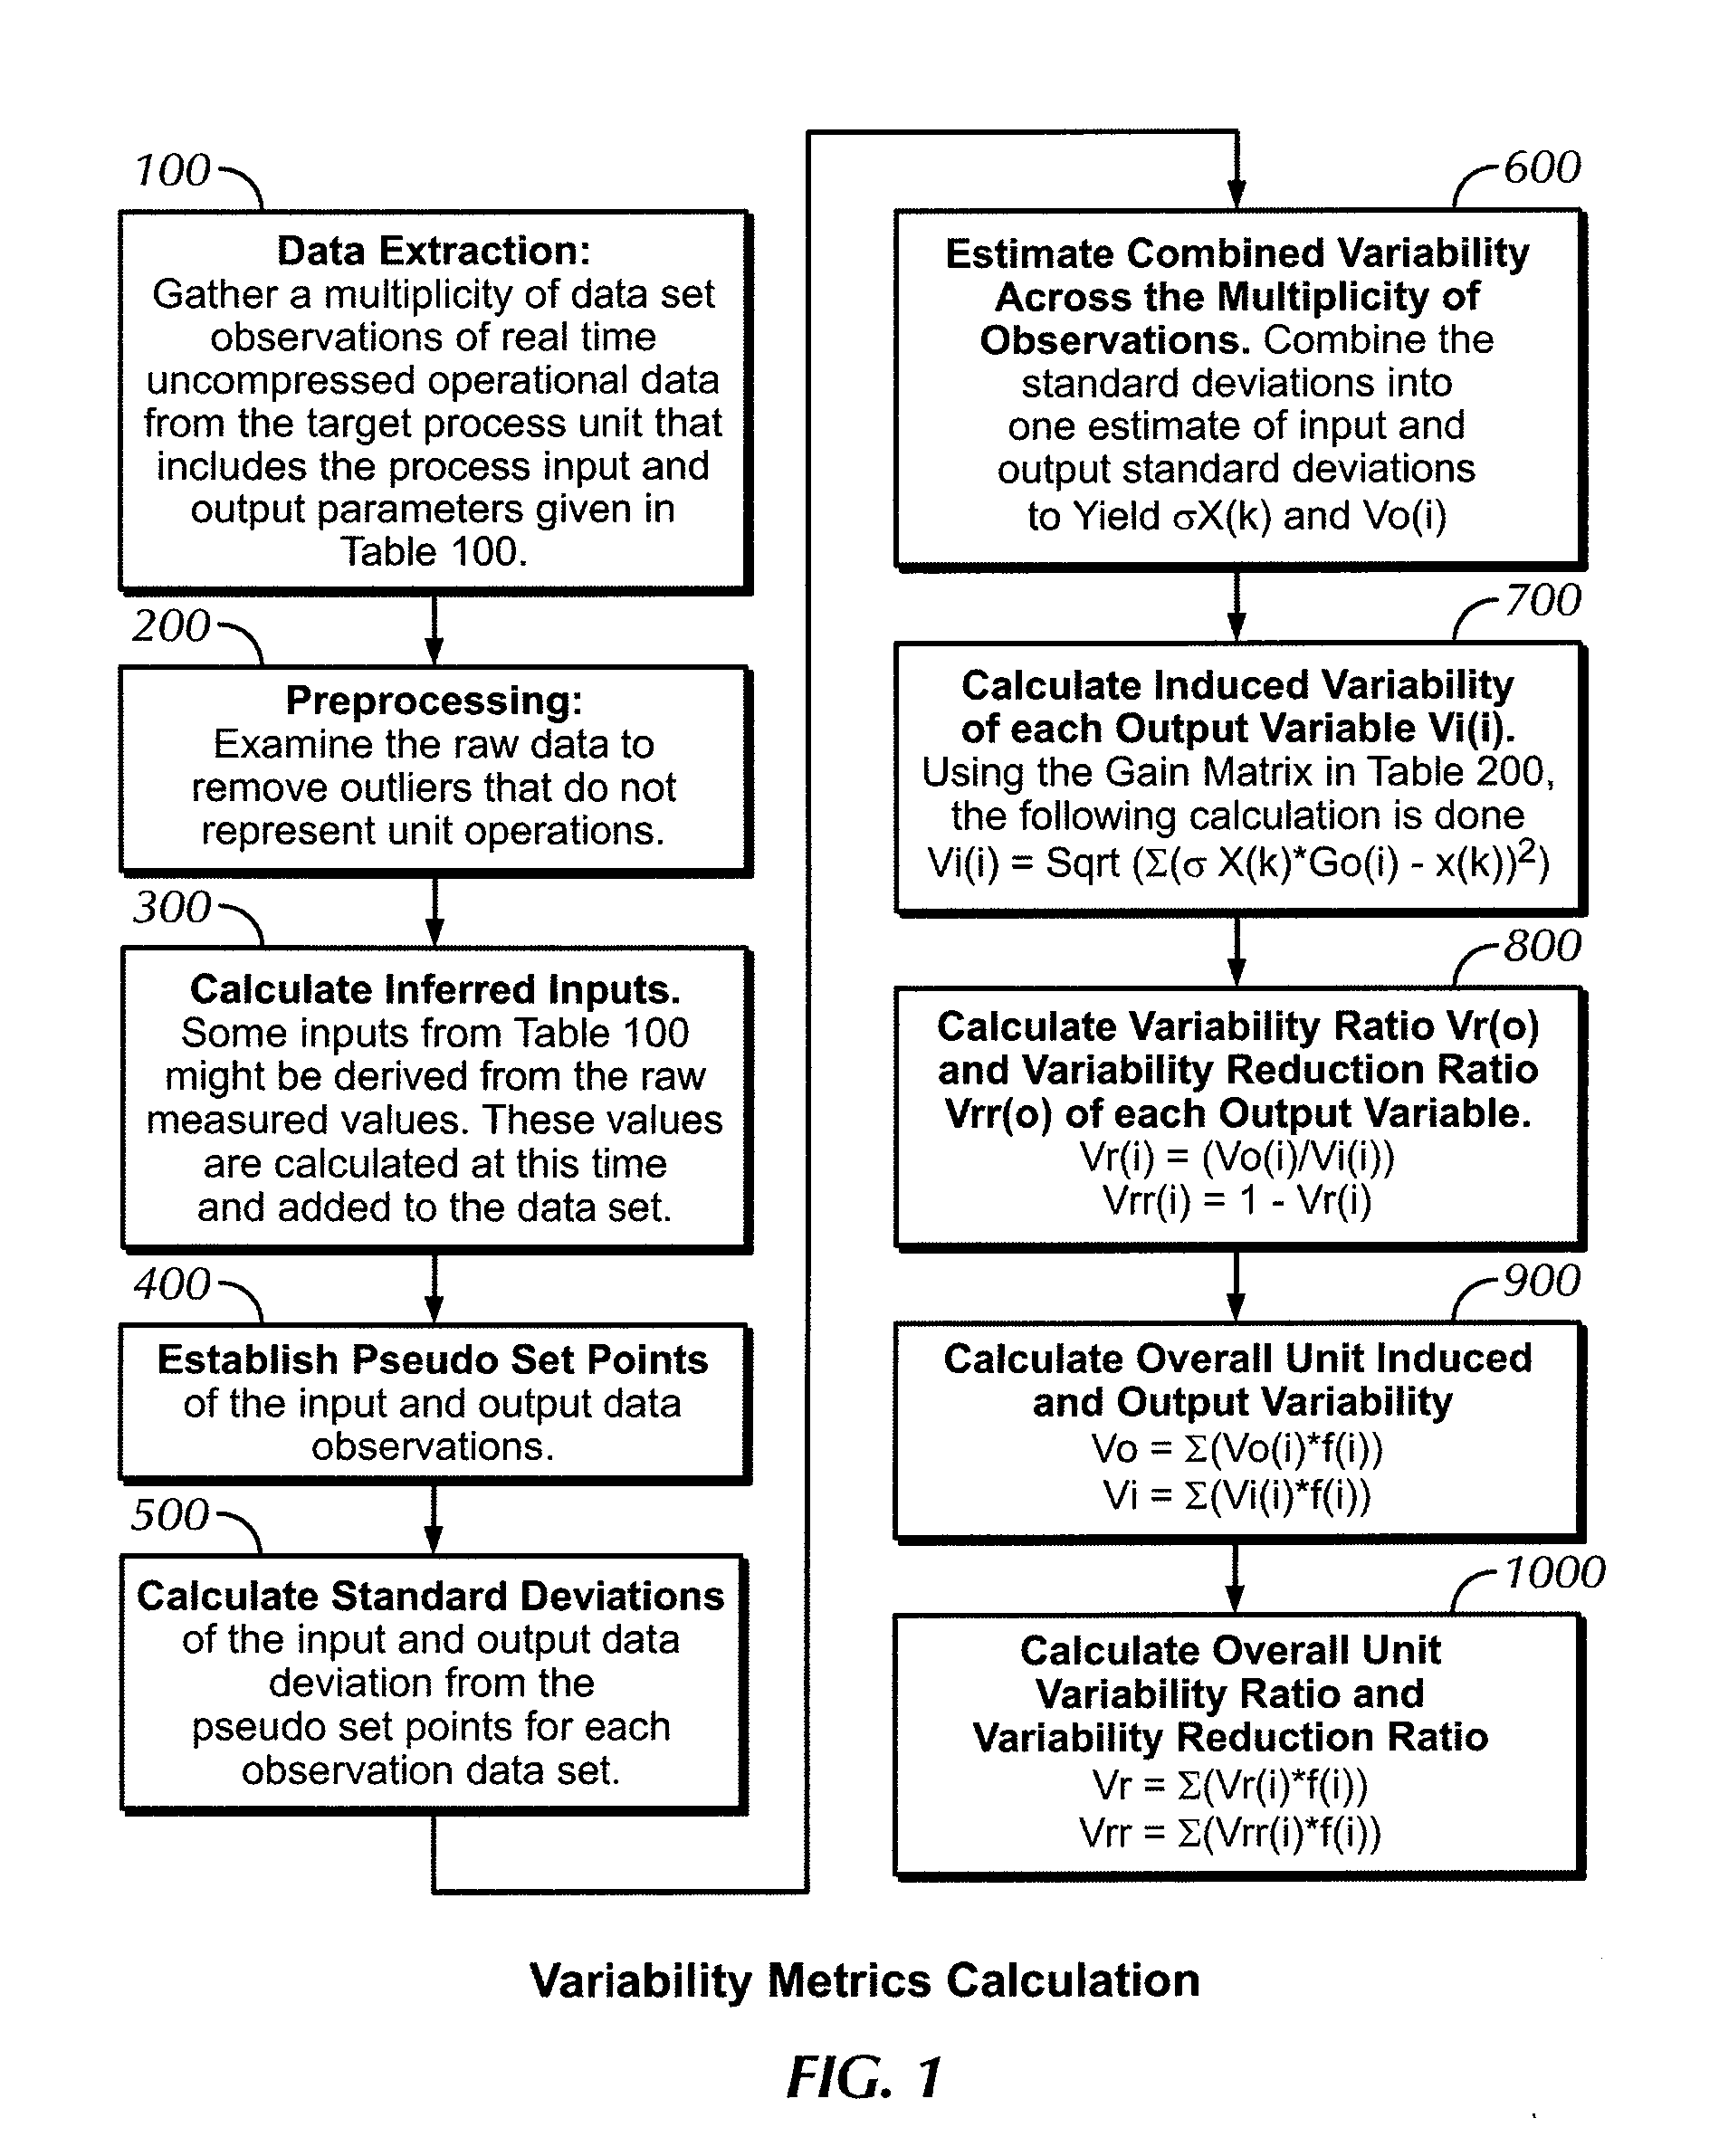
Control Asset Comparative Performance Analysis System and Methodolgy
a performance analysis and asset technology, applied in the field of system and method for measuring and comparative performance analysis of assets, can solve the problems of low production, lower product quality, and lower efficiency, and achieve the effects of improving safety operations, maximizing profits, and improving production efficiency
- Summary
- Abstract
- Description
- Claims
- Application Information
AI Technical Summary
Benefits of technology
Problems solved by technology
Method used
Image

Examples
case 1
Case 1: Analysis of the Controls Improvement
[0170]Vi=the Vi of the unit[0171]Vrr=a selected benchmark value from equations III-57 through III-62 above.
case 2
Case 2: Analysis of Induced Variability Improvement
[0172]Vi=a selected benchmark value from equations III-33 through III-39 above.[0173]Vrr=the Vrr of the unit.
case 3
Case 3: Analysis of Simultaneous Induced Variability and Controls Improvement
[0174]Vi=a selected benchmark value from equations III-33 through III-39 above.[0175]Vrr=a selected benchmark value from equations III-57 through III-62 above.
[0176]One embodiment uses the overall unit Q1Vi, and Q1Vrr to simplify analysis, but note than a large combination of analysis are possible by substituting any combination of individual metrics and overall metrics from equations III-1 through III-63 above or values in the analysis equations. This preferred embodiment calculates the potential variation achievable if the unit process control assets performance can match that of the 1st quartile average, and limits the potential variation to be no smaller than the smallest demonstrated variations reported by the industry data collection.
[0177]In an alternate embodiment, Vob is not calculated from Vrr and Vi as given in Equation IV-1, but instead Vob equal=is set to the average of the 1st quartile Vo (Q1V...
PUM
 Abstract
Description
Claims
Application Information