System and method to interpret distributed temperature sensor data and to determine a flow rate in a well

a temperature sensor and distributed technology, applied in the field of system and method to interpret temperature sensor data in a well, can solve the problems of manual analysis, high labor intensity of operators, and high labor intensity of operators, and achieve the effect of reducing labor intensity and labor intensity

Inactive Publication Date: 2009-07-09
SCHLUMBERGER TECH CORP
View PDF4 Cites 40 Cited by
  • Summary
  • Abstract
  • Description
  • Claims
  • Application Information

AI Technical Summary

Problems solved by technology

However, the temperature profile often fluctuates in gas lift wells.
Although the temperature change at an injection point may be several degrees Centigrade, the presence of fluctuations, the exceedingly high number of temperature data points, and the broad temperature trend in the well may obscure the change.
Thus, it takes an operator a substantial amount of time to manually identify the sections of the temperature profile that contain valuable information and to then remove or suppress the background or non-relevant temperature phenomena from the valuable information in the temperature profile.
Manual analysis introduces subjectivity, cannot be automatically integrated with use of other algorithms, and may provide inaccurate analysis due to noise or temperature trends that obscure the signal to a human operator.
Furthermore, the ability to obtain production flow related information from the distributed temperature sensor data or other temperature data has been limited.

Method used


Image

  • System and method to interpret distributed temperature sensor data and to determine a flow rate in a well
  • System and method to interpret distributed temperature sensor data and to determine a flow rate in a well
  • System and method to interpret distributed temperature sensor data and to determine a flow rate in a well

Examples


Embodiment Construction

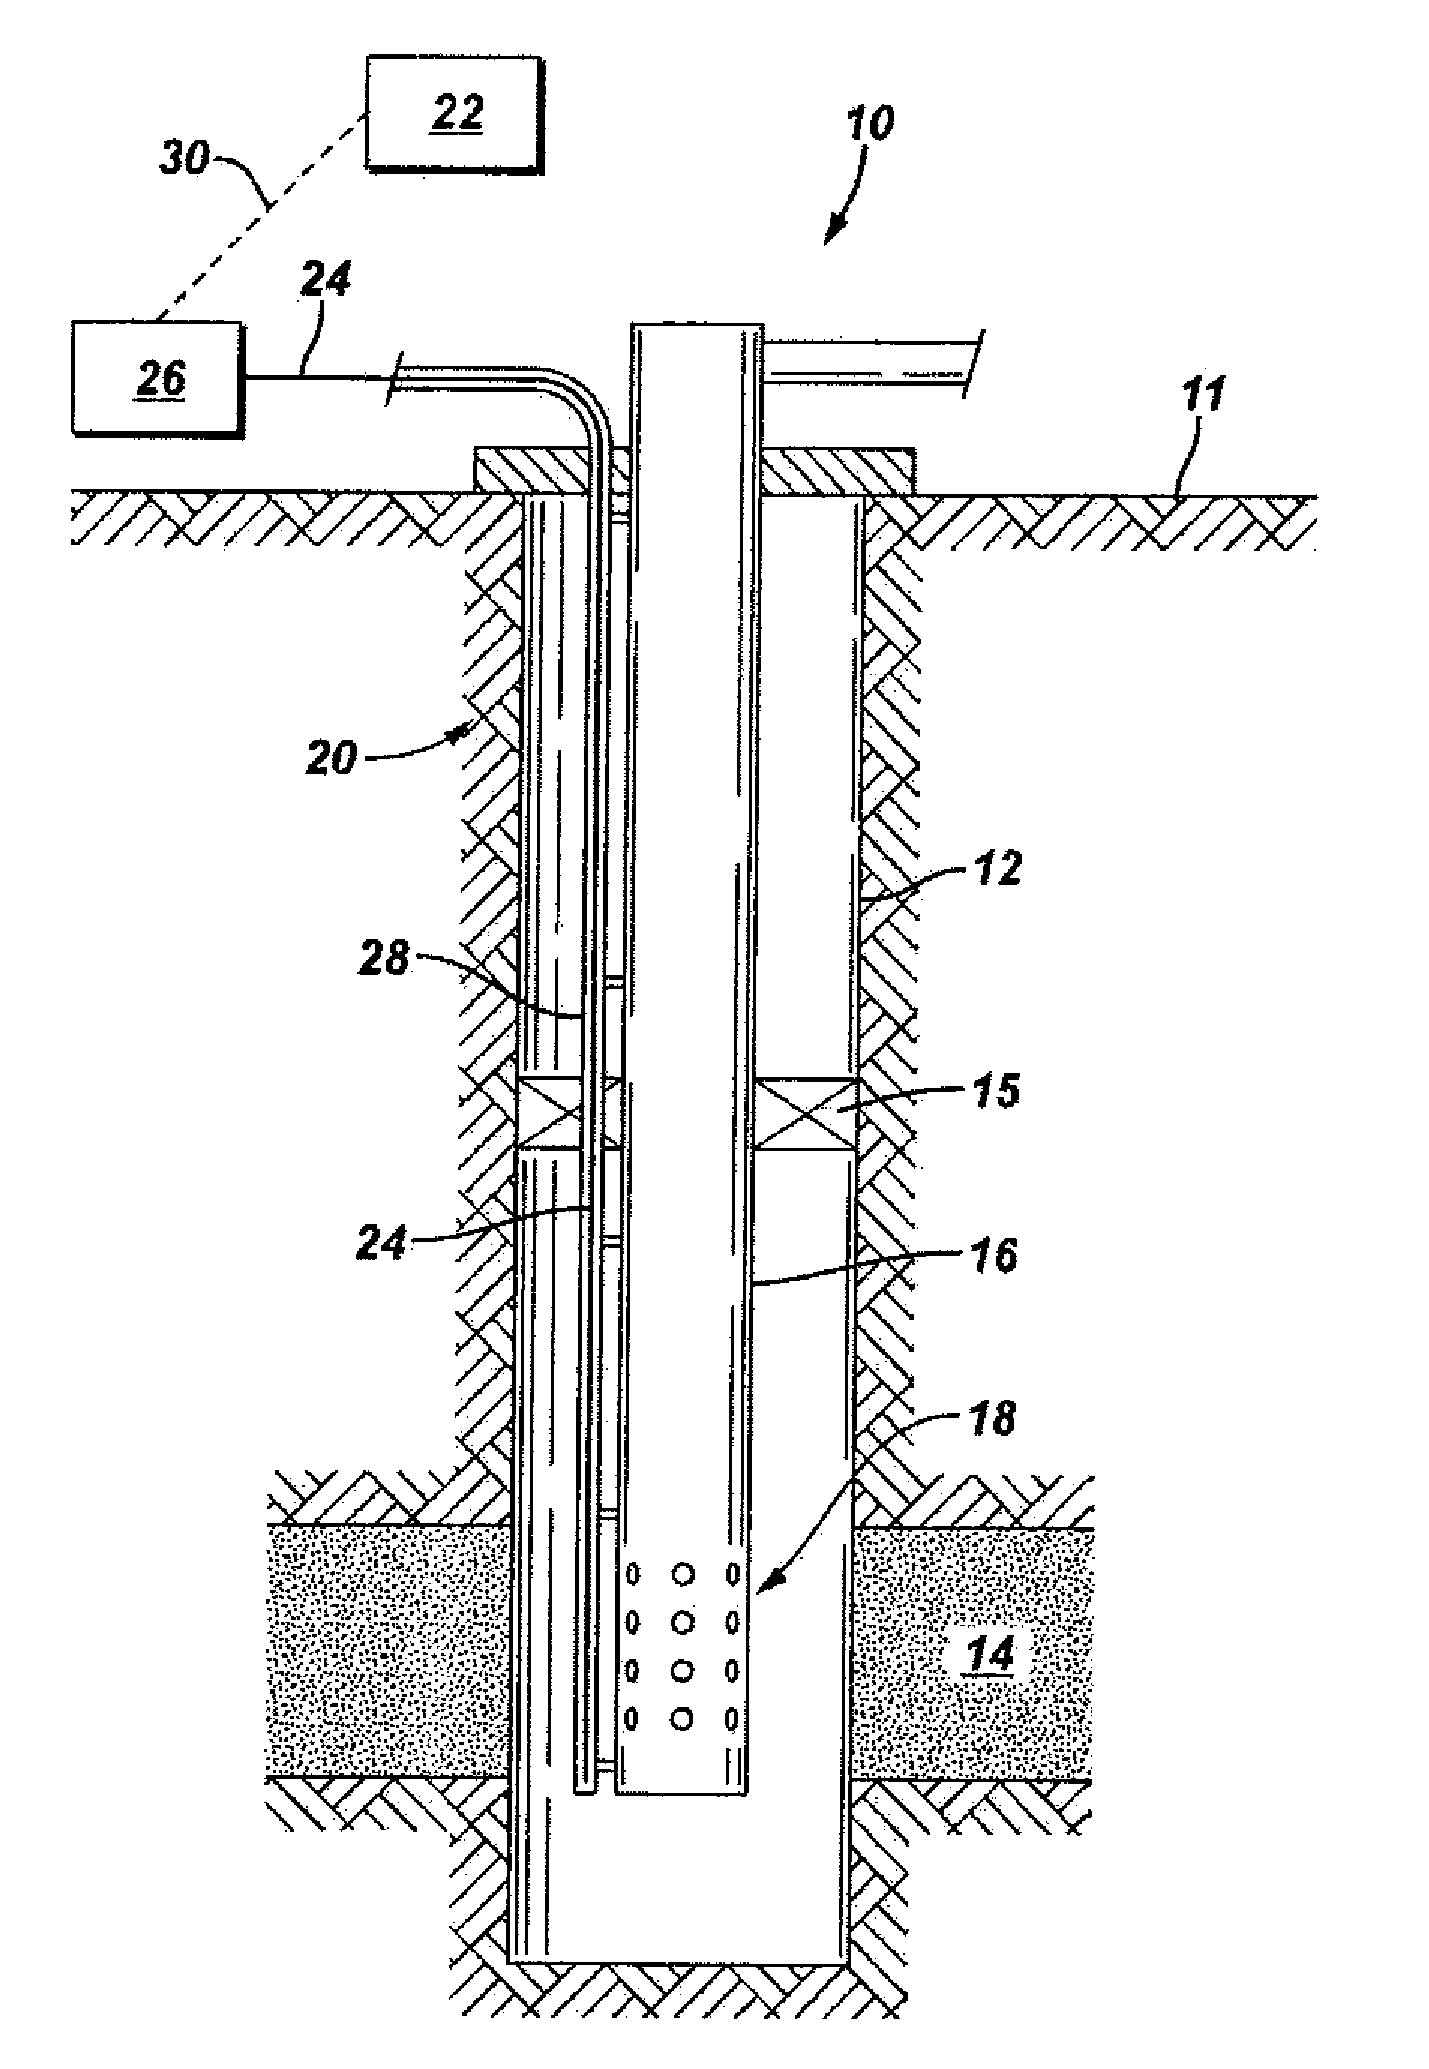
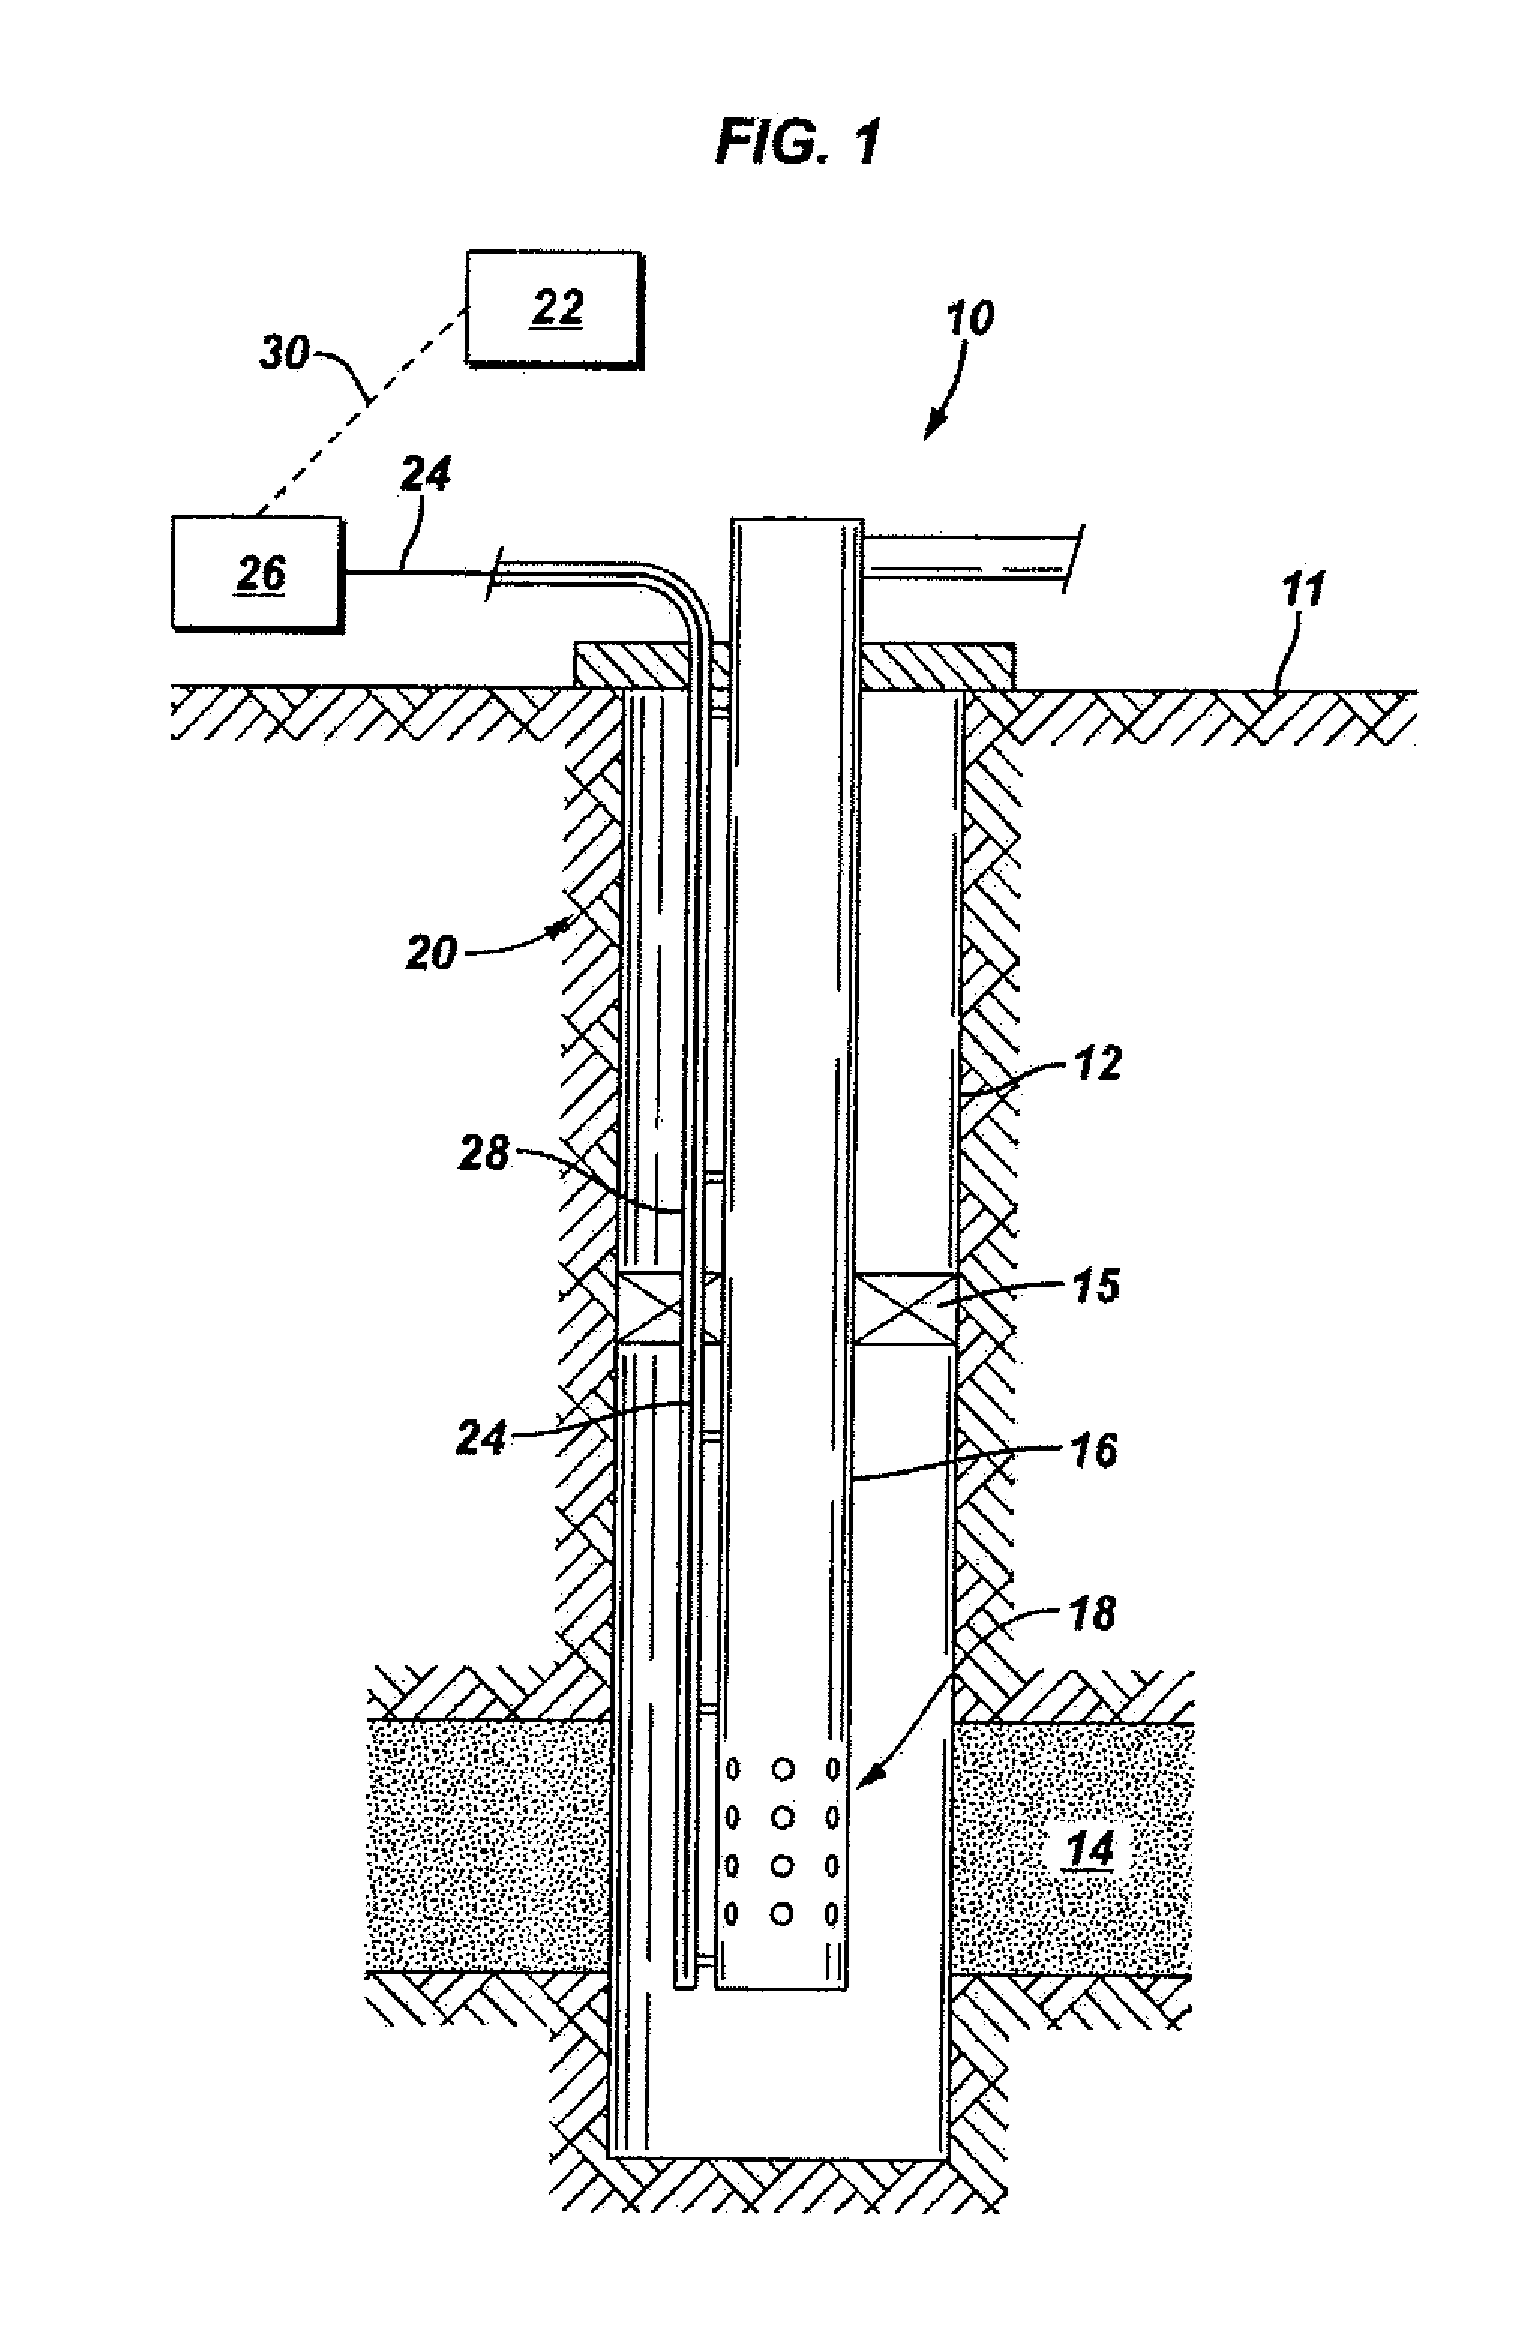
[0018]FIG. 1 illustrates an embodiment of a system 10 that is the subject of this invention. A wellbore 12 extends from the surface 11 into the earth and intersects a formation 14 that contains fluids, such as hydrocarbons. The wellbore 12 may be cased. A tubing 16, such as a production tubing, extends within the wellbore 12. A packer 15 provides a seal and isolates the formation 14 from the region above the packer 15. Depending on whether the wellbore 12 is used as an injector well or as a producing well, fluid is either injected into the tubing 16 and into the formation 14 or fluid is produced from the formation 14 and into the tubing 16. In either case, fluid enters or exits the tubing 16 through flow paths in the tubing 16, such as the ports 18 illustrated in FIG. 1. The injection and production of fluids may also be aided by artificial lift mechanisms, such as pumps or gas lift valves. Perforations (not shown) may also be made in the wellbore 12 at the formation 14 in order to ...


PUM

PropertyMeasurementUnit
depthaaaaaaaaaa
flow rateaaaaaaaaaa
temperatureaaaaaaaaaa

Abstract

A technique is provided to determine a flow rate of a production fluid. The technique is utilized in a well having a gas lift system. Temperatures are measured along the well to create a temperature profile. The temperature profile is used to determine the flow rate of a produced fluid.

Description

CROSS-REFERENCE TO RELATED APPLICATIONS[0001]This application is a divisional of U.S. patent application Ser. No. 10 / 711,918, filed 13 Oct. 2004, which claims the benefit under 35 USC 119(e) of U.S. Provisional Patent Application Ser. No. 60 / 533,188, filed 30 Dec. 2003, and U.S. Provisional Patent Application Ser. No. 60 / 536,059, filed 13 Jan. 2004.BACKGROUND[0002]The invention generally relates to a system and method to interpret temperature sensor data in a well. For example, a temperature profile can be created and used in determining specific characteristics of fluid flow in a well environment.[0003]Distributed temperature sensors, such as Sensor Highway Limited's DTS line of fiber optic distributed temperature sensors, have been used to measure the temperature profile of subterranean wellbores. In the DTS systems, an optical fiber is deployed in the wellbore and is connected to an opto-electronic unit that transmits optical pulses into the optical fiber and receives returned si...

Claims


Application Information

Patent Timeline
Patent Type & Authority Applications(United States)
IPC IPC(8): E21B43/12E21B47/00G06F19/00E21B47/06G01K11/32
CPCE21B47/065G01F1/6884G01K11/32E21B47/07
Inventor TARVIN, JEFFREY A.VENKATARAMANAN, LALITHAWHITE, THOMAS M.BROWN, GEORGE A.
Owner SCHLUMBERGER TECH CORP
Why Eureka
Try Eureka