
System for three-dimensional rendering of electrical test and measurement signals

a three-dimensional rendering and test signal technology, applied in the field of three-dimensional rendering of test and measurement signals, can solve the problems of large amount of data, difficult for users to visualize and identify data of interest at a particular channel, and difficult to discern the variations of repetitive waveforms over tim

Active Publication Date: 2009-08-06
C SPEED
View PDF52 Cites 39 Cited by
  • Summary
  • Abstract
  • Description
  • Claims
  • Application Information

AI Technical Summary

Benefits of technology

[0018]An advantage of the present invention over traditional two-dimensional viewing of test and measurement data is that the user is able to request the system to organize and display the data in ways that lead to quick comparison and identification of problems that are not easily discernable via a two-dimension view. For example, take an acquisition with a complex repetitive (over time) pattern in it. With a conventional two-dimensional logic analyzer display, as shown for example in FIG. 1, the user must either condense the time scale of the graph (zoom out in time) losing most of the detailed data, or scroll back and forth left and right to see if any of the instances of the pattern deviate in any detail from the expected. This is extremely difficult because there is no way to directly compare the occurrences with details on the screen at the same time. With the present system the user can separate and reorganize each repetition of the pattern along the z dimension (depth) at a continuous or discontinuous surface viewed in three-dimensions. By providing any possible view around, along, or inside this model, a variation in any one of the repetitions in any channel(s) is quickly identifiable from the norm. An analogy to this would be searching a group of hole-punched pages to find if, and which ones, might contain holes that are misaligned. Laid out next to each other on a long table, examining the sheets to find differences could take very long or completely miss them. Instead, if the sheets are stacked on top of each other, any variances can be quickly identified.
[0019]The terms “orthogonal” and “two-dimensional” or “2-D” are used herein synonymously. While orthogonal refers to an orthogonal projection view and is technically still a view of a 3-D representation but with zero perspective applied, the resulting image appears to the user to be a “flat” 2-D rendering. Thus in this invention when the 3-D representation is viewed orthogonally from a perpendicular vantage point it becomes indiscernible from a 2-D graph.
[0020]Although the system and method of the present invention are described in connection with test and measuring electrical signals in the time domain, the system and method may operate to visualize signals in other domains, such a frequency domain, or from other sources. For example, the signals may be associated with or represent other forms of data such as a stream of video for analysis of frames thereof for anomalies, or signals from any sources that are variable over a domain (not limited to test and measuring electrical signals) which a user desires to visualize that can be captured and stored in memory of the computer system.DETAILED

Problems solved by technology

Although the typical two dimensional voltage versus time graph is useful for showing one sample per channel per column of pixels on the display, variations in repetitive waveforms over time are difficult to discern.
Further, as devices under test become more complex and the number of channels in acquisition devices available to the user rises, the sampling rates of signals by acquisition devices results in a huge amount of data over multiple channels in the memory of the computer system or digital oscilloscope storing such data.
As a result, it becomes problematic to render the large amount of data from multiple channels in test and measurement systems all at once on a display to the viewer in a meaningful manner, thereby making it more difficult for the user to visualize and identify data of interest at a particular channel, and especially among multiple channels.
A drawback of this approach is that it is difficult to obverse patterns occurring in the channel.
U.S. Patent Application Publication No. 2005 / 0234670 describes viewing multiple channels, domains, or acquisitions simultaneously, but does not provide for a display of multiple channels and acquisitions (or domains) simultaneously in a single three-dimensional view on a display.
Further, the systems described in the above cited patents and publication have limited flexibility in the organization and presentation of the data on a display, which restricts the user's ability to quickly visualize and compare data when analyzing complex systems.

Method used


Image

  • System for three-dimensional rendering of electrical test and measurement signals
  • System for three-dimensional rendering of electrical test and measurement signals
  • System for three-dimensional rendering of electrical test and measurement signals

Examples


Embodiment Construction

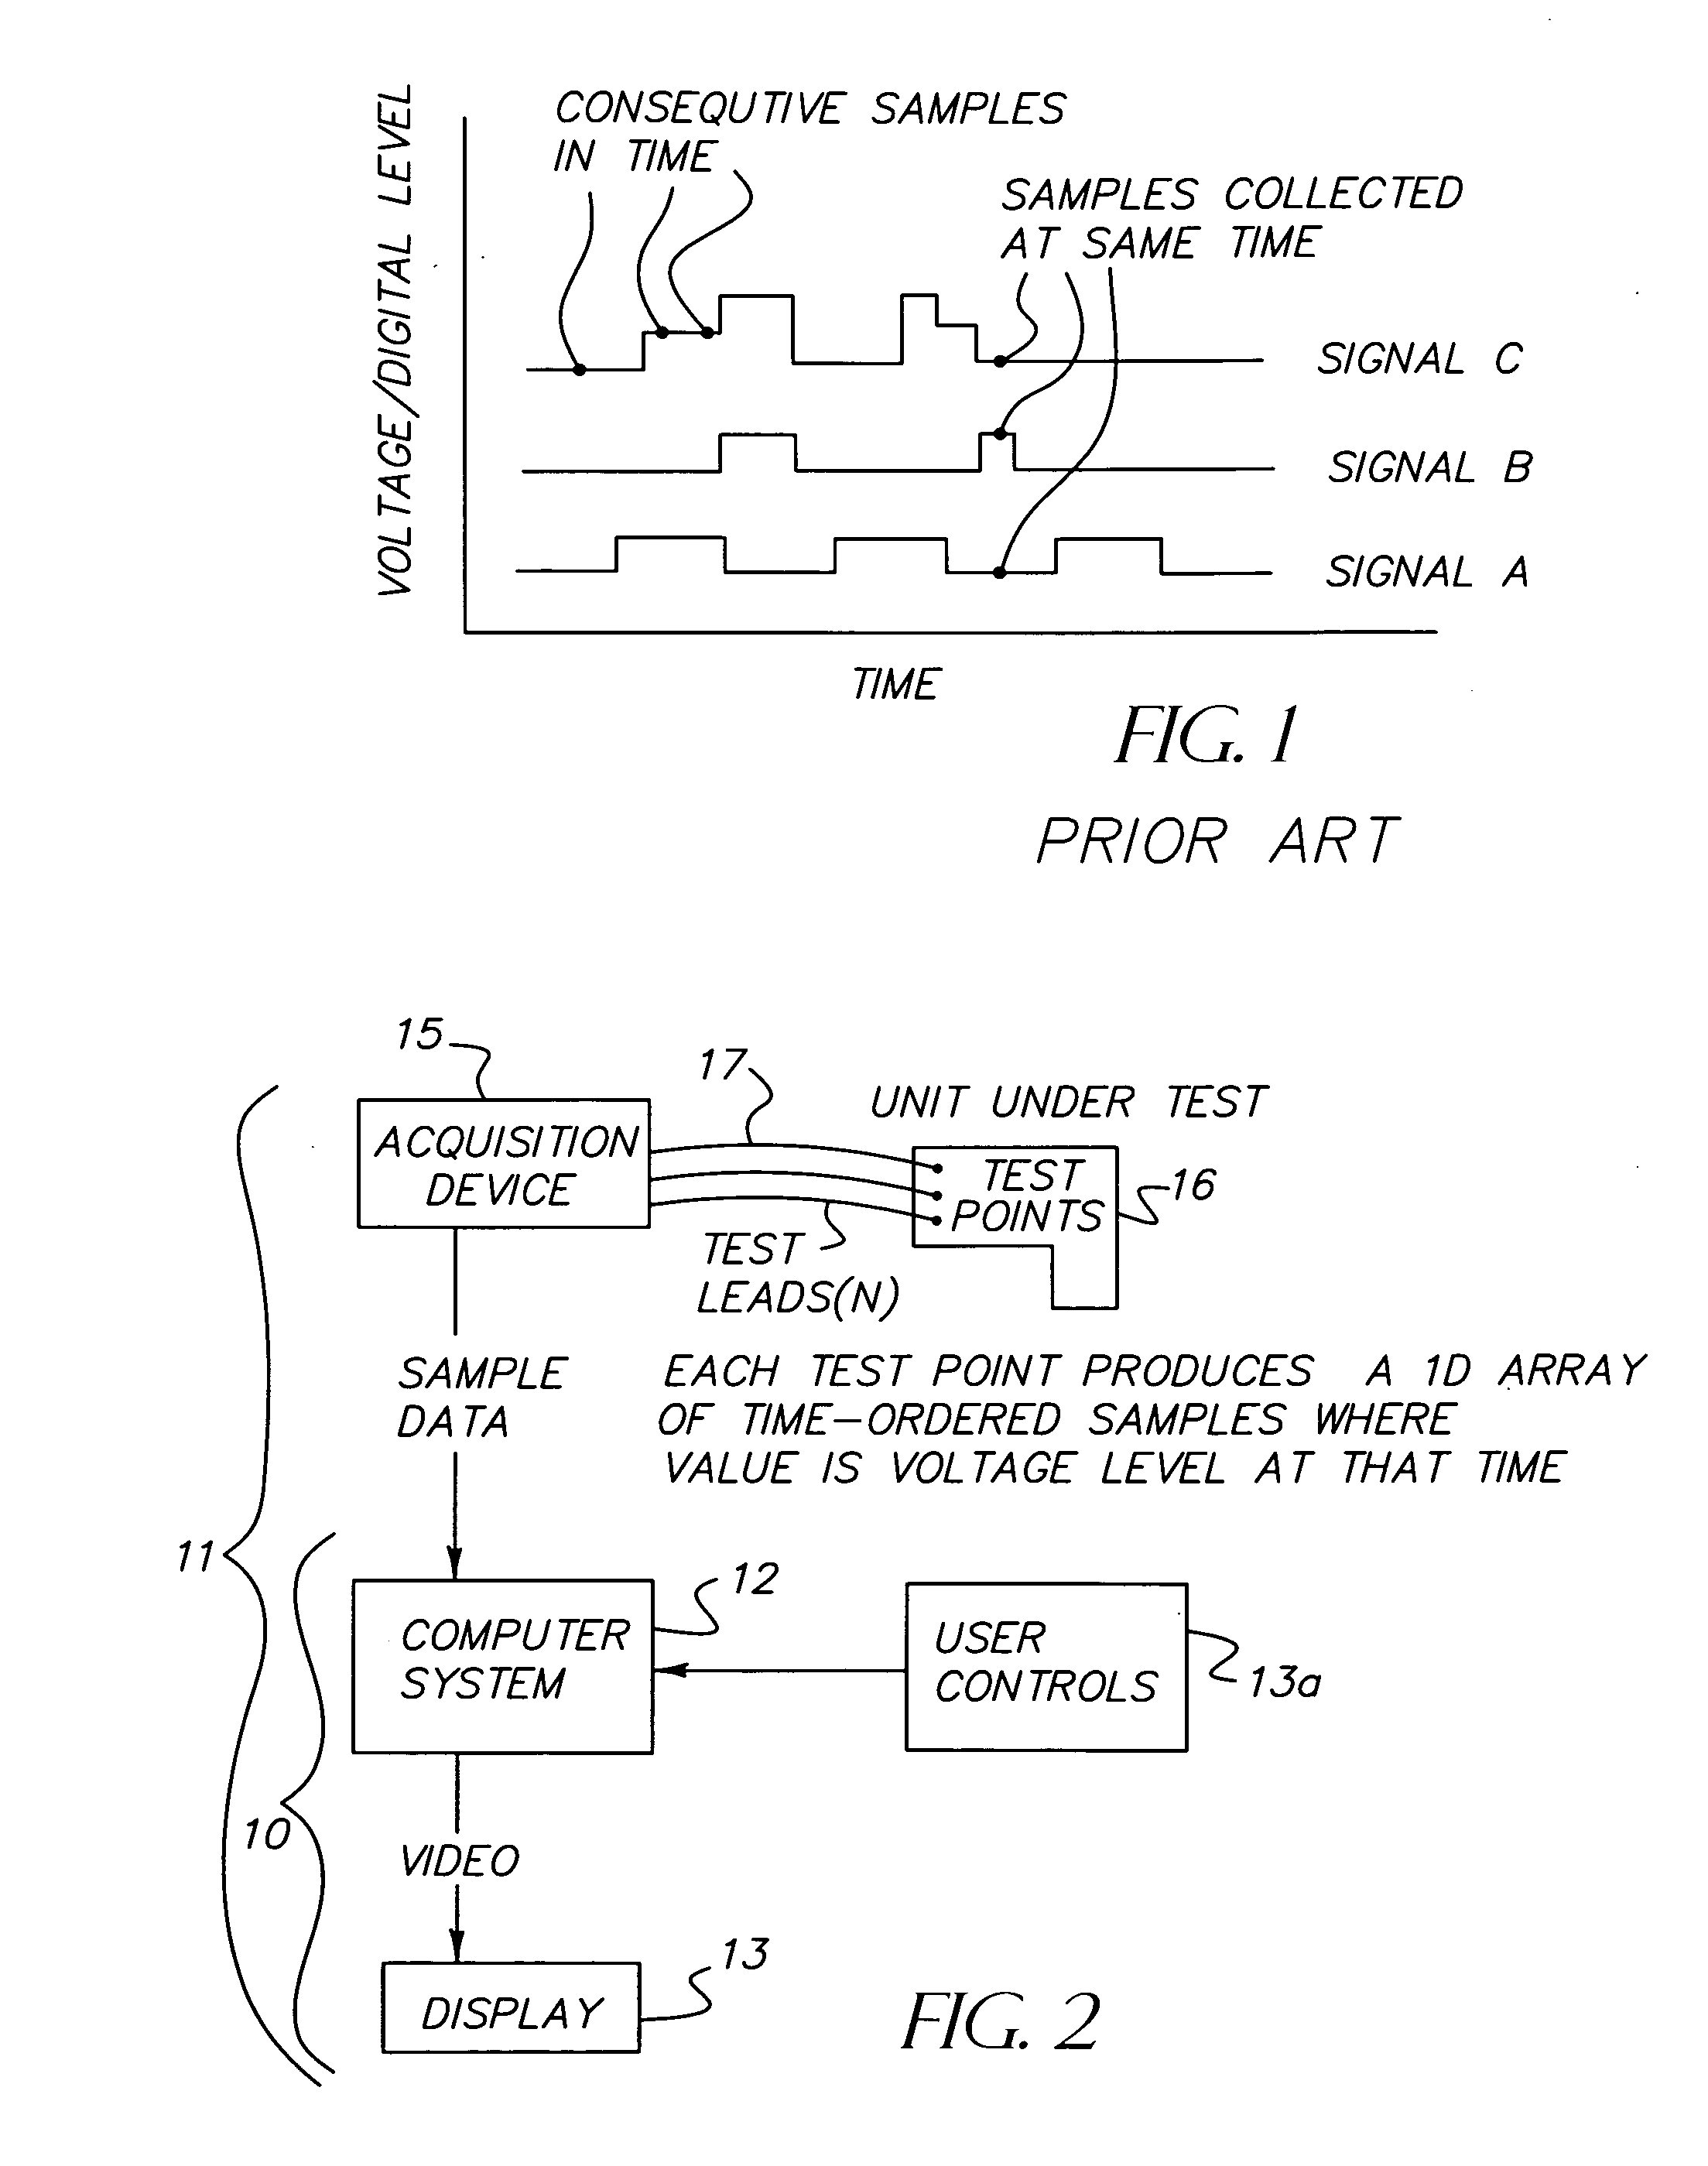
[0054]Referring to FIG. 2, the system 10 of the present invention has a computer system 12 with software in accordance with the present invention for rendering on a display 13 coupled to the computer system. The computer system 12 is connected to an acquisition device 15, such as a LeCroy Model No. MS-250 or MS-500 Mixed Signal Oscilloscope, or other logic analyzer or digital oscilloscope, receiving electrical signals from a device (or unit) 16 under test via test leads 17. For purposes of example, three leads 17 are shown for providing three electrical signals, but other number of leads may be used depending on the acquisition device 15. The acquisition device outputs digital data to the computer system 12 representing multiple channels of electrical signals received from leads 17, where each channel represents a signal from one of the leads 17 having amplitude or value over time. The analog electrical signals are converted by the acquisition device 15 into digital data format. The...


PUM


Abstract

The system for three-dimensional rendering of signals has a computer system having acquired, streaming, or previously stored data in its memory representing multiple channels of signals in which each channel has a value which varies over a domain, e.g., time or frequency, and a display coupled to the computer. For each channel, the computer system segments the data of the channel into segments, orders the segments, renders on the display each of the segments, in which each of the rendered segments are aligned in such order along a three-dimensional perspective with gaps between adjacently rendered segments, and lines are rendered extending from each line of each one of the rendered segments to form a three-dimensional plane in the gap to the next successive one of the rendered ordered segments to form a three-dimensional continuous or discontinuous surface characterizing the channel. The surfaces of each of the channels are aligned on the display, and may be of different color, shading, and translucency, whereby channels of overlaid surfaces are viewable on the display.

Description

FIELD OF THE INVENTION [0001]This present invention relates to a system (method) for three-dimensional (3-D) rendering of test and measurement signals, and relates particularly to a system for three-dimensional rendering of test and measurement signals having a computer system, or other microprocessor based platform or system which produces three-dimensional surfaces representing multiple signal channels on a display in accordance with data acquired, streaming, or previously stored in memory of the computer system. The system is useful for three-dimensional visualization of the relationship between different channels of signals with user control of three-dimensional viewing position and angle to improve signal analysis over traditional two-dimensional display of test and measurement signals. Although the system is described herein for test and measurement signals, other signals that are variable over a domain which either are in, or are separable into, multiple channels, may also be...

Claims


Application Information

Patent Timeline
IPC IPC(8): G06T15/00
CPCG01R13/0236G06T15/80G06T11/203G06T11/206G06T15/00
Inventor LOUISE, JUSTIN RALPHFRANCIS, KEVIN ROYYAW, DAVID JAMES
Owner C SPEED
Features
  • Generate Ideas
  • Intellectual Property
  • Life Sciences
  • Materials
  • Tech Scout
  • Unparalleled Data Quality
  • Higher Quality Content
  • 60% Fewer Hallucinations
Learn More