Ion detector and system
a detector and detector technology, applied in the field of ion detectors and systems, can solve the problems of inapplicability of coulometry, and inability to provide a total charge measurement in sample solution,
- Summary
- Abstract
- Description
- Claims
- Application Information
AI Technical Summary
Problems solved by technology
Method used
Image
Examples
example 1
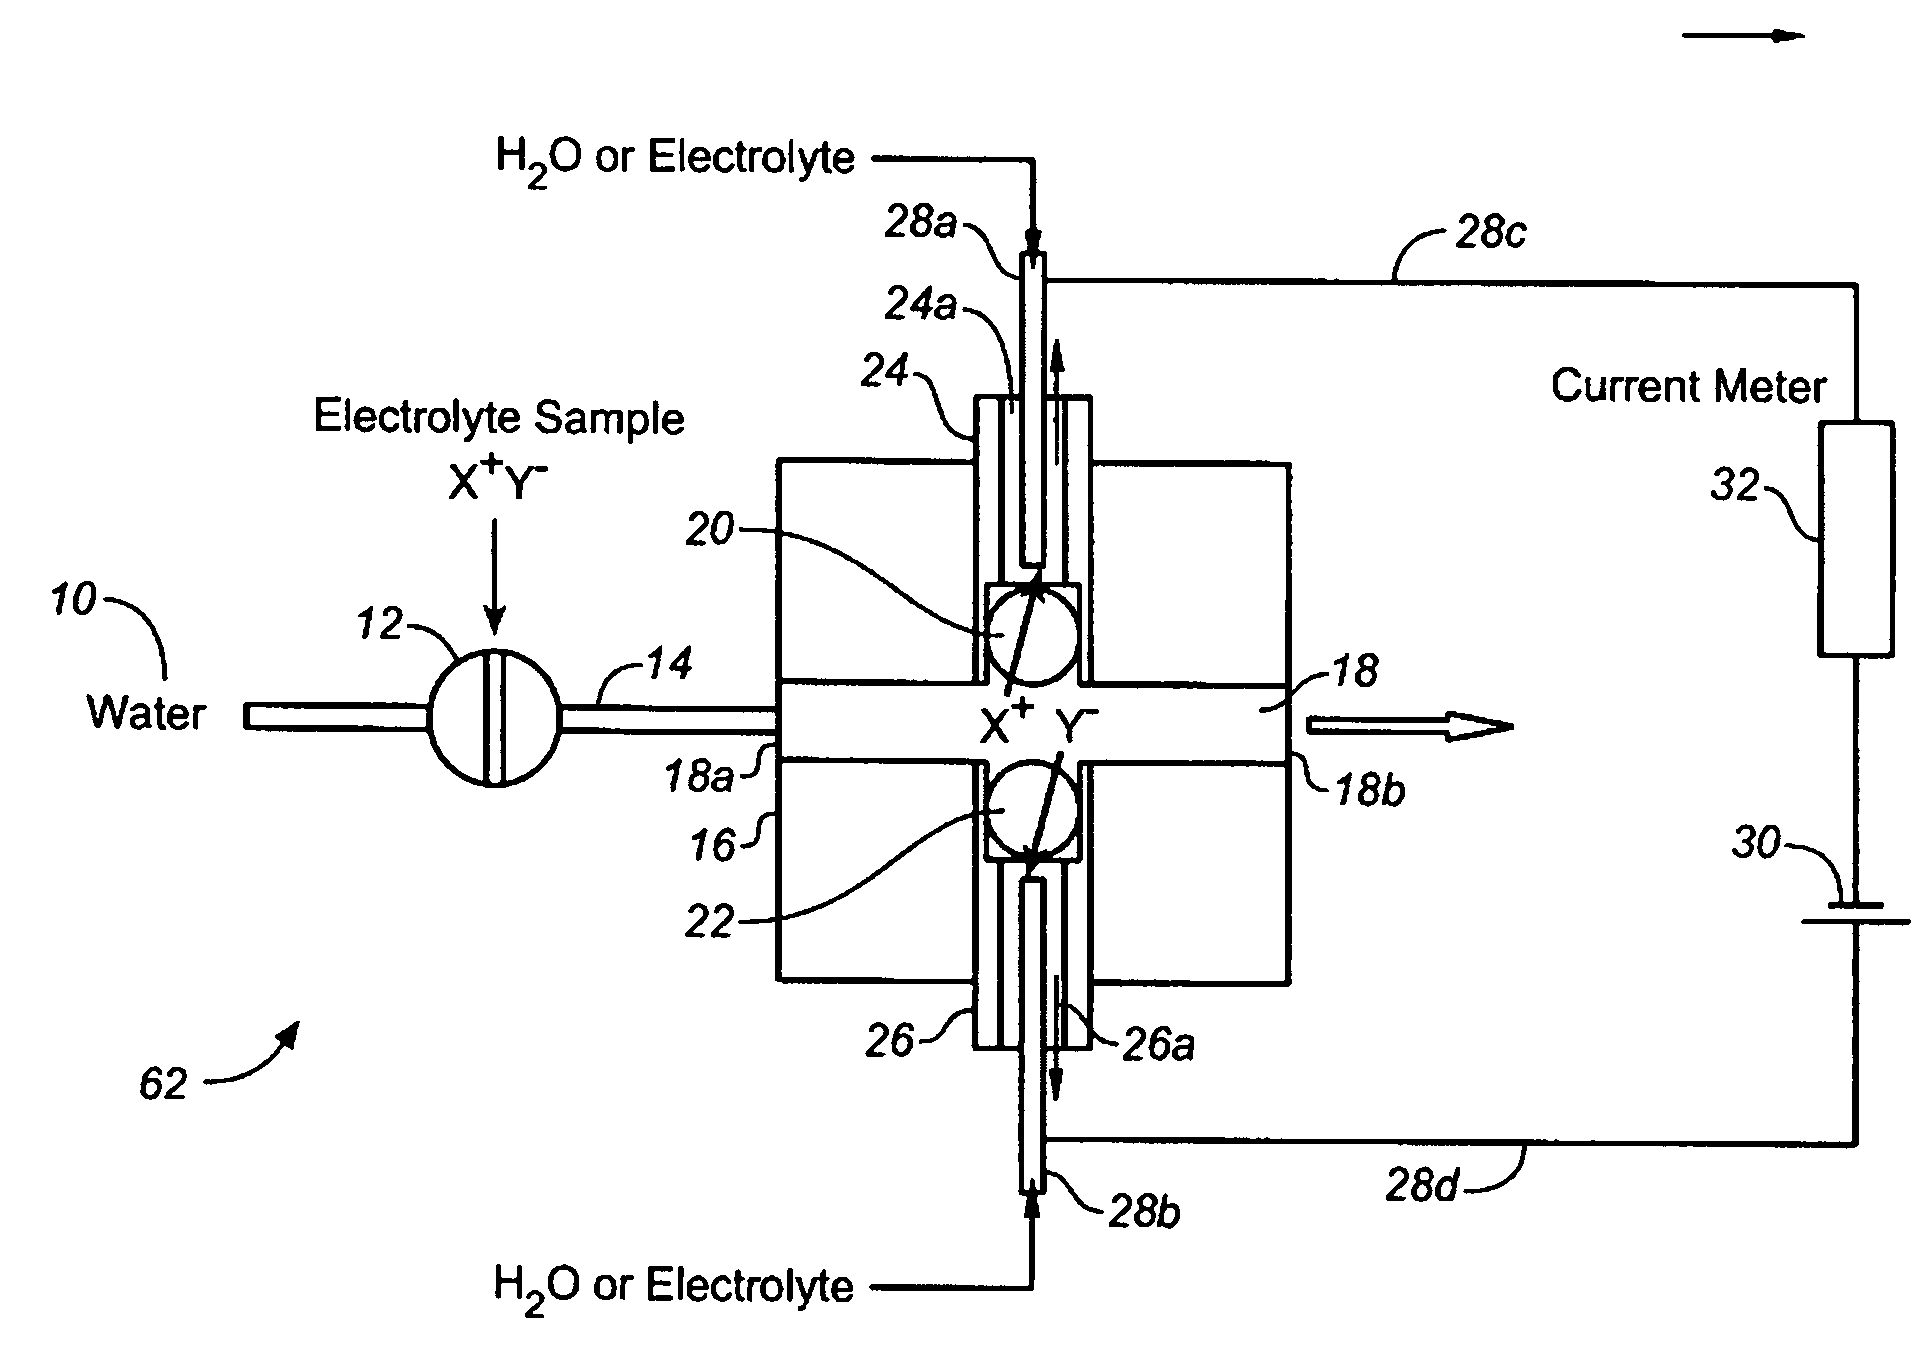
[0065]Using the device of FIG. 1, the arrangement as forward biased when the electrode behind the CER bead is positive with respect to the electrode behind AER bead and reverse biased with the opposite electrode polarity.
[0066]FIG. 10 shows the diode behavior of such devices. Trace (a) shows the i-V plot when 20 mM KOH and 1 mM H2SO4 are respectively present behind the AER / CER beads; (b) shows the case when the CER / AER electrolytes are both 10 mM KNO3. In both cases, water flows through the central channel. (As illustrated, Trace (a) is the longer plotted line on the right side of the Y-axis.
[0067]Note that in both cases (a) and (b), the device behaves as a diode. In (b), under forward-biased conditions, H+ and K+ are respectively transported through the CER bead while OH− and NO3− are respectively transported through the AER bead to form water and product KNO3 in the central channel. The H+ or Predictably, if the AER and CER beads, representing the charge-selective gates, are remov...
example 2
[0068]FIG. 11 shows the behavior of the reverse-biased ionic diode. The same volume (1 μL) of different electrolyte samples are injected into the central sample flow channel in a DI water stream flowing at 4 μL / min. The applied voltage was 14 V and the CER / AER electrolytes were 20 mM KNO3. It will be noted that equivalent amounts of NaNO3, KCl, HNO3, BaCl2, or K3PO4 all have the same signal (the peak area of the individual responses shown are 194±16 microcoulombs), very different from that of a conductivity detector [10]. The advantage of the same response for equimolar quantities of various salts is that a universal calibration becomes feasible and only one analyte needs to be used for the calibration aspect. This greatly reduces the standard preparation and run time during calibration.
example 3
[0069]FIG. 12 shows optimization studies of response versus flow rate. A 1 μL sample of 0.8 mM KCl was injected. The effluent conductivity for 3 μL / min flow rate is shown. As the detector signal reaches a plateau, the effluent is deionized. For clarity, the standard deviation is shown only for the 3 μL / min data, others are comparable. At a given flow rate, the peak area increases with increasing electric field (applied voltage) and reaches a plateau value until all the charge is transferred. It will be understood that the necessary electric field to reach this plateau is dependent on the residence time and as shown in FIG. 12, the plateau is attained at lower applied voltages as the residence time increases. Not shown here is the corollary case that at a fixed applied voltage, peak area reaches a constant plateau value as flow rate is decreased.
PUM
| Property | Measurement | Unit |
|---|---|---|
| voltage | aaaaa | aaaaa |
| voltage | aaaaa | aaaaa |
| voltage | aaaaa | aaaaa |
Abstract
Description
Claims
Application Information
 - R&D
- Intellectual Property
- Life Sciences
- Materials
- Tech Scout
- Unparalleled Data Quality
- Higher Quality Content
- 60% Fewer Hallucinations
Browse by: Latest US Patents, China's latest patents, Technical Efficacy Thesaurus, Application Domain, Technology Topic, Popular Technical Reports.
© 2025 PatSnap. All rights reserved.Legal|Privacy policy|Modern Slavery Act Transparency Statement|Sitemap|About US| Contact US: help@patsnap.com


