Physiogenomic Method for Predicting Metabolic and Cardiovascular Side Effects of Thiazolidinediones
a physiogenomic method and metabolic and cardiovascular technology, applied in biochemistry apparatus and processes, fermentation, organic chemistry, etc., can solve the problems of increasing healthcare costs, burdening medical management, and reducing patient compliance, so as to and increase body mass index or edema
- Summary
- Abstract
- Description
- Claims
- Application Information
AI Technical Summary
Benefits of technology
Problems solved by technology
Method used
Image
Examples
example 1
Physigenomics Analysis
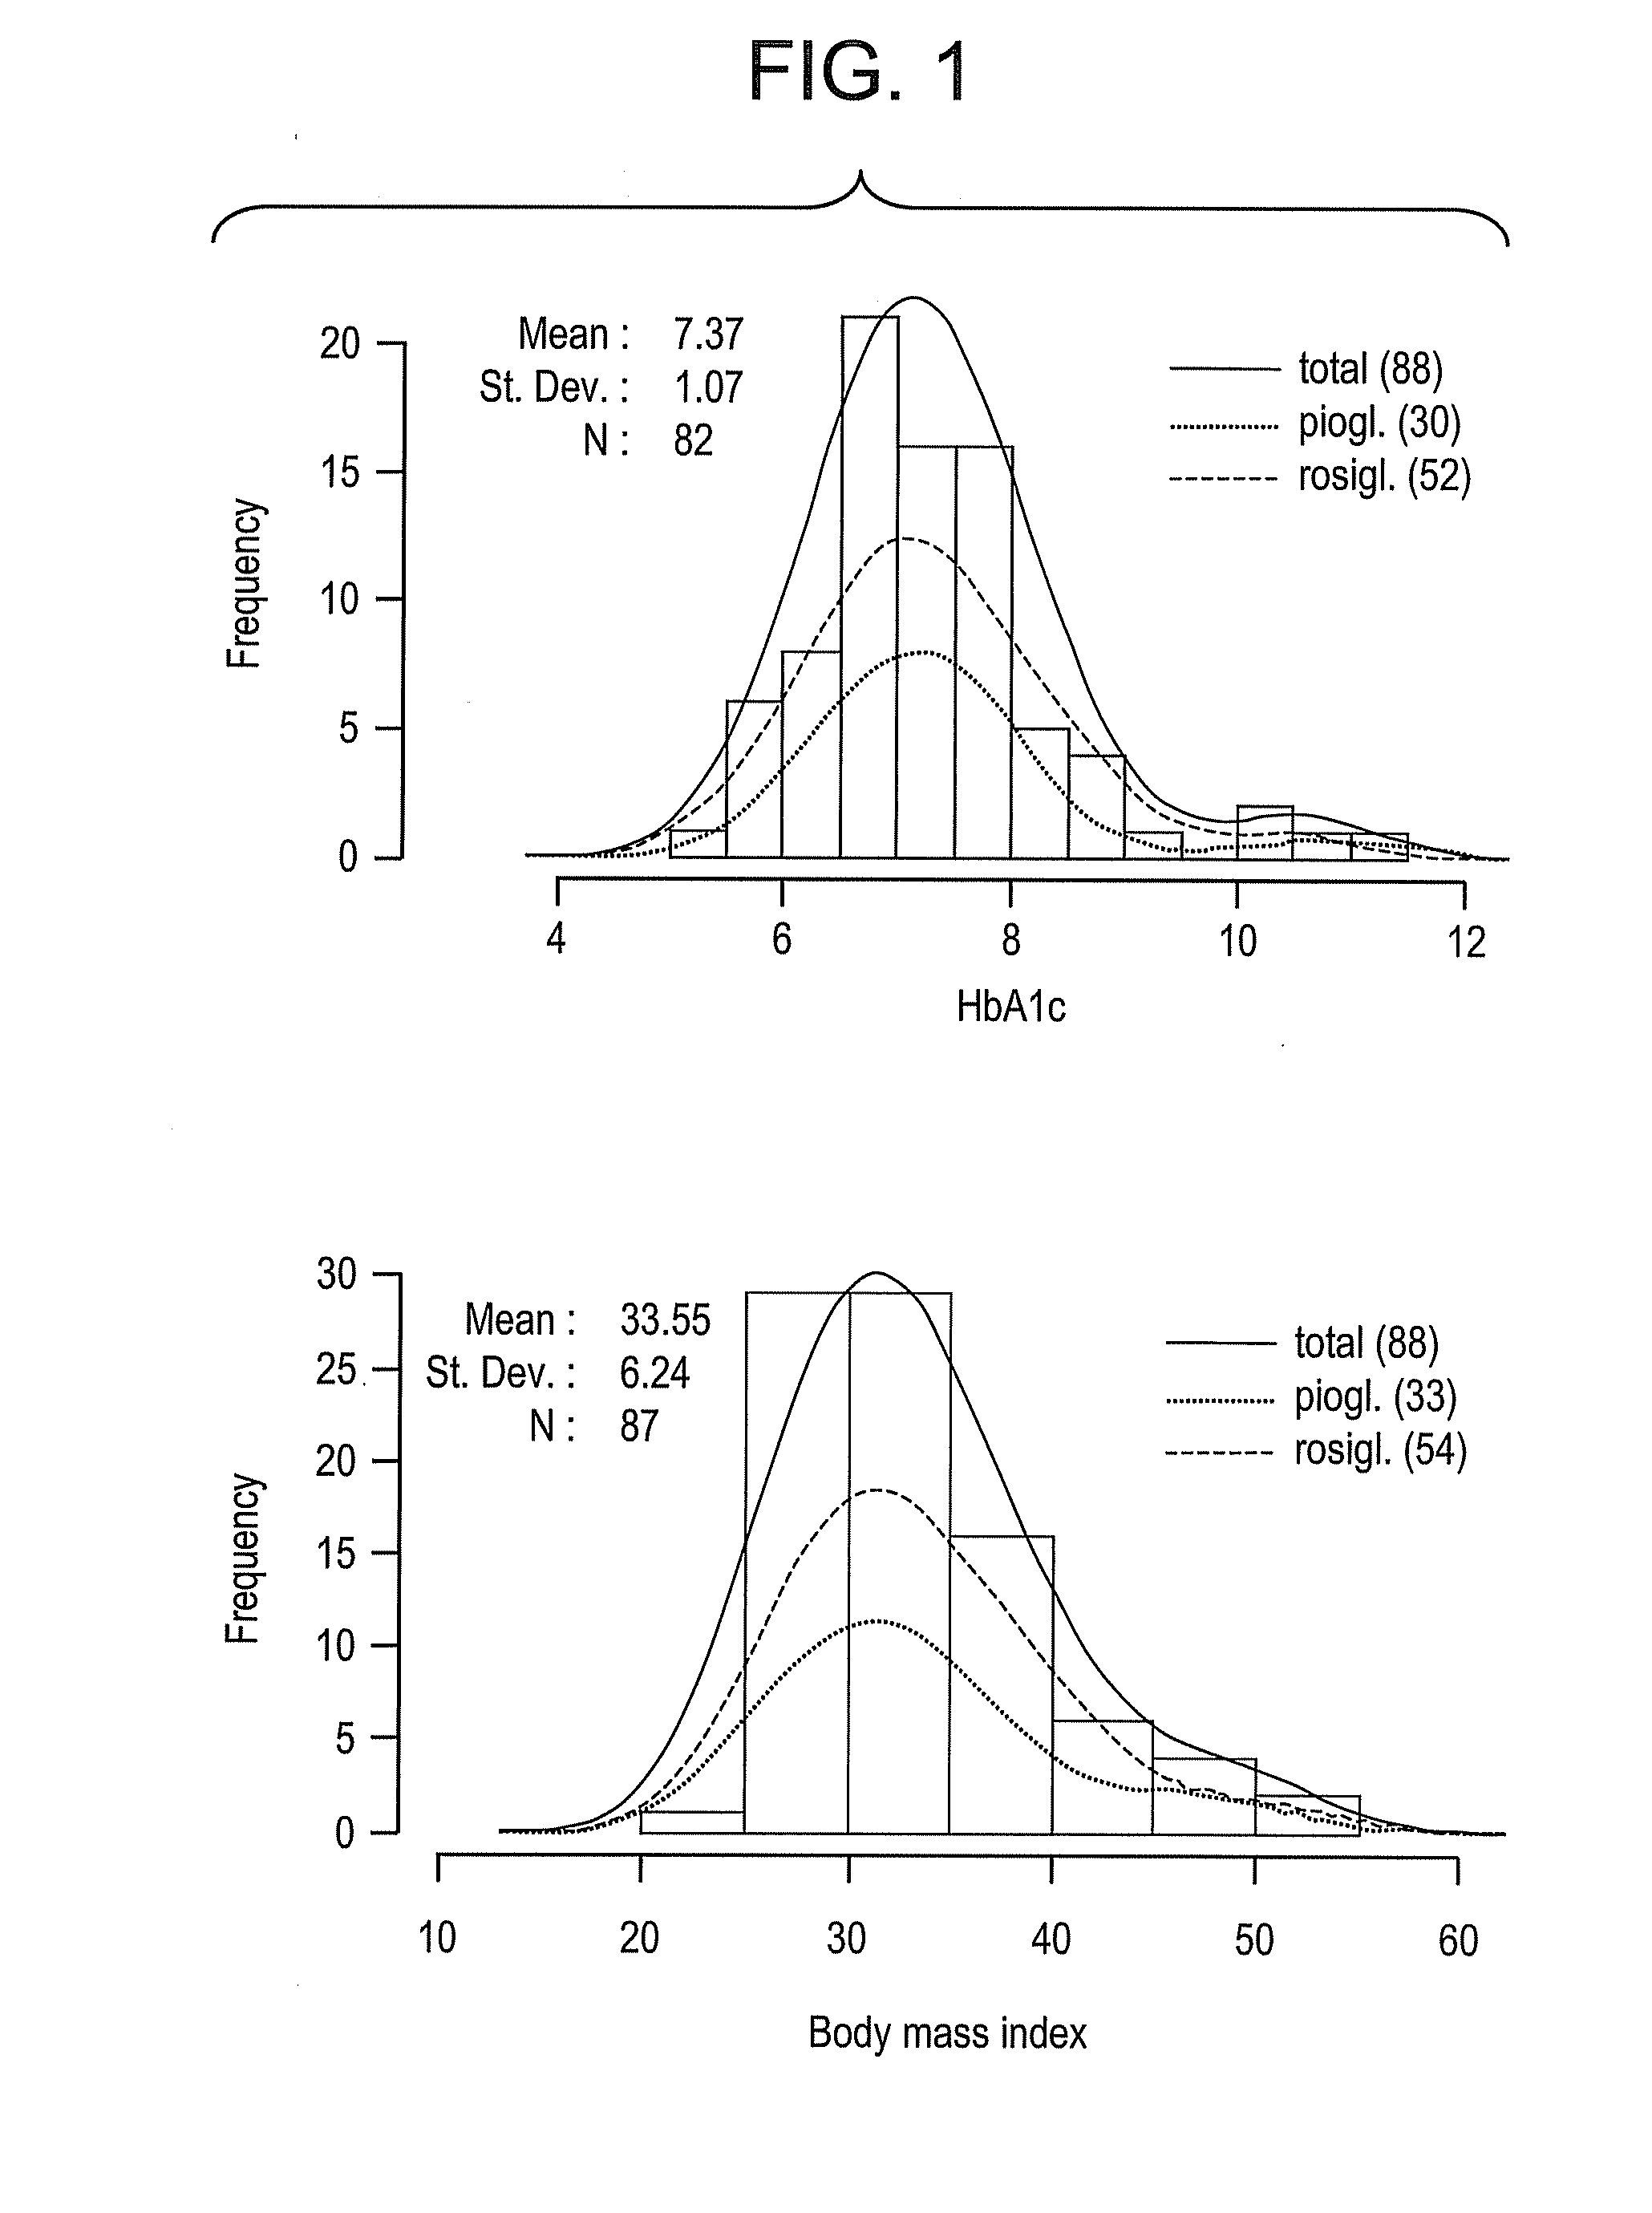
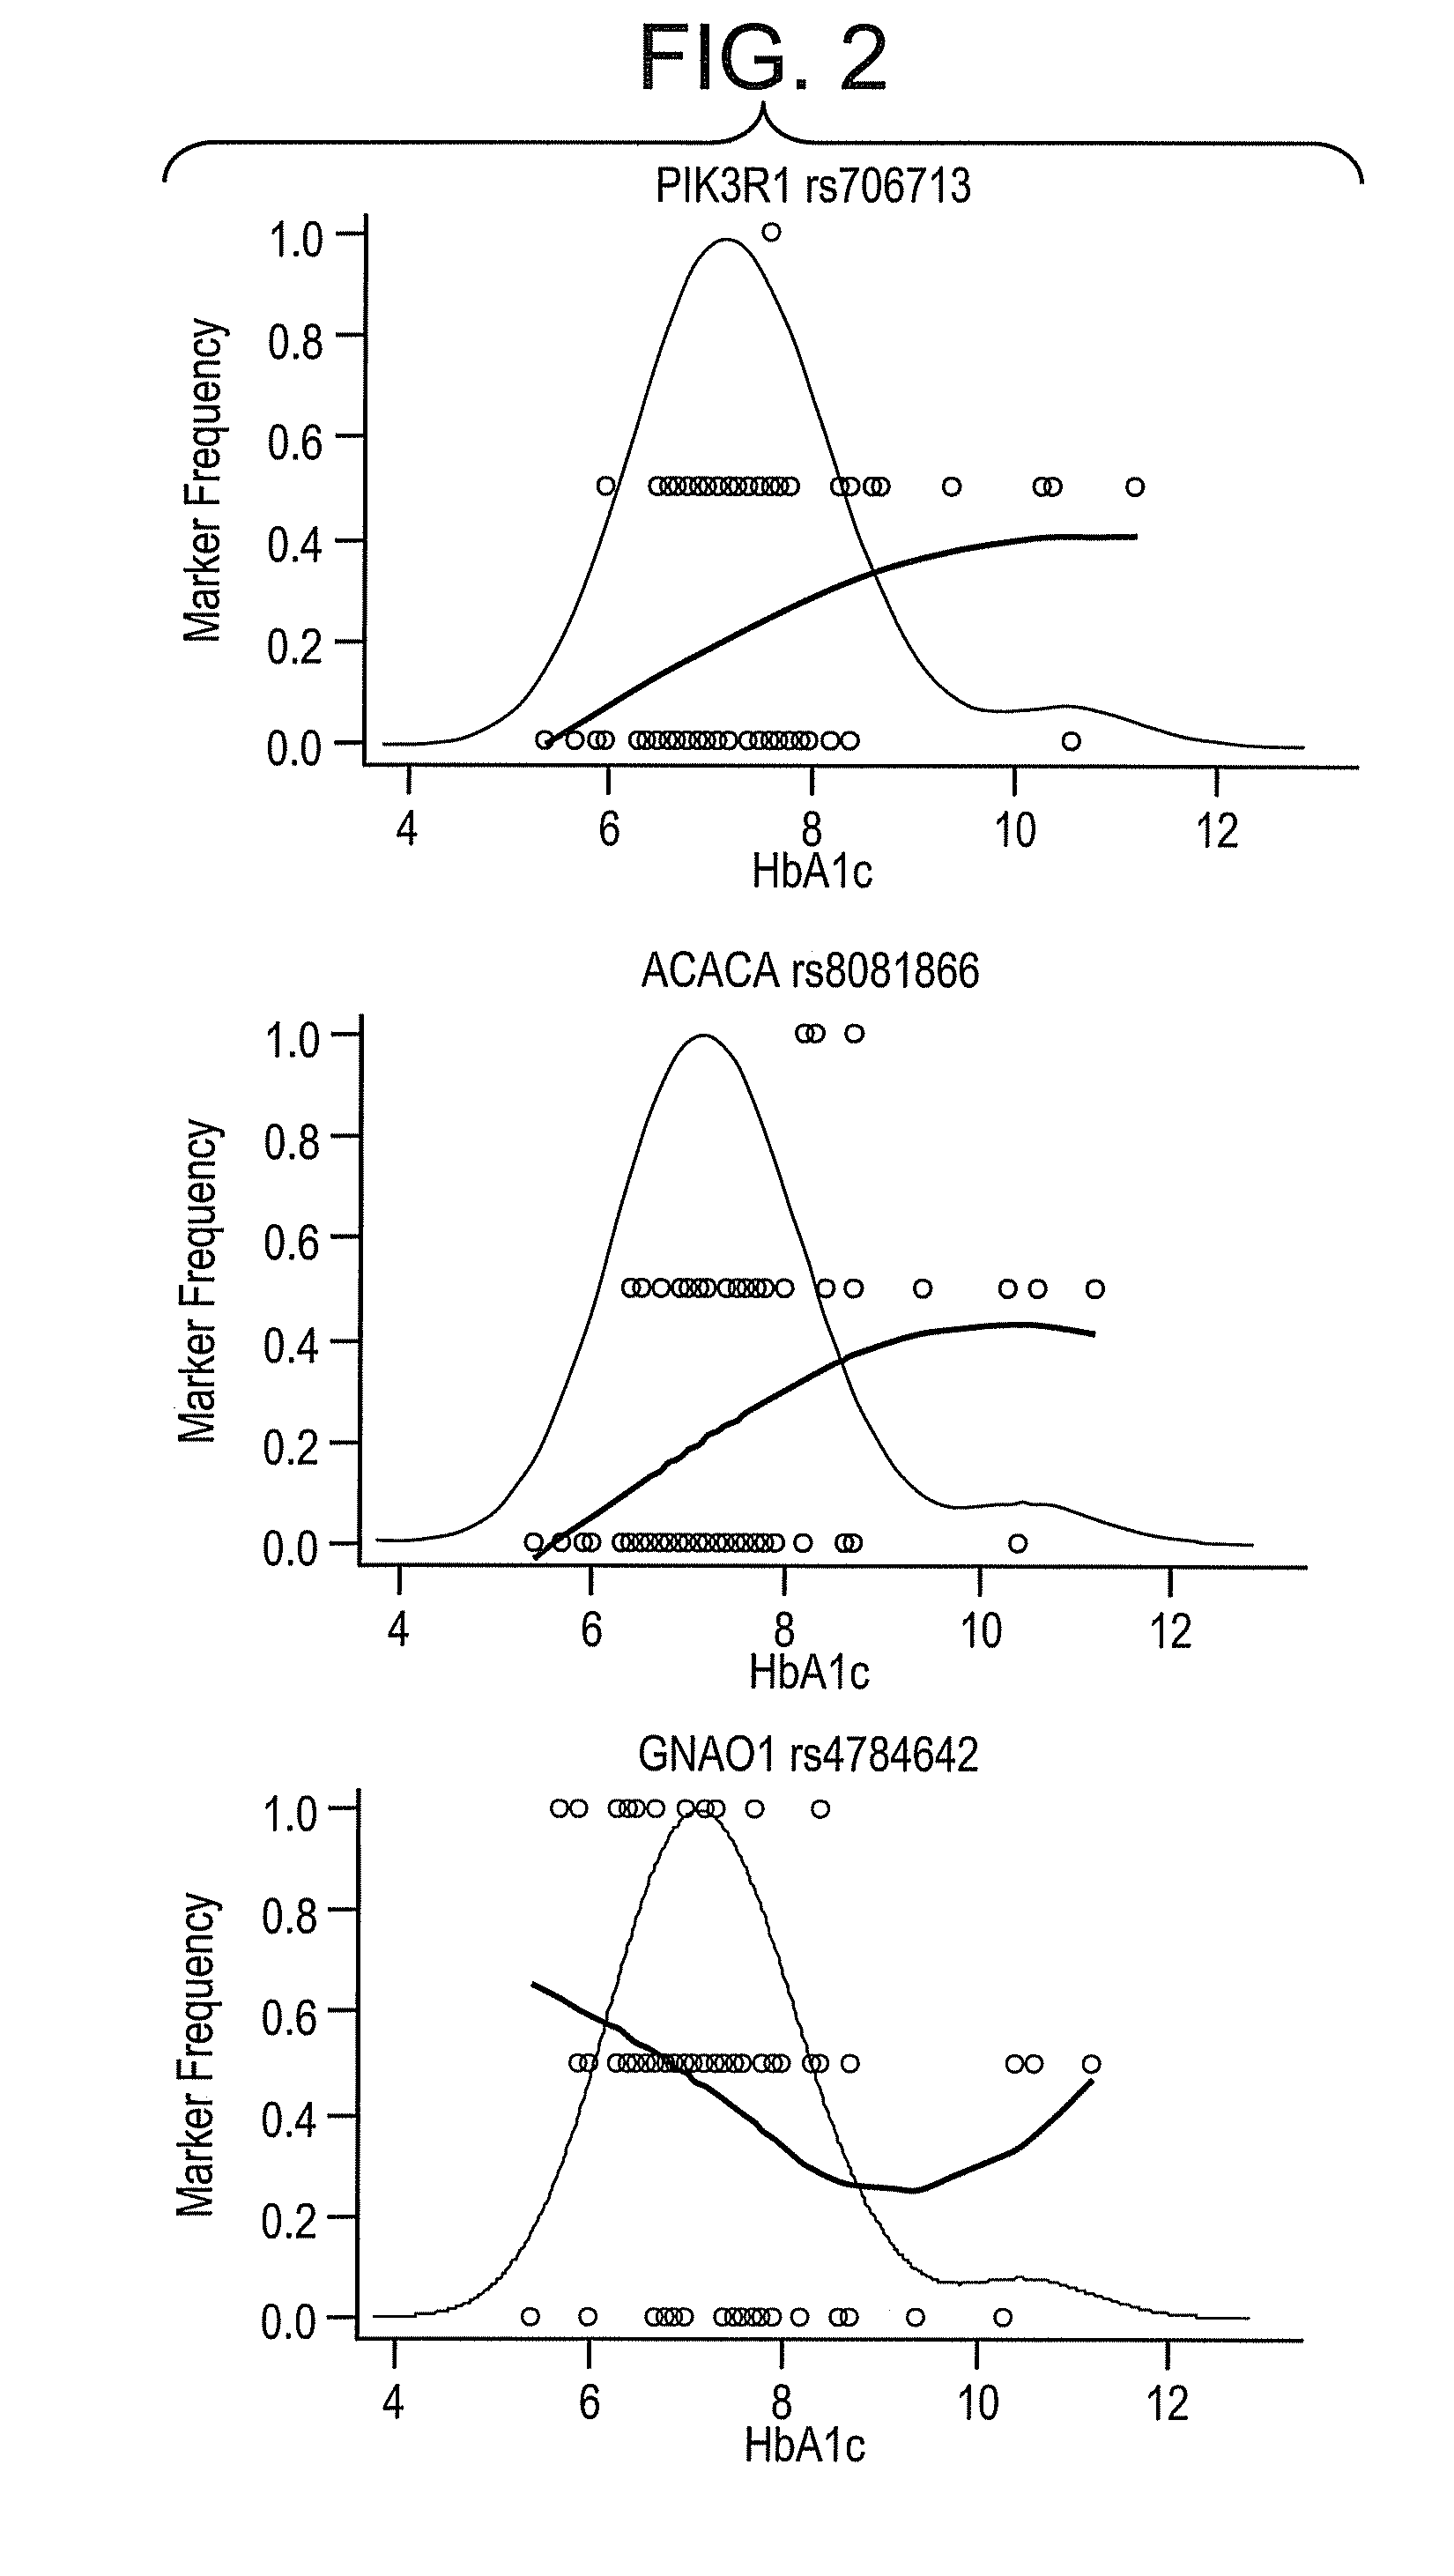
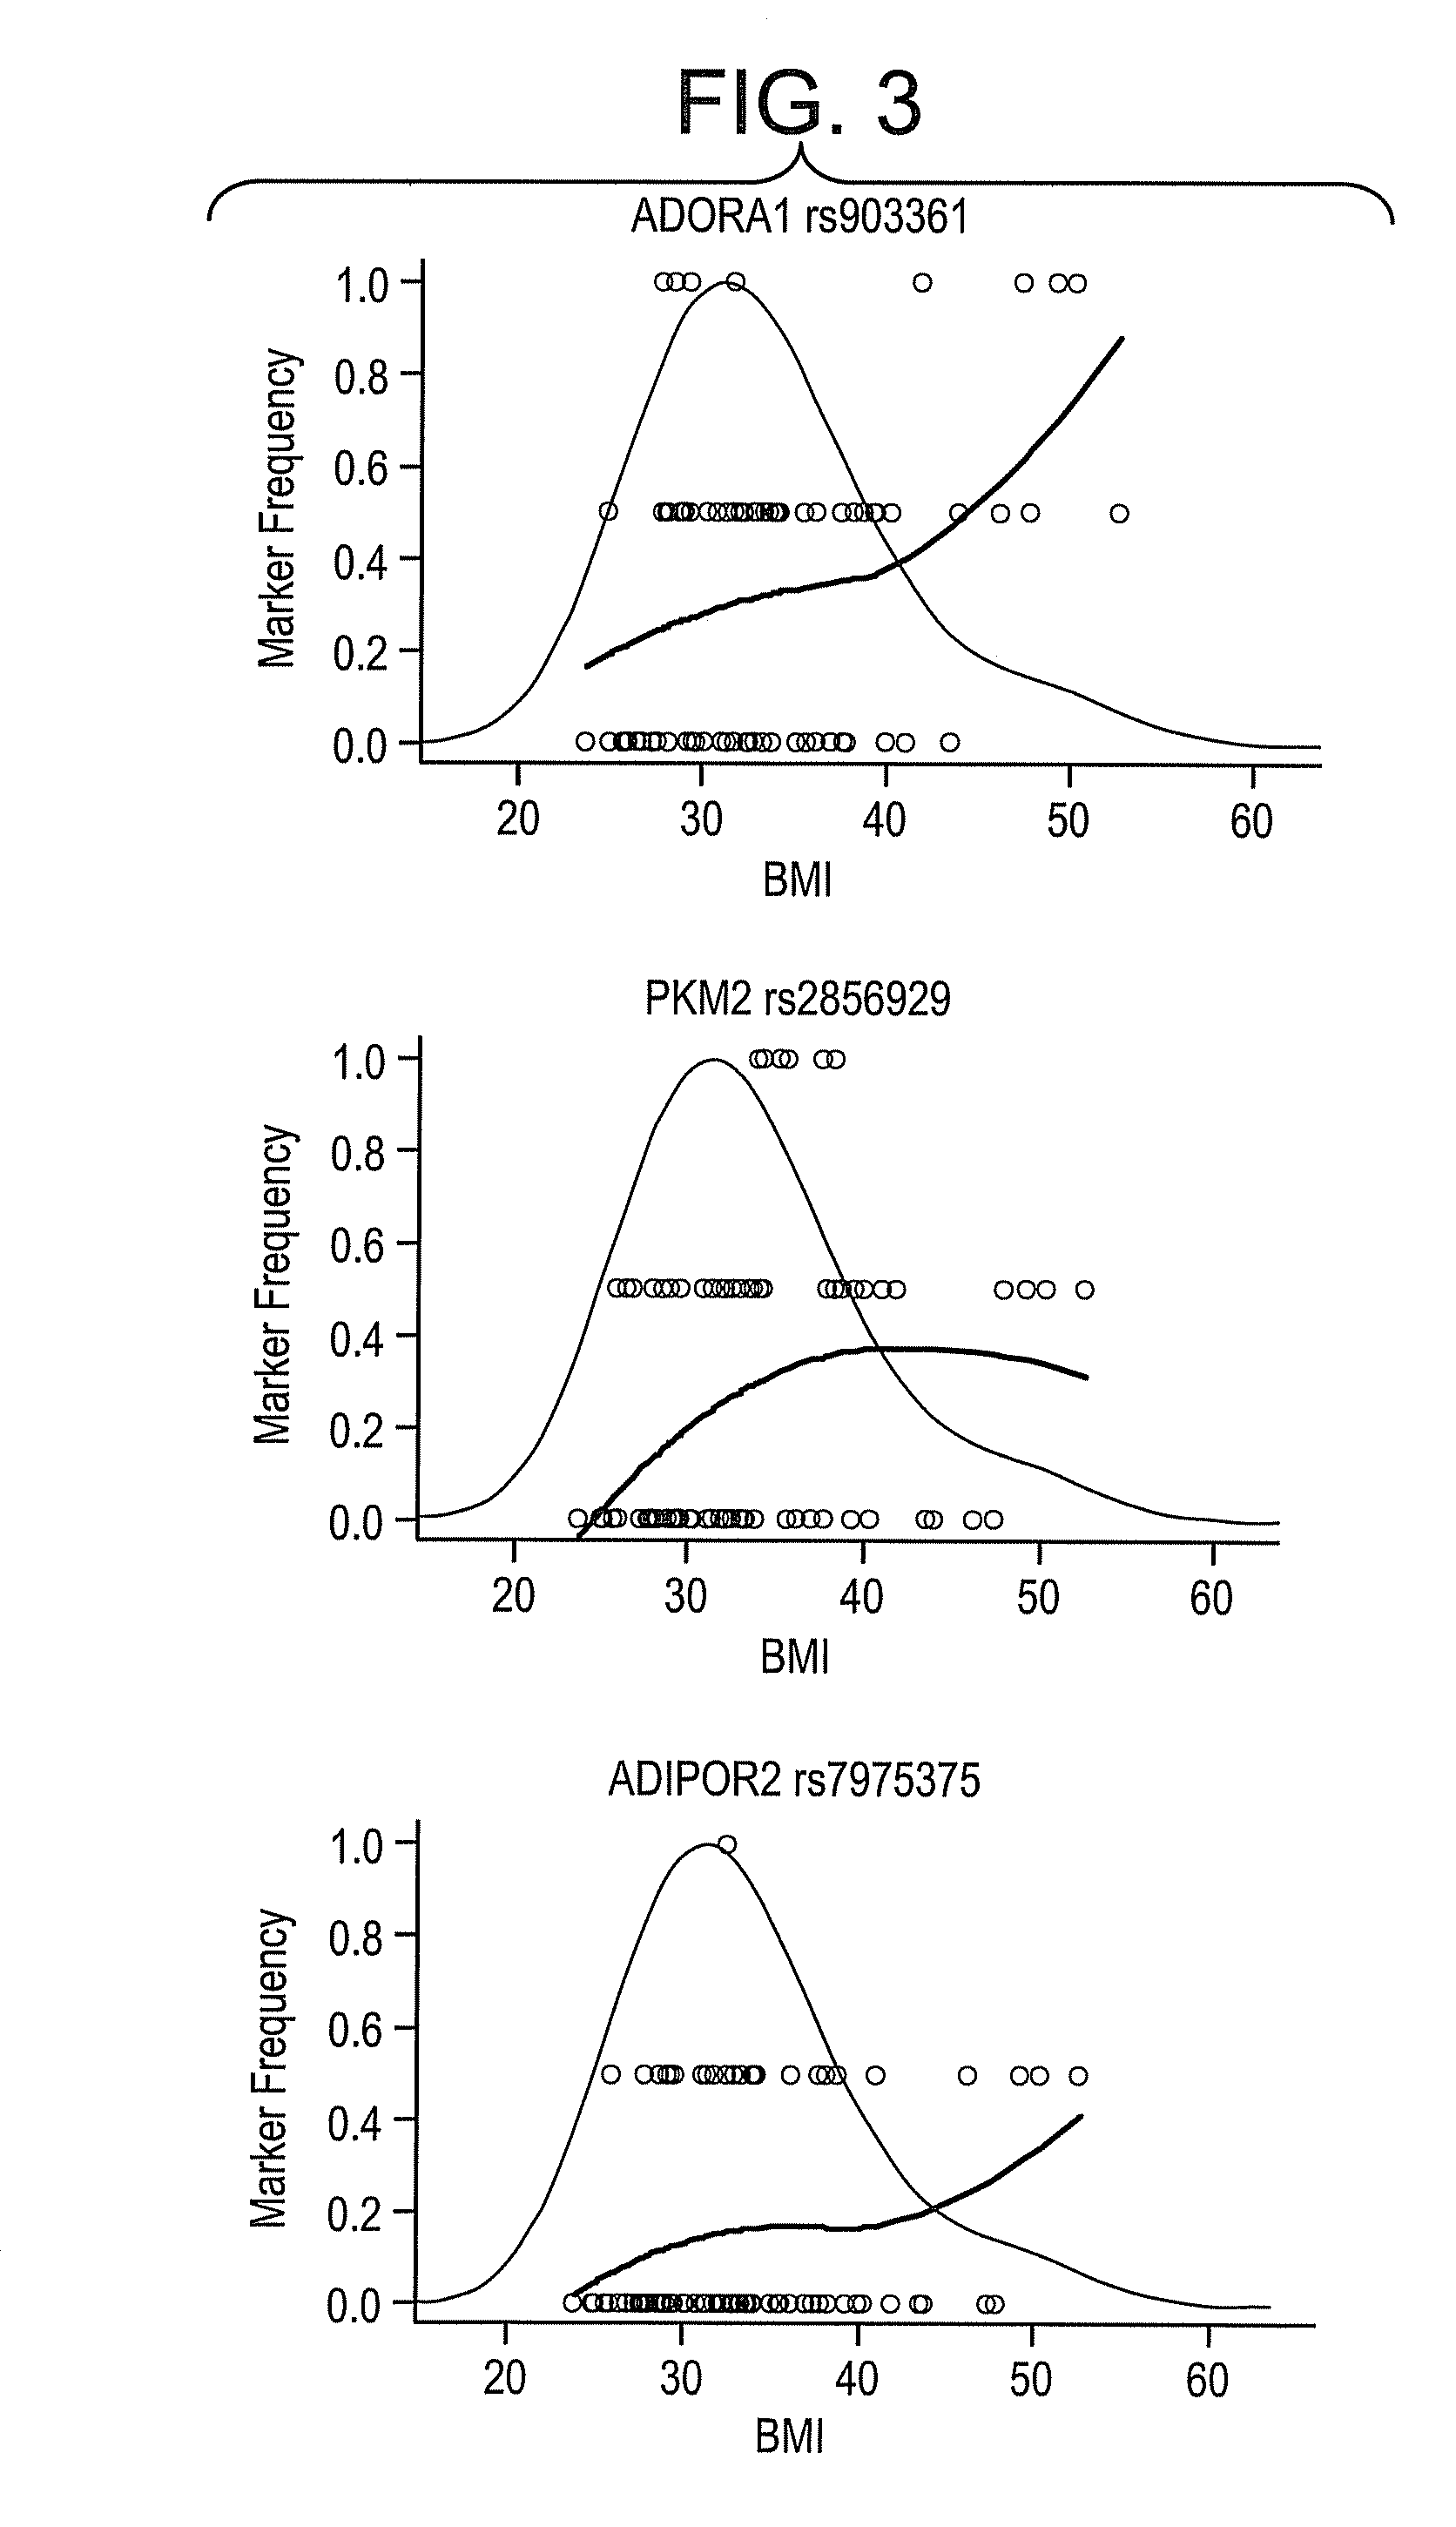
[0074]A total of 346 SNPs were tested for association of minor allele copy number (0, 1, or 2) with the covariate adjusted endpoints using linear regression. The SNPs were ranked by the F-statistic p-value of the genotype coefficient, and false discovery rates (FDR) were calculated. Tables 4-6 show the 5 most significant associations for the 3 phenotypes.
TABLE 4Top 5 SNP associations to HbA1c.SNPGenep-valueFDRSNP typeGene Namers706713PIK3R10.0010.35exon 1, Y73Yphosphoinositide-3-kinase, regulatory subunit 1rs8081866ACACA0.0120.99intron 28acetyl-Coenzyme A carboxylase alphars4784642GNAO10.0130.992 kb upstreamG protein, alpha activating activity polypeptide Ors5369EDN10.0140.99exon 3, E106Eendothelin 1rs4804103INSR0.0161.00intron 2insulin receptor
TABLE 5Top 5 SNP associations to BMI.SNPGenep-valueFDRSNP typeGene Namers903361ADORA13E−040.10intron 2adenosine A1 receptorrs2856929PKM20.0020.55intron 7pyruvate kinase, musclers7975375ADIPOR20.0070.92intron 1adiponectin...
example 2
Physiogenomic Comparison of BMI and Edema Profiles
[0078]The side effects BMI and edema for common and distinct SNP associations were compared. To illustrate how physiogenomics analysis discriminates between these phenotypes, FIG. 5 plots the comparative significance of SNP associations with edema (ordinate) and BMI (abscissa). Gene markers clustered in the sector at the origin are not significantly associated with either phenotype. Gene markers in the upper right quadrant convey risk. Those found in the uppermost shaded sector are risk factors for edema, whereas those in the rightmost shaded sector are risk factors for BMI. Gene markers in the lower left quadrant are protective. Those found in the lowermost shaded sector are protective for edema, whereas those in the leftmost shaded sector are protective for BMI. Markers adjoining the tips of the shaded sectors approximate significance for both edema and BMI. There were no markers protective for one phenotype and conveying risk for...
PUM
| Property | Measurement | Unit |
|---|---|---|
| mean weight | aaaaa | aaaaa |
| body mass index | aaaaa | aaaaa |
| reverse insulin resistance | aaaaa | aaaaa |
Abstract
Description
Claims
Application Information
 - R&D
- Intellectual Property
- Life Sciences
- Materials
- Tech Scout
- Unparalleled Data Quality
- Higher Quality Content
- 60% Fewer Hallucinations
Browse by: Latest US Patents, China's latest patents, Technical Efficacy Thesaurus, Application Domain, Technology Topic, Popular Technical Reports.
© 2025 PatSnap. All rights reserved.Legal|Privacy policy|Modern Slavery Act Transparency Statement|Sitemap|About US| Contact US: help@patsnap.com


