Spectroscopic analysis methods

a spectroscopic and analysis method technology, applied in the field of spectroscopic apparatus and methods, can solve the problems of inability to successfully use techniques, inconvenient image analysis, and complex task of creating images

Active Publication Date: 2010-02-04
RENISHAW PLC
View PDF2 Cites 19 Cited by
  • Summary
  • Abstract
  • Description
  • Claims
  • Application Information

AI Technical Summary

Benefits of technology

[0014]making an initial estimate of spectral values of at least one further component of the sample, and performing an iterative resolut

Problems solved by technology

Creating these images can be a complex task.
These methods require knowledge of the compounds present in the sample and their pure spectra, and problems occur if the spectra overlap and no intensities at a frequency can be clearly assigned to one spectrum.
However, if incomplete or no knowledge of the compounds present is available, this technique cannot be used successfully.
Some of these were developed to use evolving properties of a data set (e.g. evolving factor analysis (EFA), fixed size moving window—evolving factor analysis (FSW-EFA), and window factor analysis) but these are not well suited for

Method used


Image

  • Spectroscopic analysis methods
  • Spectroscopic analysis methods
  • Spectroscopic analysis methods

Examples


example i

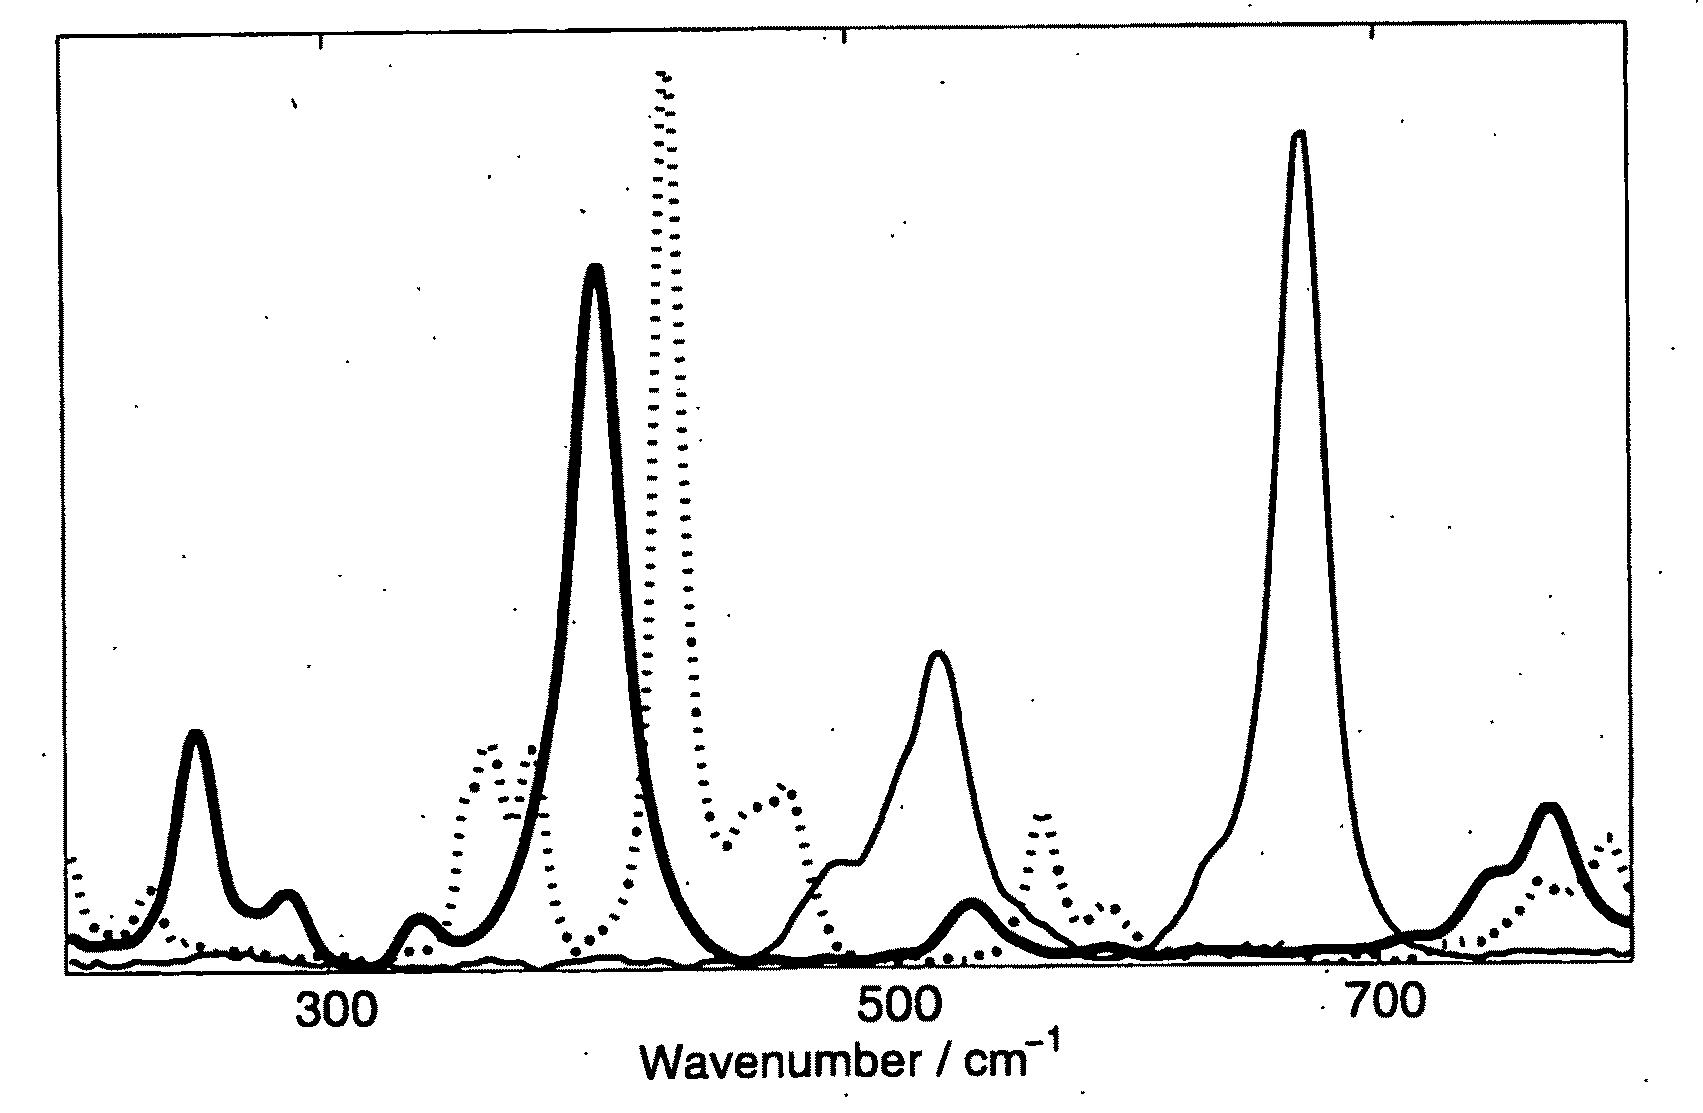
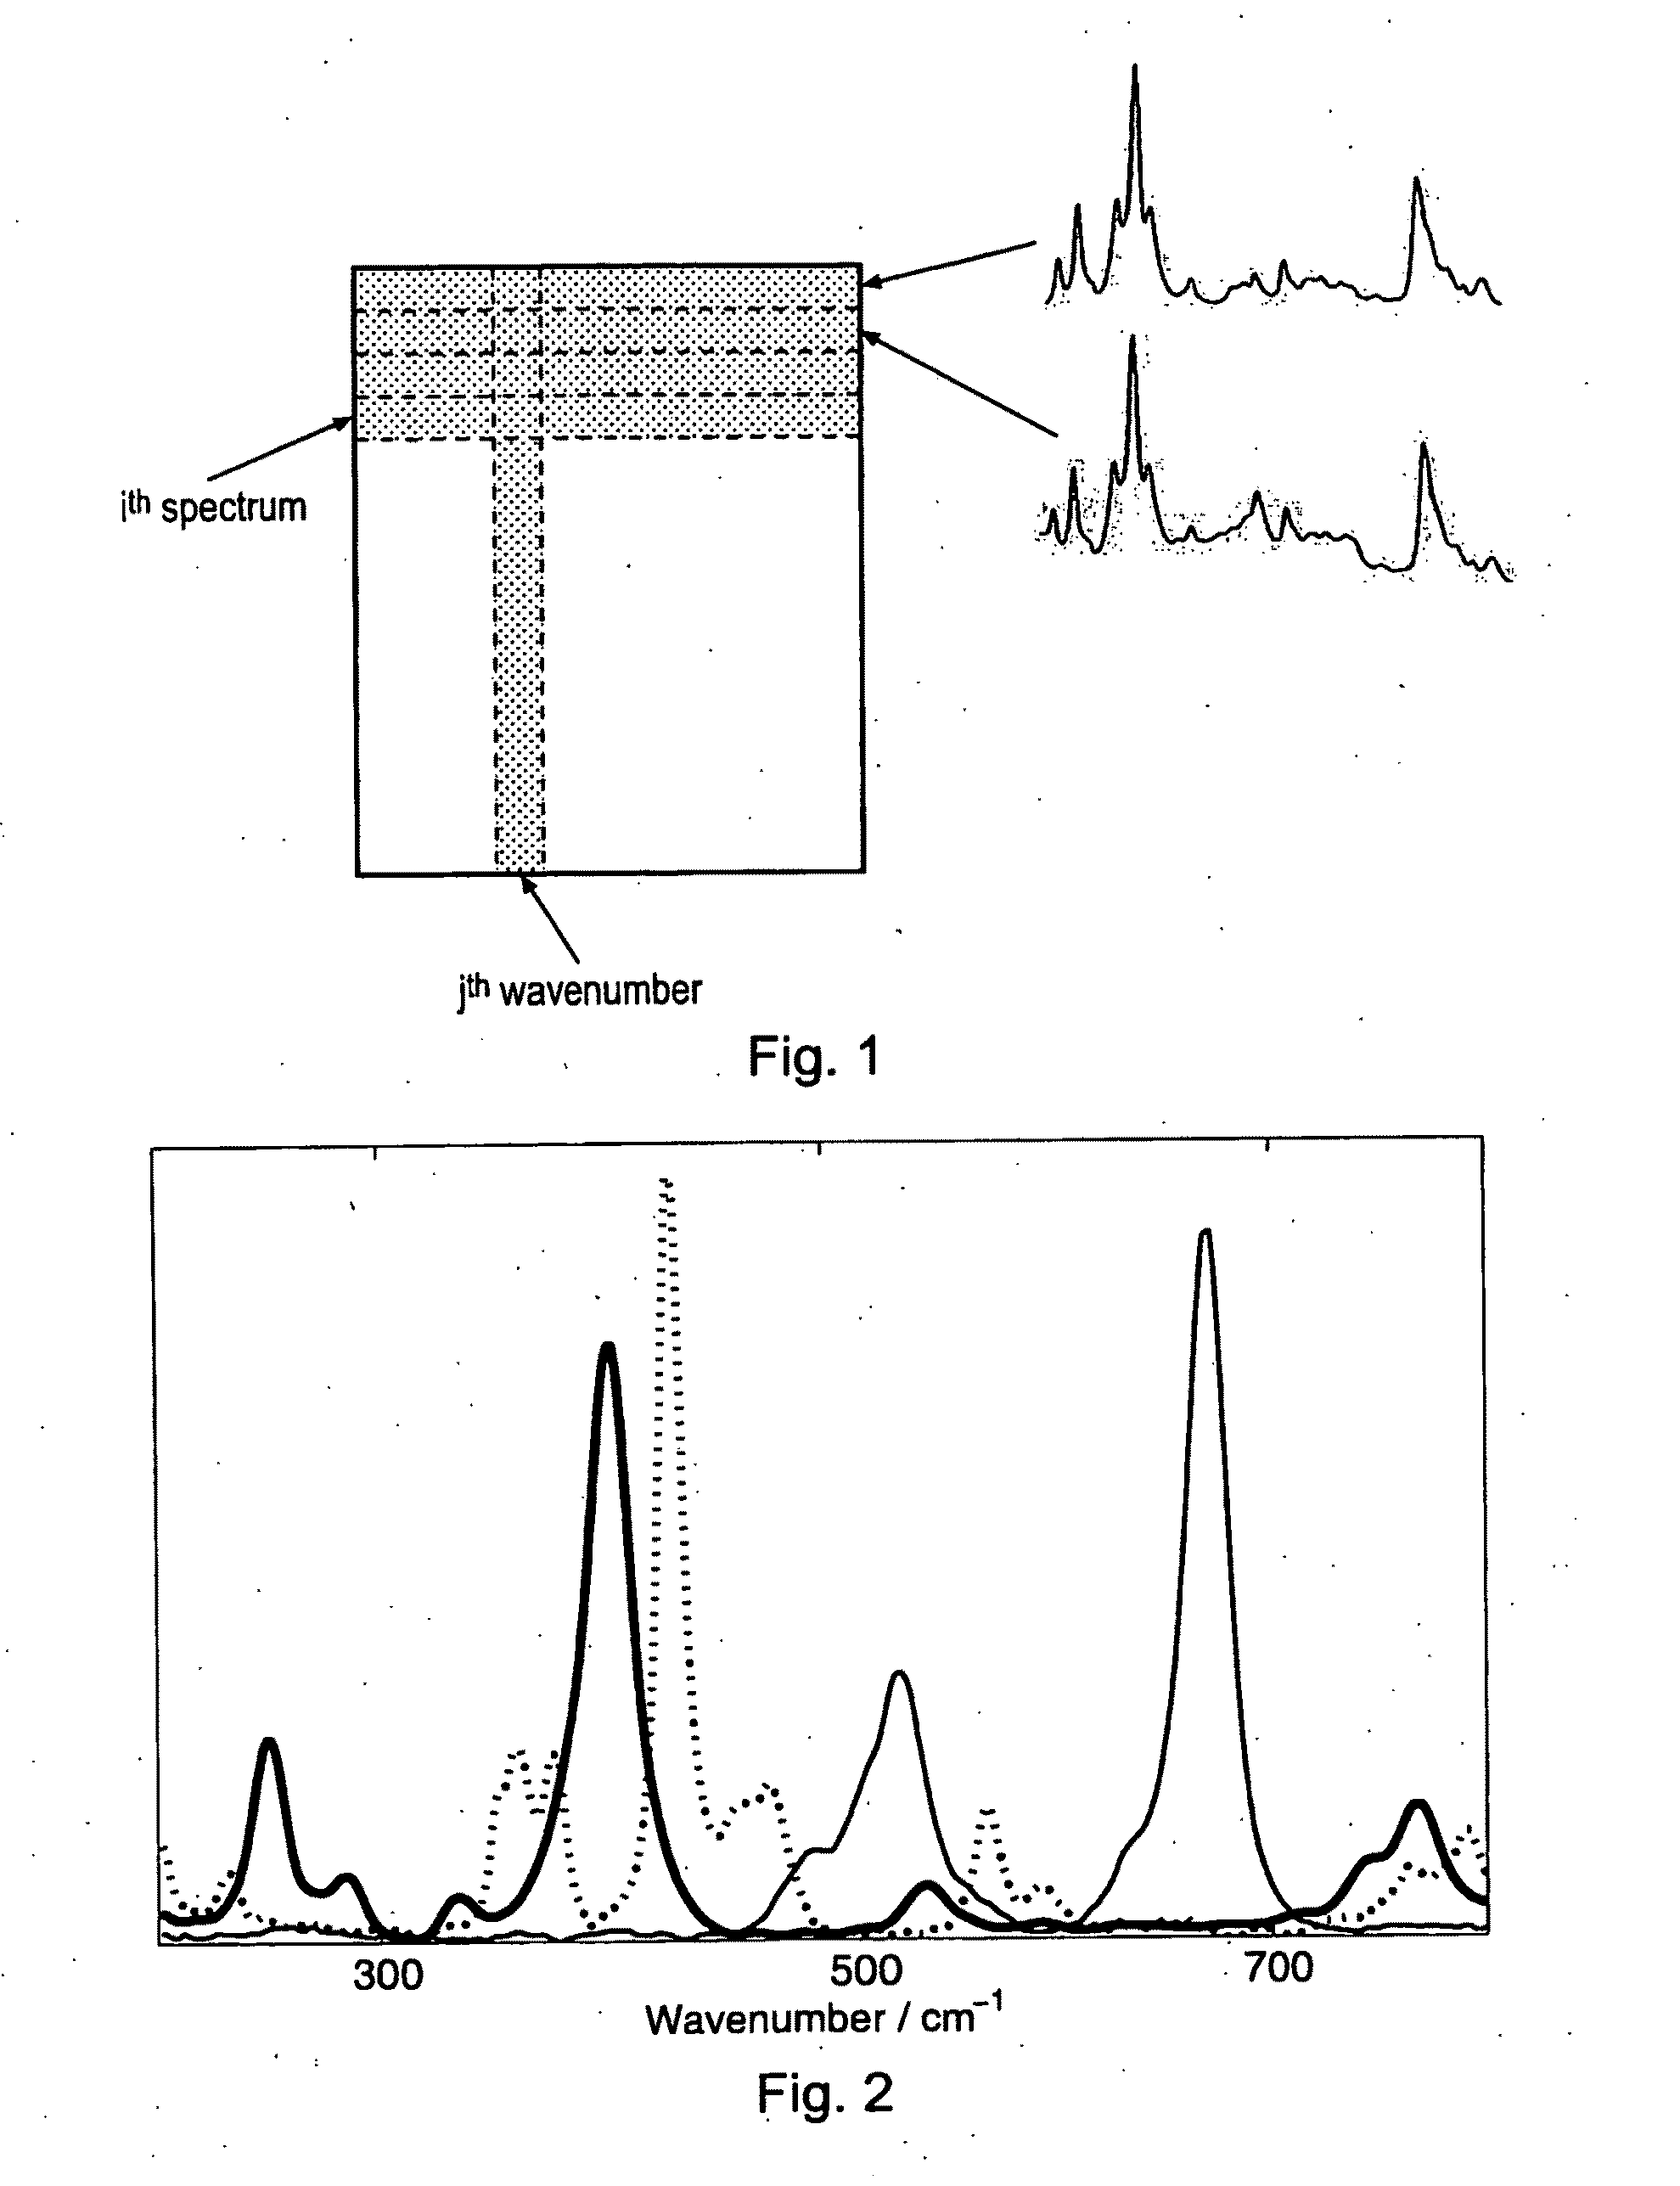
Simulated Mixture Spectra

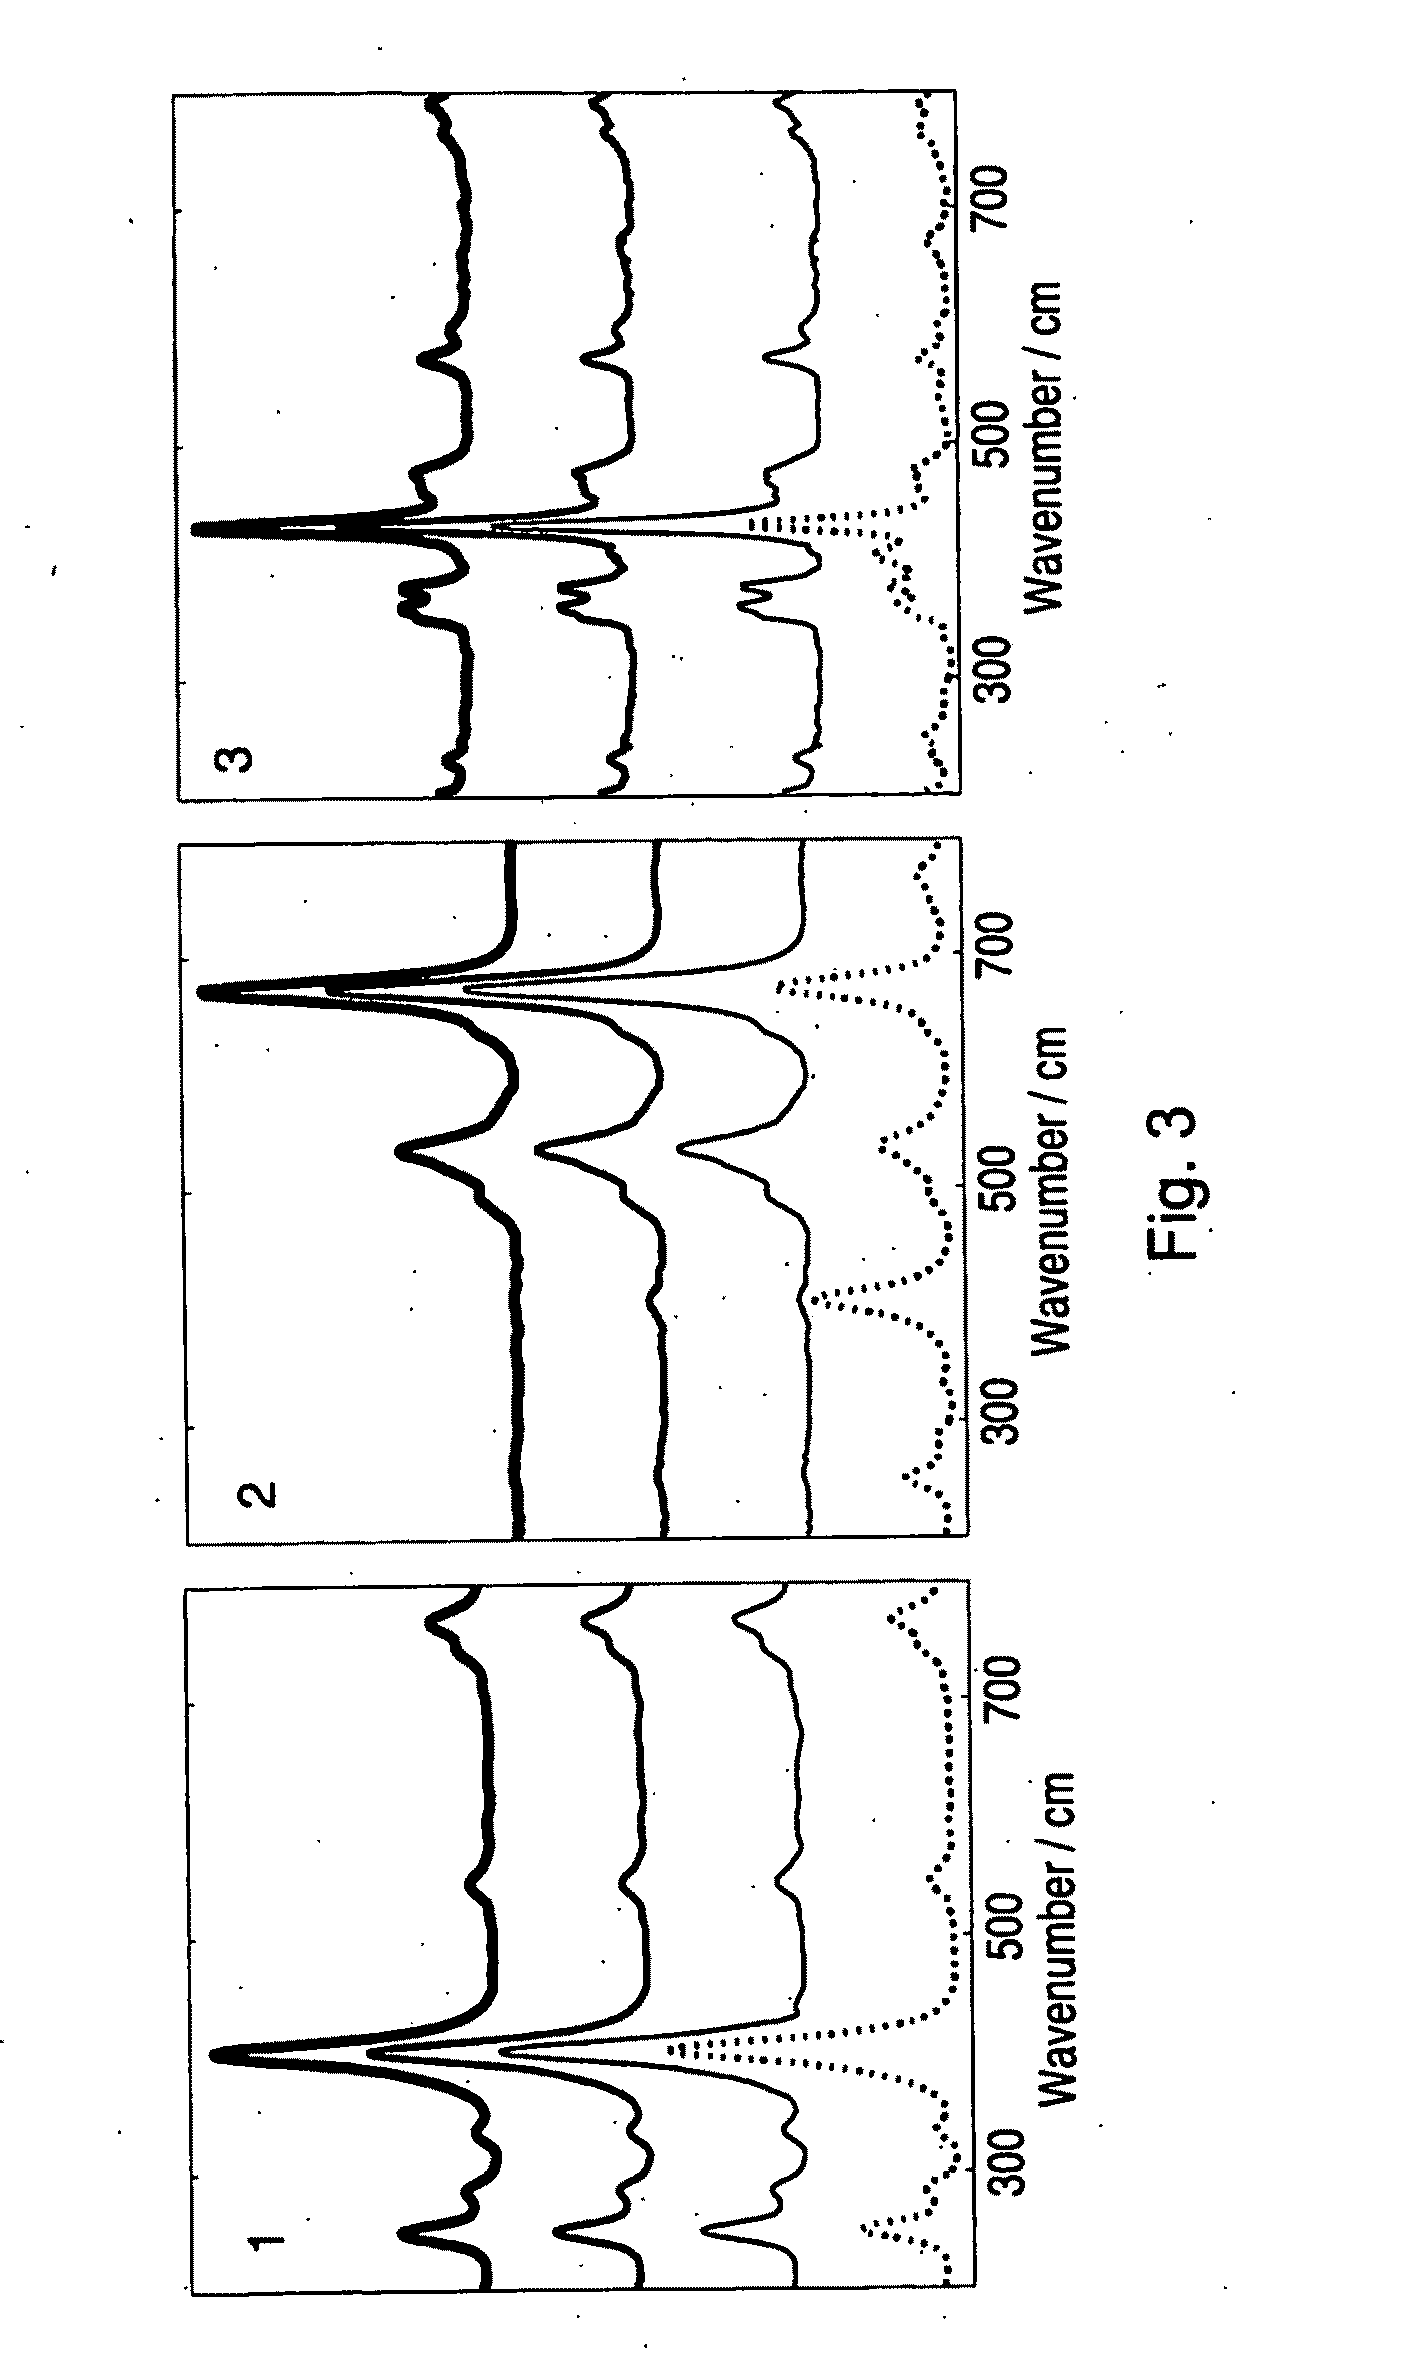
[0068]PCA shows clearly that there are 3 components in the data set, as expected. The reference spectra and the component spectra that were resolved by the different MCR methods are shown in FIG. 3. A numerical comparison of the models is given in Table I. The component 1 spectrum resolved by OPA(spec) / MCR-ALS matches the reference spectrum well, but the other two component spectra also show features of the first. Concomitant with this is a shift in concentration from component 1 to the latter two, resulting in poor predictions of the concentration values.

[0069]With OPA(conc) / MCR-ALS all spectra appear to be reasonably well resolved, although the correlation of component 1 spectrum with the reference spectrum is an order of a magnitude worse than the resolution of this spectrum by the other two methods. The poorer resolution of this spectrum is most apparent in a slight dip on the high wavenumber edge of its main Raman band at 400 cm−1. On this edge, the ban...

example ii

Pharmaceutical Powder

[0071]Principal component analysis of the map data showed that ten components are present in the data set. The ten components were resolved by the three MCR-ALS techniques as described previously. Results of the different methods are shown in Table II. The first nine resolved spectra, compared to reference spectra where available, are given in FIG. 4 and the images from empty modelling are given in FIG. 5.

[0072]The empty modelling results can be interpreted as follows. There are six components that represent independent compounds: cellulose (component 1), lactose (component 2), dicalcium phosphate (component 3), the API (component 4), an unidentified excipient (component 5) and magnesium stearate (component 7). Components 6, 8 and 10 result from baseline variations. Component 9 is due to different rotational variations between the two lactose crystals (compare the images of component 2 and 9 in FIG. 5).

[0073]These observations are less obvious from the OPA(spec)...

example iii

Ranitidine Tablet

[0078]The overall concentration of API in the tablet is over 50% by weight. As the tablet has a coating, the percentage of API will be even higher in the tablet core. APIs are also usually stronger Raman scatterers than excipients. It is therefore reasonable to assume that spectra of the API will be present in the data set in a relatively pure form and that the condition required for empty modelling should be fulfilled.

[0079]PCA determined that five components are present in the data set. Spectra of the components resolved by the different MCR methods can be seen in FIG. 8 and numerical results are given in Table III. The first component corresponds to form H of ranitidine hydrochloride. The data set contains spectra that are very similar to this, and the first spectra resolved by OPA(spec) / MCR-ALS and empty modelling match it well. The second component corresponds to cellulose, for which a reference spectrum is included in FIG. 8. The component 2 spectra resolved b...


PUM


Abstract

A spectroscopic analysis method in which spectral data of mixtures obtained from a plurality of points on a sample surface are resolved into component spectra and concentrations. A new alternating least squares multivariate curve resolution technique is presented which iteratively resolves the components. The technique starts from an initial estimate that the spectral values of a first component of the sample are all equal (an ‘empty model’), and resolves that component. Then successive further components are iteratively resolved, from initial ‘empty model’ estimates of those components and from previously resolved spectra. In the common case where the main component is present in nearly pure form in the data set, this empty modelling technique results in more accurate resolution of the components. This is due to the ability of the technique to resolve the pure spectra of minor components without modelling concentrations of the main component into them.

Description

FIELD OF THE INVENTION[0001]This invention relates to spectroscopic apparatus and methods. It is particularly useful in Raman spectroscopy, though it can also be used in other forms of spectroscopy, e.g. using narrow-line photoluminescence, fluorescence, cathodo-luminescence or infra-red.DESCRIPTION OF PRIOR ART[0002]The Raman effect is a phenomenon in which a sample scatters incident light of a given frequency, into a frequency spectrum which has lines caused by interaction of the incident light with the molecules making up the sample. Different chemical compounds have different characteristic Raman spectra, and so the effect can be used to analyse the chemical compounds present.[0003]Examples of Raman spectroscopy apparatus are known from U.S. Pat. Nos. 5,442,438 and 5,510,894, which are incorporated herein by reference. A sample is irradiated with monochromatic light from a laser. Typically the scattered light is then dispersed into a Raman spectrum by a dispersive device such as...

Claims


Application Information

Patent Timeline
IPC IPC(8): G01J3/30
CPCG01J3/44G01N2201/1293G01N2021/6423G01N21/65
Inventor CAPPEL, UTE
Owner RENISHAW PLC
Why Eureka
Try Eureka