
System and method for software diagnostics using a combination of visual and dynamic tracing

Active Publication Date: 2010-04-08
BMC SOFTWARE ISRAEL LTD
View PDF91 Cites 71 Cited by
  • Summary
  • Abstract
  • Description
  • Claims
  • Application Information

AI Technical Summary

Benefits of technology

[0013]The information-display module allows a support technician (e.g., a software developer, a help desk person, etc.) to see the user interactions with the program and corresponding reactions of the system. This eliminates the “questions and answers” game that support personnel often play with users in order to understand what the user did and what happened on the user's PC. In one embodiment, the information-display module allows the support technician to remotely view environment variables, file access operations, system interactions, and user interactions that occur on the user's computer. In one embodiment, the information-display module allows the support technician to remotely view crash information (in the event of a crash on the user's computer), system information from the user's computer, and screen captures from the user's computer.
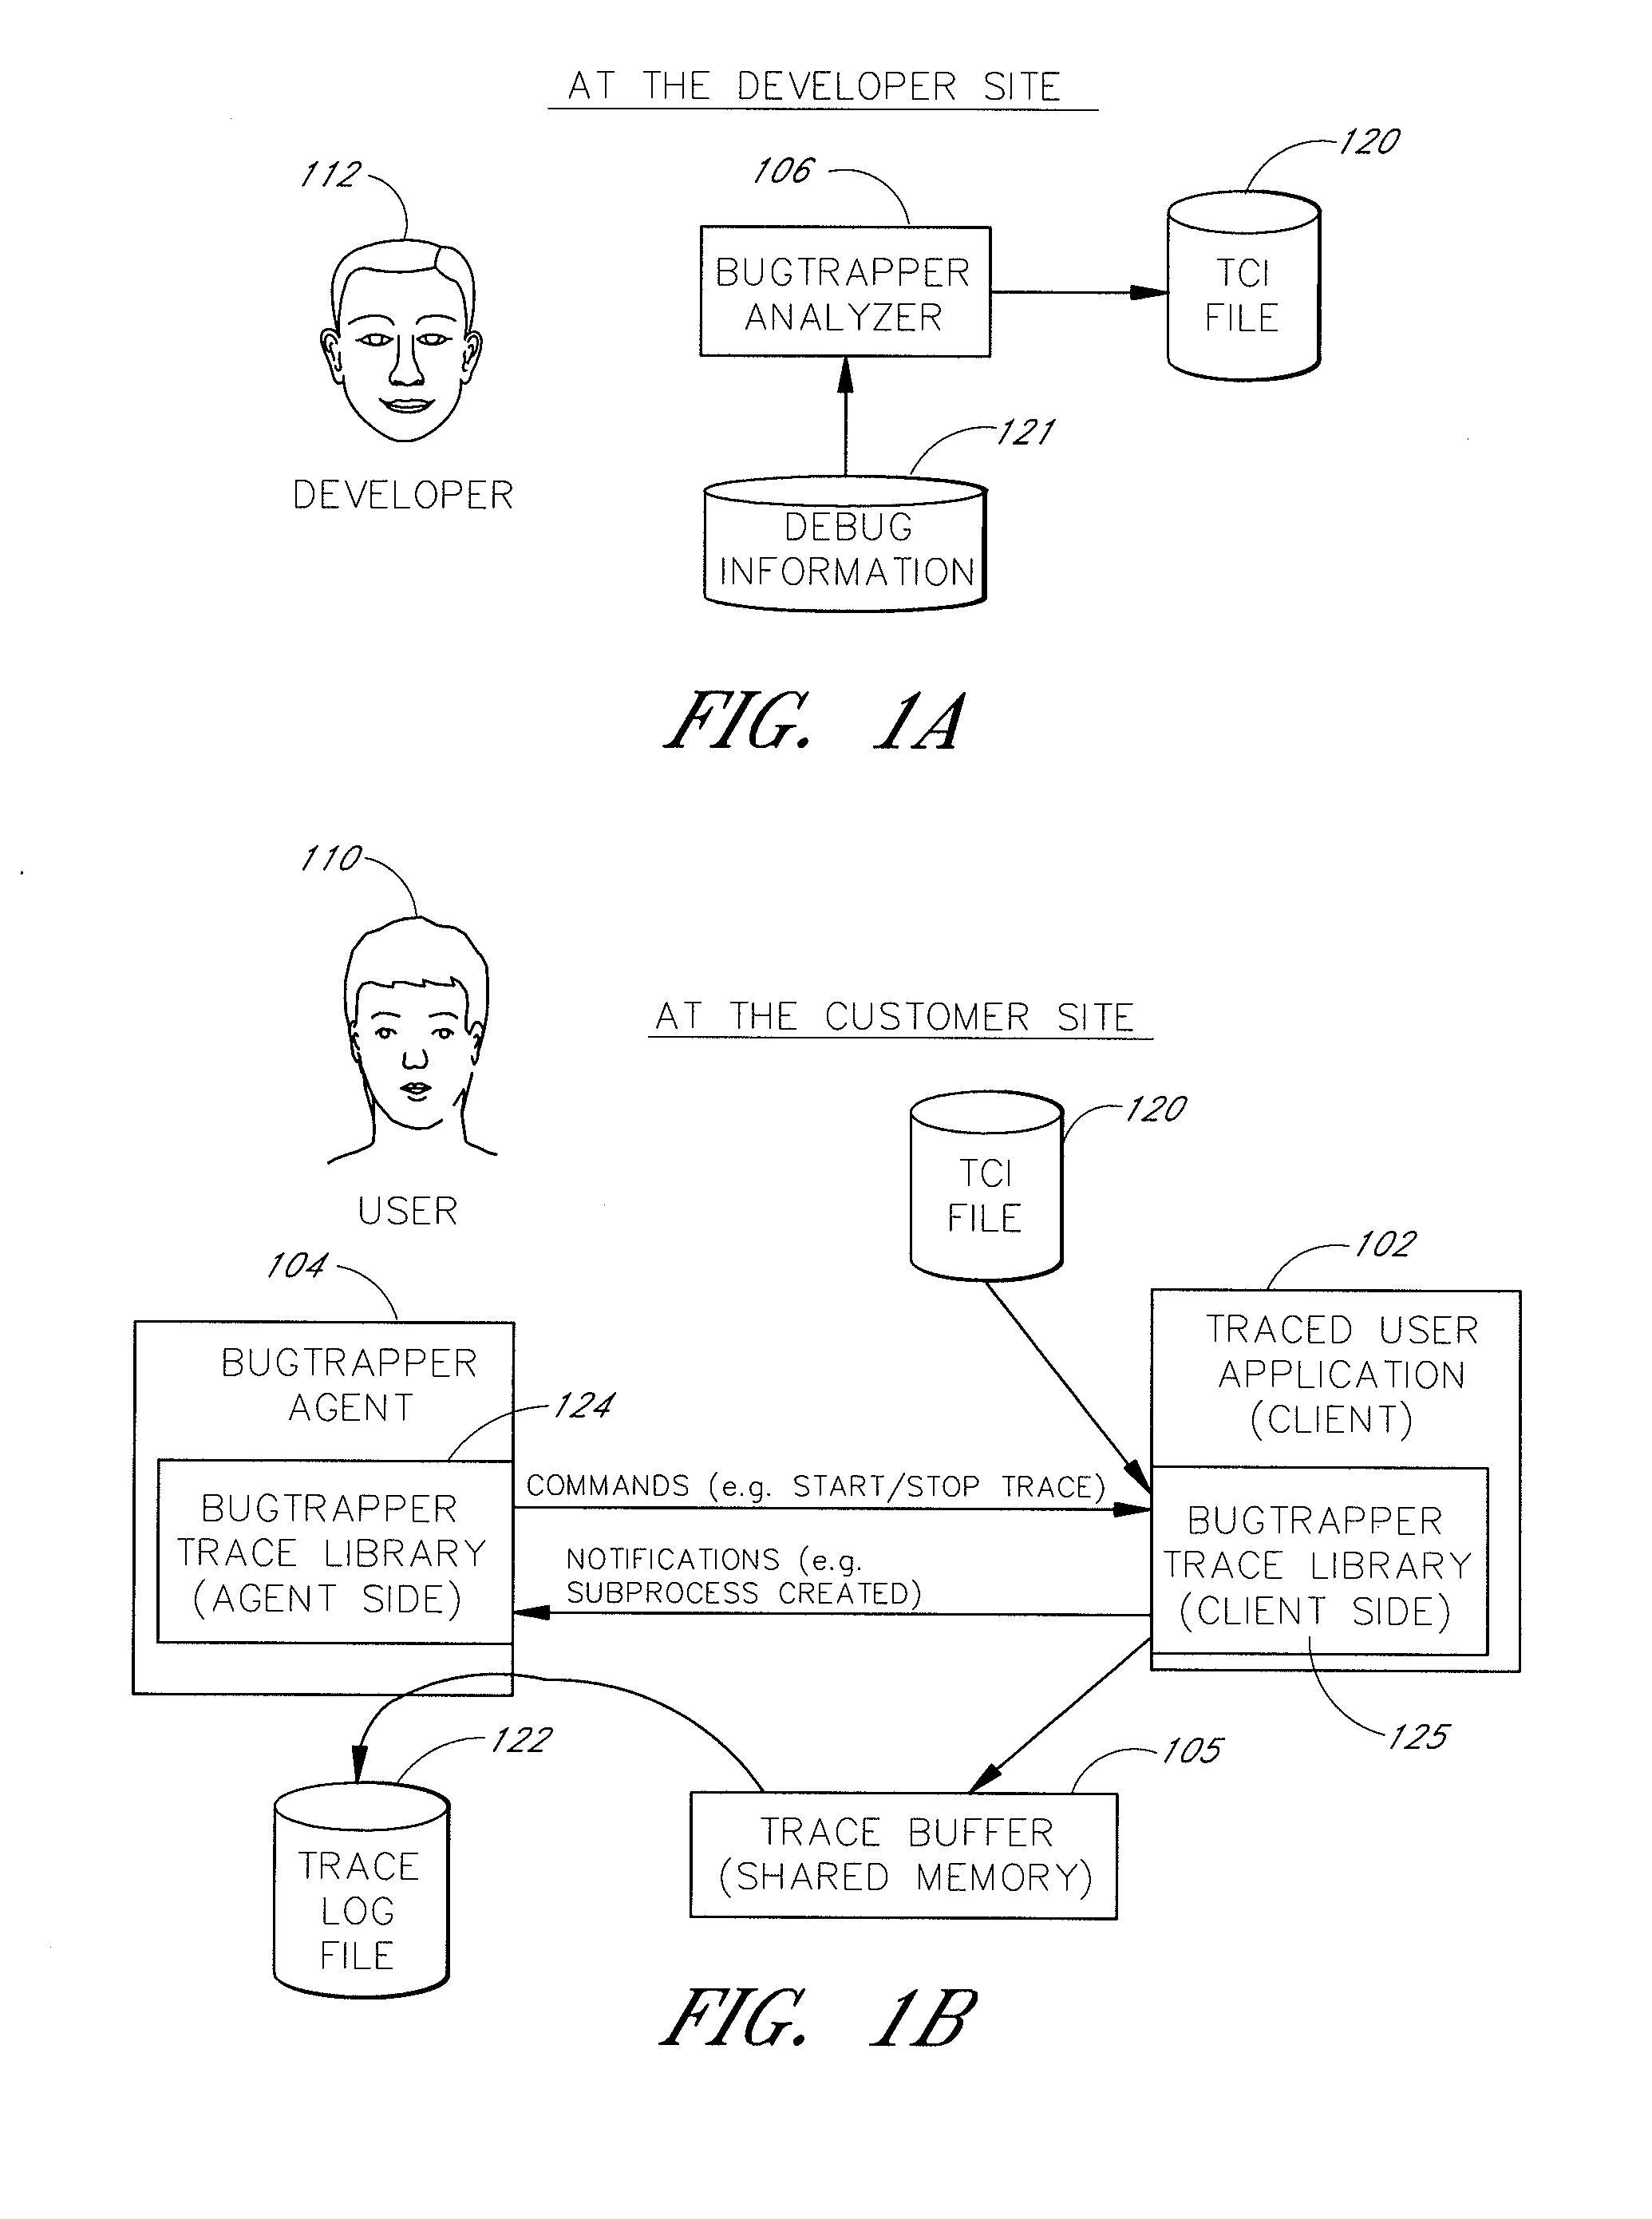
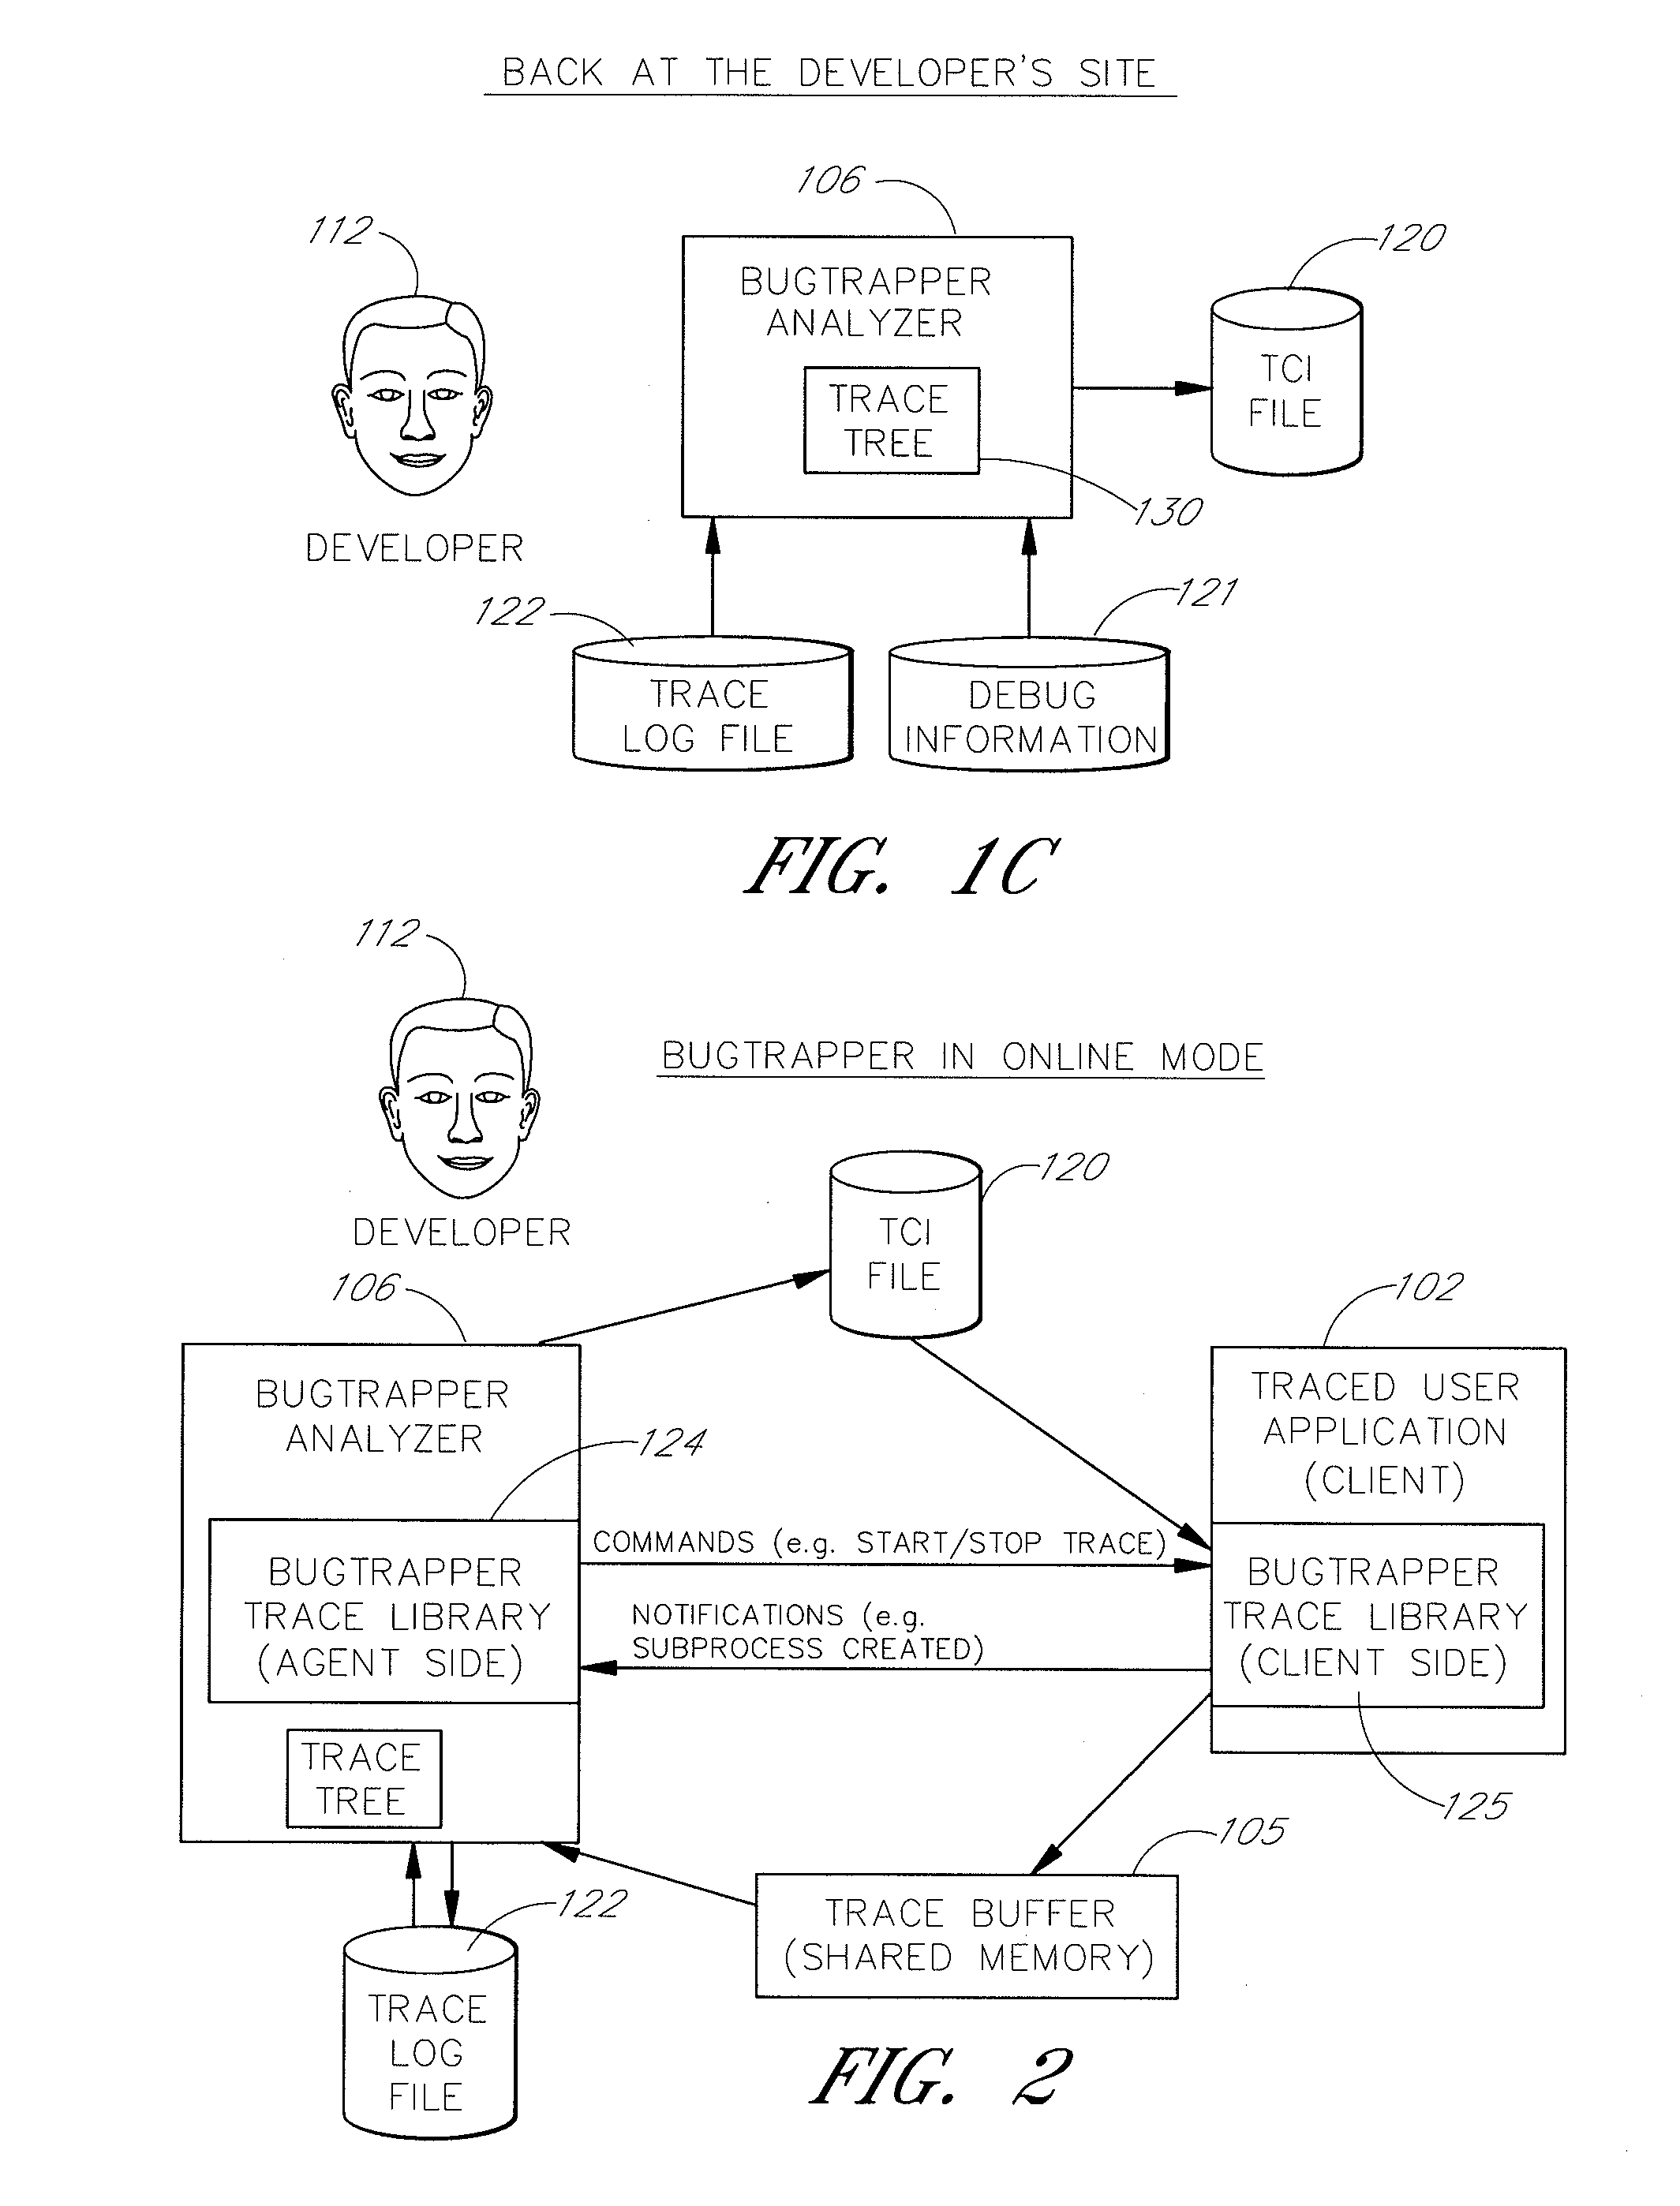
[0014]One aspect of the present invention is a software system that facilitates the process of identifying and isolating bugs within a client program by allowing a developer to trace the execution paths of the client. The tracing can be performed without requiring modifications to the executable or source code files of the client program. In one embodiment, the system interaction tracing can be performed even without any knowledge of the source code or debug information of the client. Preferably, the trace data collected during the tracing operation is collected according to instructions in a trace control dataset, which is preferably stored in a Trace Control Information (TCI) file. Typically, the developer generates the TCI file by using a trace options editor program having a graphical user interface. The options editor displays the client's source code representation on a display screen together with controls that allow the software developer to interactively specify the source code and data elements to be traced. The options editor may use information created by a compiler or linker, such as debug information, in order to provide more information about the client and thereby make the process of selecting trace options easier. Once the trace options are selected, the client is run on a computer, and a tracing library is used to attach to the memory image of the client (the client process). The tracing library is configured to monitor execution of the client, and to collect trace data, based on selections in the trace options. The trace data collected by the tracing library is written to an encoded buffer in memory. The data in the buffer may optionally be saved to a trace log file for later use.
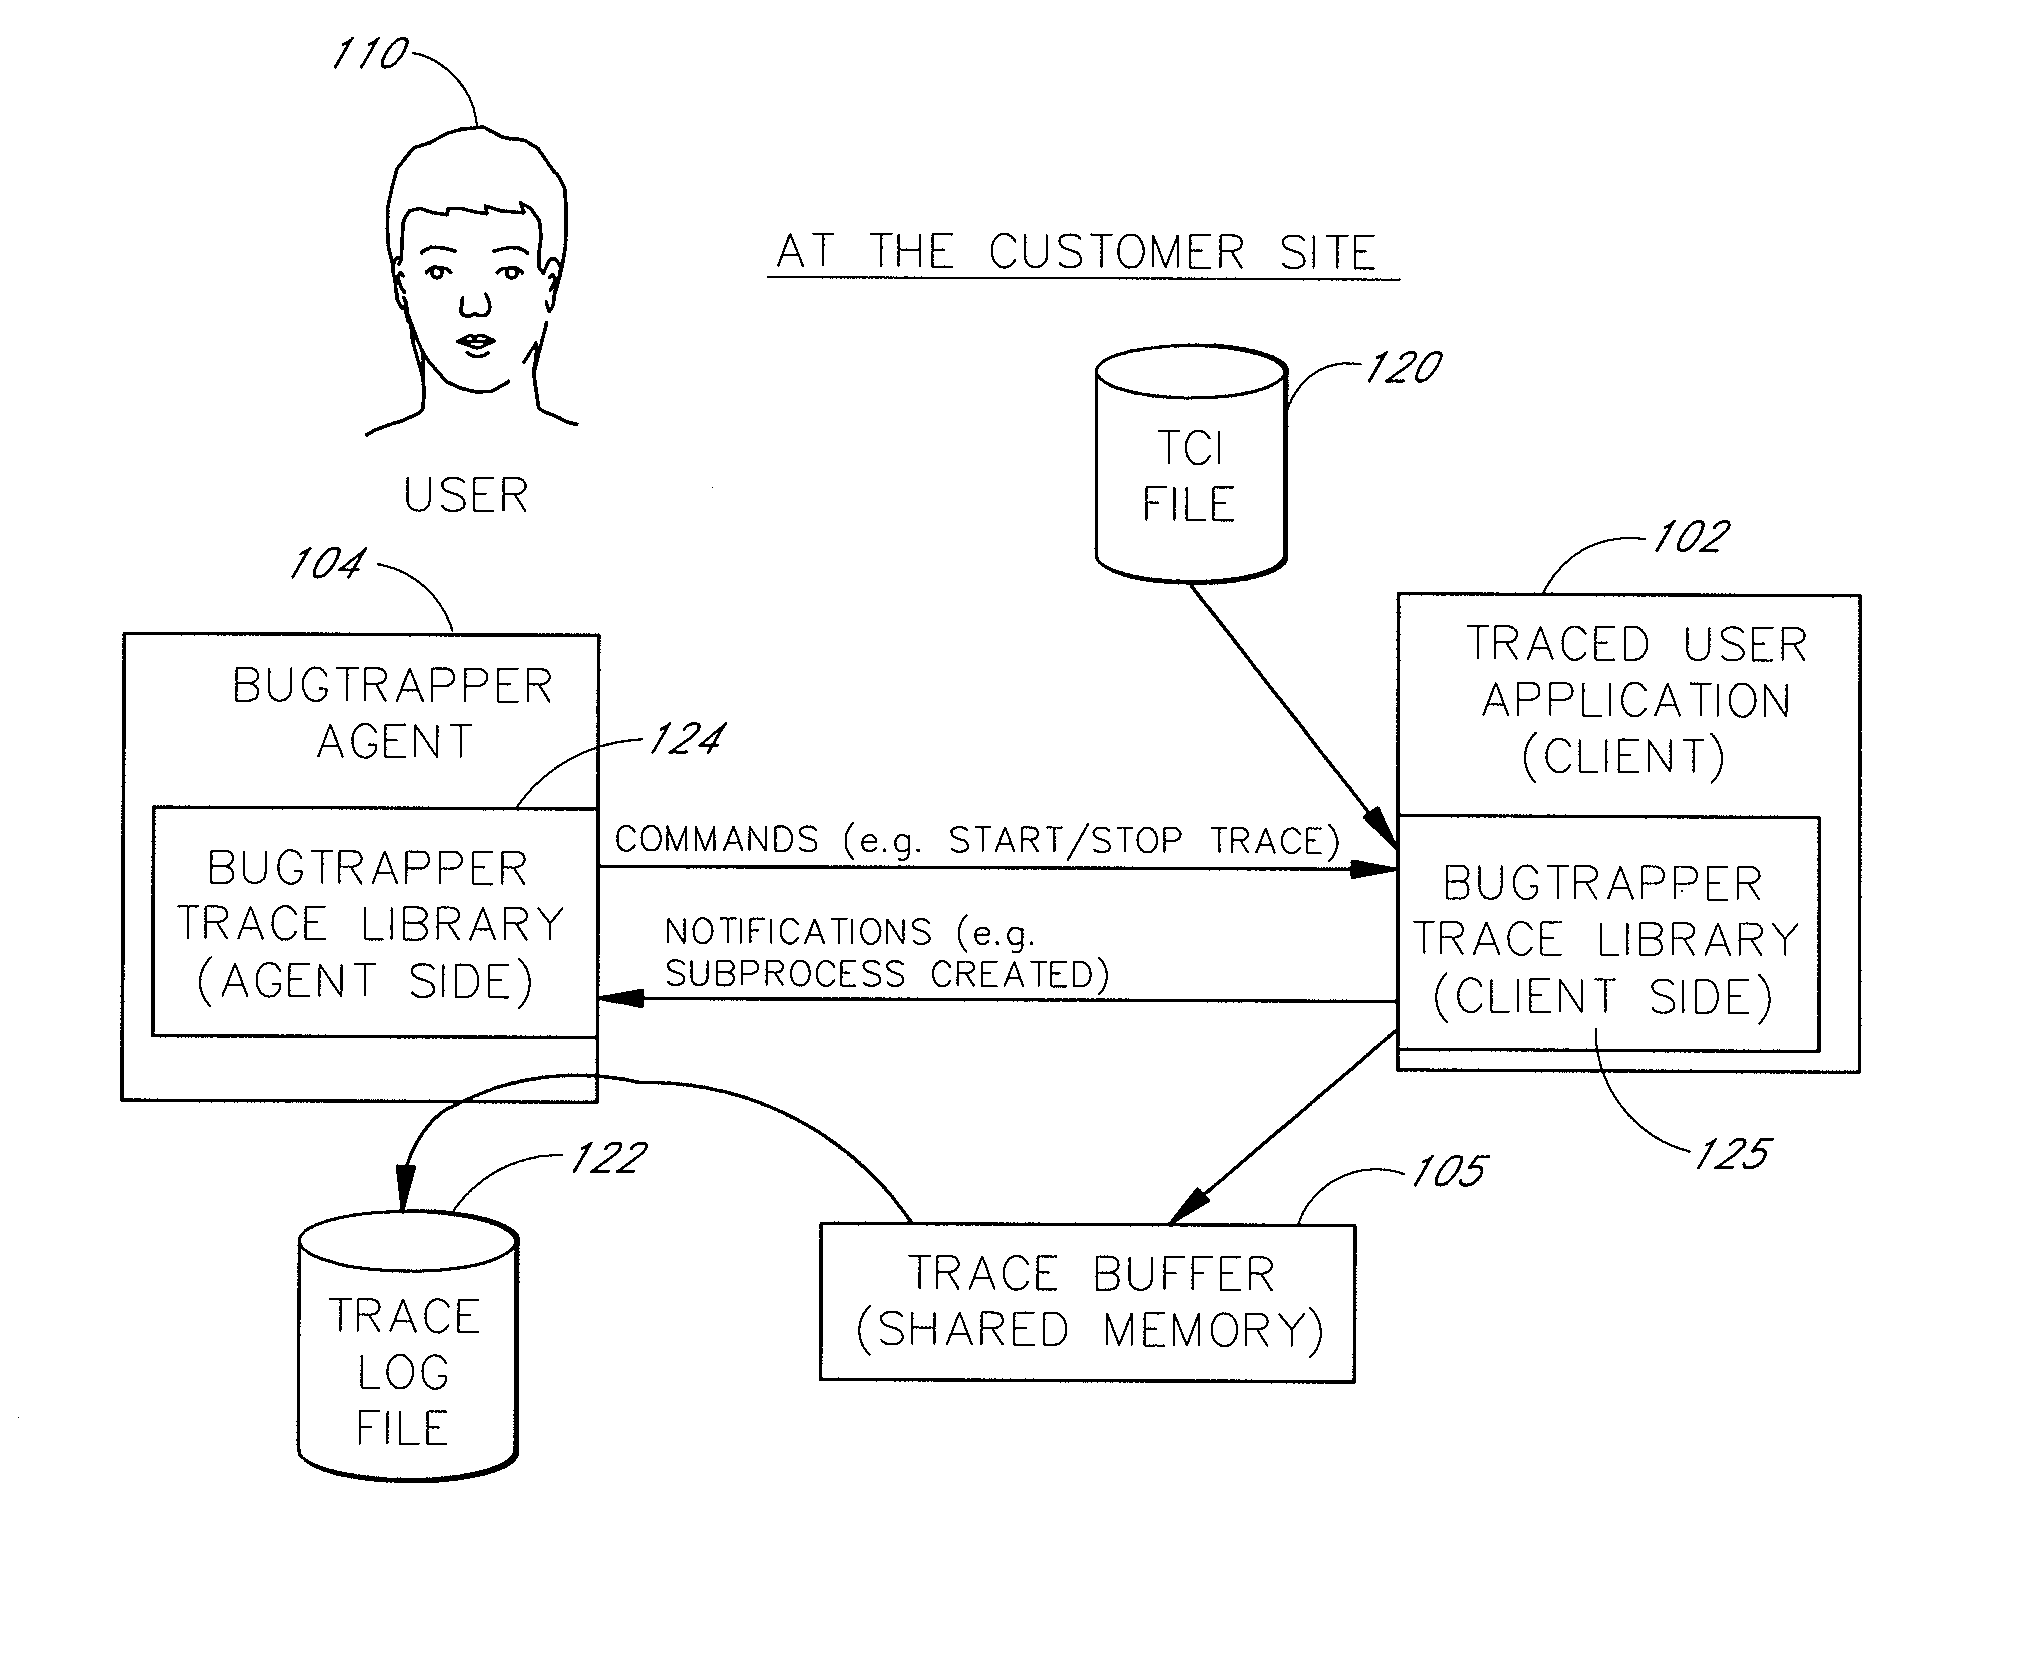
[0016]In one embodiment, the software system provides a remote mode that enables the client program to be traced at a remote site, such as by the customer at a remote customer site, and then analyzed at the developer site. When the remote mode is used, the developer sends the TCI file for the particular client to a remote user site together with a small executable file called the tracing “agent.” The agent is adapted to be used at the remote user site as a stand-alone tracing component that enables a remote customer, who does not have access to the source code of the client, to generate a trace file that represents execution of the client application at the remote site. The trace file is then sent to the developer site (such as by email), and is analyzed by the software developer using the analyzer. The remote mode thus enables the software developer to analyze how the client program is operating at the remote site, without the need to visit the remote site, and without exposing to the customer the source code or other confidential details of the client program.

Problems solved by technology

Two significant problems arise in using this model.
Setting such a breakpoint can be difficult when working with an event-driven system (such as the Microsoft Windows® operating system), because the developer does not always know which of the event handlers (callbacks) will be called.
The second problem is that some bugs give rise to actual errors only during specific execution conditions, and these conditions cannot always be reproduced during the debugging process.
For example, a program error that occurs during normal execution may not occur during execution under the debugger, since the debugger affects the execution of the program.
An example of this second type of problem is commonly encountered when software developers attempt to diagnose problems that have been identified by customers and other end users.
Quite often, software problems appear for the first time at a customer's site.
When trying to debug these problems at the development site (typically in response to a bug report), the developer often discovers that the problem cannot be reproduced.
Distributed, client / server, and parallel systems, especially multi-threaded and multi-process systems, are notorious for having non-reproducible problems because these systems depend heavily on timing and synchronization sequences that cannot easily be duplicated.
When a bug cannot be reproduced at the development site, the developer normally cannot use a debugger, and generally must resort to the tedious, and often unsuccessful, task of manually analyzing the source code.
Unfortunately, sending a developer to a customer's site is often prohibitively time consuming and expensive, and the process of setting up a debugging environment (source code files, compiler, debugger, etc.) at the customer site can be burdensome to the customer.
Unfortunately, the imbedded code solution depends on inserting the tracing code into the source prior to compiling and linking the shipped version of the application.
Trying to anticipate where a bug will occur is, in general, a futile task.
Often there is no imbedded code where it is needed, and once the application has been shipped it is too late to add the desired code.
Another drawback of current monitoring systems is the inability to correctly handle parallel execution, such as in a multiprocessor system.
Using serial techniques for parallel systems may cause several problems.
First, the sampling activity done in the various parallel entities (threads or processes) may interfere with each other (e.g., the trace data produced by one entity may be over written by another entity).
Second, the systems used to analyze the trace data cannot assume that the trace is sequential.
Displaying the trace data as a separate calling tree for each entity is not appropriate, as this does not reveal when, during the execution, contexts switches were done between the various parallel entities.
Moreover, the computing model used in the Microsoft Windows environment, which is based on the use of numerous sophisticated and error-prone applications with many components interacting in a complex way, requires a significant effort for system servicing and support.
Many Windows problems experienced by users are software configuration errors that commonly occur when the users add new programs and devices to their computers.
Problems also occur due to the corruption of important system files, resources, or setups.

Method used


Image

  • System and method for software diagnostics using a combination of visual and dynamic tracing
  • System and method for software diagnostics using a combination of visual and dynamic tracing
  • System and method for software diagnostics using a combination of visual and dynamic tracing

Examples


Embodiment Construction

[0041]The present invention provides a new model for software diagnostics by tracing the execution path of a computer program and user interaction with the computer program. In the preferred embodiment of the invention, this tracing model is implemented within a set of tracing and debugging tools that are collectively referred to as the BugTrapper system (“BugTrapper”). The BugTrapper tools are used to monitor and analyze the execution of a computer program, referred to as a client. One feature of the BugTrapper is that it does not require special instructions or commands to be imbedded within the source code of the client, and it does not require any modifications to be made to the source or executable files of the client. “Tracing,” or “to trace,” refers generally to the process of using a monitoring program to monitor and record information about the execution of the client while the client is running. A “trace” generally refers to the information recorded during tracing. Unlike ...


PUM


Abstract

A software system is disclosed that provides remote troubleshooting and tracing of the execution of computer programs. The software system allows a remote software developer or help desk person to troubleshoot computer environment and installation problems such as missing or corrupted environment variables, files, DLLs, registry entries, and the like. In one embodiment the software system includes an information-gathering module that gathers run-time information about program execution, program interaction with the operating system and the system resources. The information-gathering module also monitors user actions and captures screen output. The information-gathering module passes the gathered information to an information-display module. The information-display module allows a support technician (e.g., a software developer, a help desk person, etc.) to see the user interactions with the program and corresponding reactions of the system. In one embodiment, the information-display module allows the support technician to remotely view environment variables, file access operations, system interactions, and user interactions that occur on the user's computer and locate failed operations that cause execution problems

Description

CROSS-REFERENCE TO RELATED APPLICATIONS[0001]This application is a continuation of U.S. patent application Ser. No. 09 / 799,338, filed Mar. 5, 2001, which claims the benefit of priority of U.S. provisional patent application No. 60 / 186,636, filed Mar. 3, 2000; all of which are hereby expressly incorporated by reference in their entireties.BACKGROUND OF THE INVENTION[0002]1. Field of the Invention[0003]The present invention relates to software tools for assisting software developers and help desk personnel in the task of monitoring and analyzing the execution of computer programs running on remote computers and detection and troubleshooting of execution problems.[0004]2. Description of the Related Art[0005]The problem of ascertaining why a particular piece of software is malfunctioning is currently solved by a number of techniques including static analysis of configuration problems and conventional debugging techniques such as run-time debugging and tracing. Despite the significant di...

Claims


Application Information

Patent Timeline
IPC IPC(8): G06F9/44G06F9/46G06F11/32G06F11/34G06F11/36
CPCG06F9/4446G06F9/547G06F11/366G06F11/3466G06F11/3476G06F11/323G06F9/453
Inventor GOLENDER, VALERYMOSHE, IDO BENWYGODNY, SHLOMO
Owner BMC SOFTWARE ISRAEL LTD
Learn More