Method of extracting formation density and pe using a pulsed accelerator based litho-density tool
a density tool and accelerator technology, applied in the field of pulsed gammagamma density tools, can solve the problems of many high-energy photons that carry density information lost, difficult to dispose and misuse, and the conventional - density tools have a significant drawback, and achieve the effect of precise determination of bulk formation density
- Summary
- Abstract
- Description
- Claims
- Application Information
AI Technical Summary
Benefits of technology
Problems solved by technology
Method used
Image
Examples
example 1
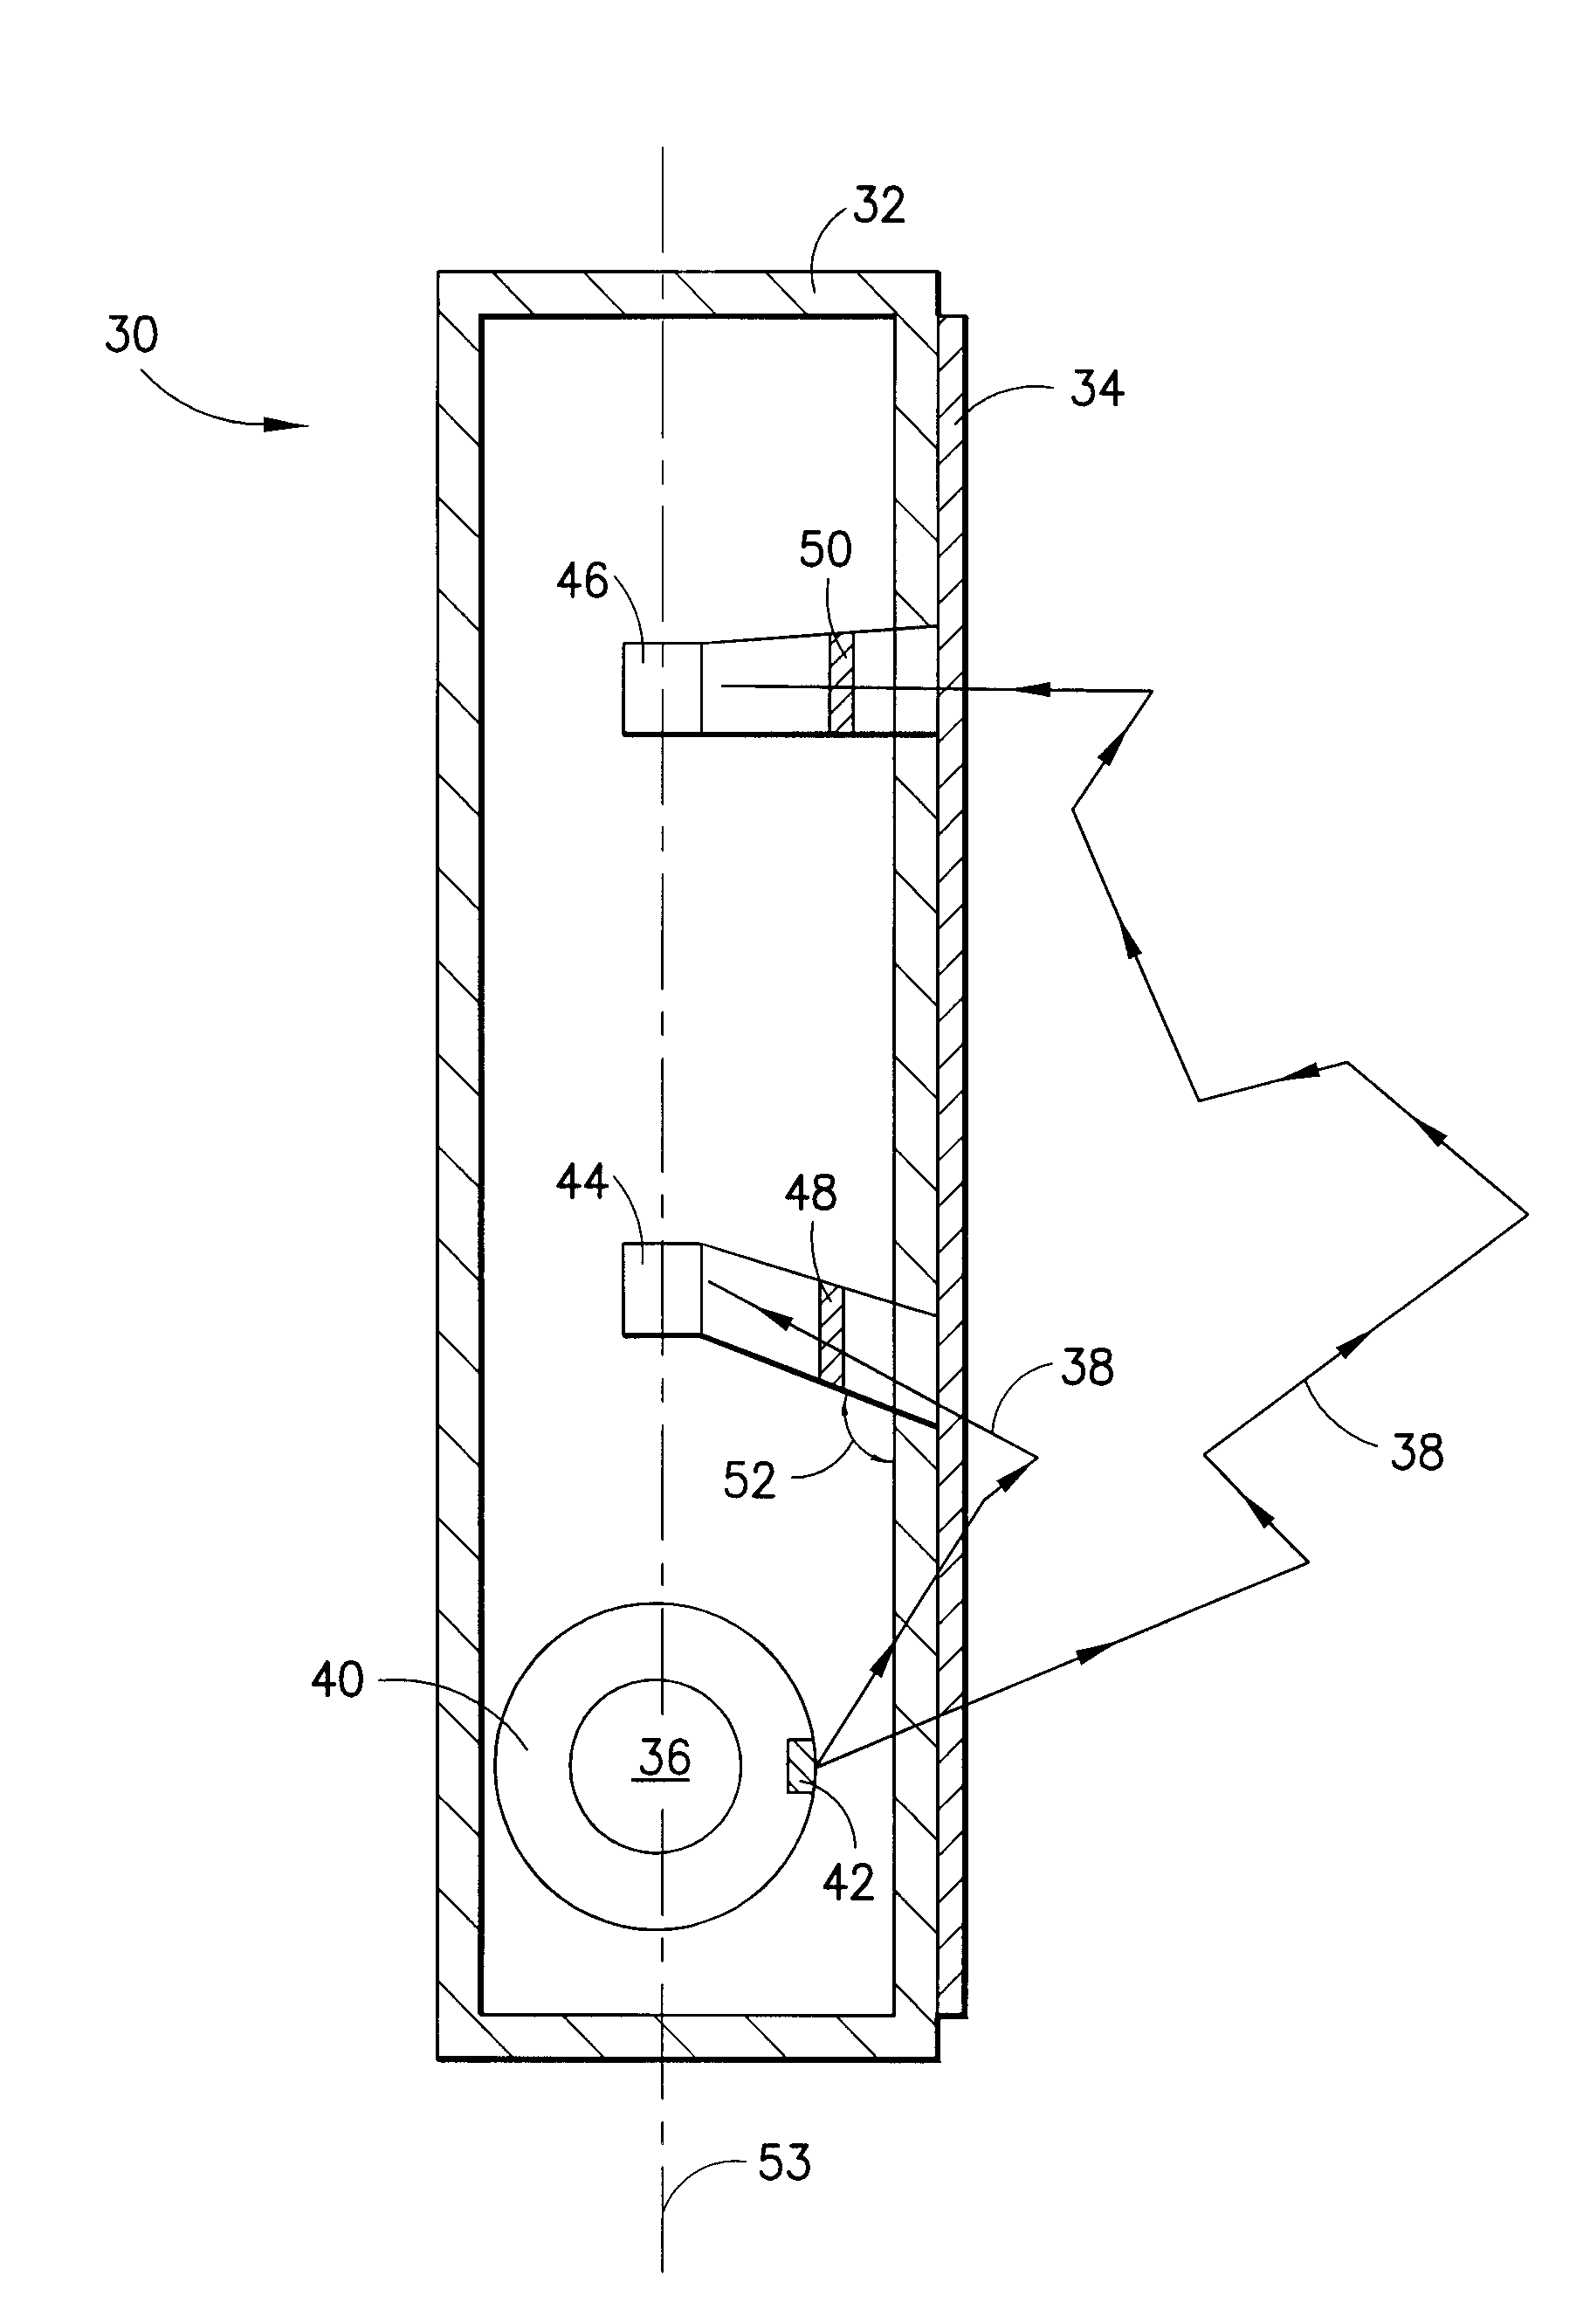
[0092]Example 1 illustrates how equation (17) is utilized to prepare a compensated tool. A tool as illustrated in FIG. 7 was evaluated with a number of SS / LS spacing, collimation angles and filter thicknesses. Five values were calculated, ρe—coe; Pe—coe; Slope; No Standoff Accuracy; and 0.5 inch Standoff Accuracy and are listed sequentially in each box of Table 4. As shown in Table 4, the optimal configuration is with a 0.39 cm stainless steel LS filter and a 0.5 cm iron SS filter with the SS collimator at an angle of 70° relative to a longitudinal axis of the tool.
TABLE 4Long Space →IncreasingFilterThickness→→Short Space ↓Cs20Cs33Cs22Cs32Cs2590° Collimator0.96 ± 0.081.00 ± 0.051.00 ± 0.051.02 ± 0.041.03 ± 0.04Increasing Filter0.009 ± 0.0030.002 ± 0.0030.001 ± 0.002−0.002 ± 0.002 −0.003 ± 0.002 Thickness ↓0.78 ± 0.060.64 ± 0.060.63 ± 0.060.55 ± 0.070.54 ± 0.07−0.04~0.04 −0.03~0.02 −0.03~0.02 −0.03~0.01 −0.04~0.01 cs31−0.04~0.06 −0.07~0.05 −0.09~0.09 −0.09~0.06 −0.06~0.06 90° Collima...
example 2
[0098]Example 2 illustrates the inversion technique for obtaining compositional data. FIG. 15 compares two NaI detector spectra using a betatron source. The source to detector spacing was 14 inches in slab geometry. The formation was epoxy gravel. No Pe filter was used, and the electron beam end point energy was ˜1.7 MeV. The only difference between the two spectra was their cathode heater current, which affects only the intensity of the source, hence the ratio Na / Np.
[0099]A distinct feature of the higher count rate spectrum is the hump due to the P2 distribution. Table 5 lists known and derived spectral information based on preceding discussions.
TABLE 5Heater current0.481 A0.59 ANp3600024000Na483619670Np / Na0.1340.819Nt519341098Nt / Na1.0742.089Ē(keV)162.8319.3Ē1(keV)151.6152.8a192.93%33.66%a26.84%34.96%a30.23%22.04%a407.76%a501.44%a600.13%
[0100]The two curves in FIG. 15 were obtained by assuming the following single photon probability function:
P1(E)=b0×e−b1(E−b5)×[1−e−b2(E−b5)−b3(E−b...
PUM
 Abstract
Description
Claims
Application Information
 - R&D
- Intellectual Property
- Life Sciences
- Materials
- Tech Scout
- Unparalleled Data Quality
- Higher Quality Content
- 60% Fewer Hallucinations
Browse by: Latest US Patents, China's latest patents, Technical Efficacy Thesaurus, Application Domain, Technology Topic, Popular Technical Reports.
© 2025 PatSnap. All rights reserved.Legal|Privacy policy|Modern Slavery Act Transparency Statement|Sitemap|About US| Contact US: help@patsnap.com


