
System and method for monitoring electrical demand performance

a technology of electrical demand and monitoring system, applied in adaptive control, program control, instruments, etc., can solve the problems of increasing electrical demand, difficult to provide the automation desired along with maintaining comfortable temperatures to building occupants, and more expensive electronic equipment, so as to reduce the demand

Inactive Publication Date: 2012-02-09
INTREGATED BUILDING SOLUTIONS
View PDF1 Cites 7 Cited by
  • Summary
  • Abstract
  • Description
  • Claims
  • Application Information

AI Technical Summary

Benefits of technology

[0027]The method is the second aspect further comprises the steps of providing instrumentation and data associated therewith; providing a first electronic device; providing a second electronic device; transmitting the data from the first electronic to the second electronic device; and controlling the first electronic device or the second electronic device with software. Also included in the method is commissioning the building engineers to reduce demand when a real time demand is higher than an expected energy demand.

Problems solved by technology

A drawback to the approach offered by Hileband is that it's difficult to provide the automation desired along with maintaining comfortable temperatures to building occupants.
Also more expensive electronic equipment, for example, is more abundant in commercial buildings leading to increased electrical demand.
While many commercial buildings rely solely on the power grid for electrical demand, some building can provide limited power for their own consumption with battery cells, solar cells, natural gas and diesel generators.

Method used


Image

  • System and method for monitoring electrical demand performance
  • System and method for monitoring electrical demand performance
  • System and method for monitoring electrical demand performance

Examples


Embodiment Construction

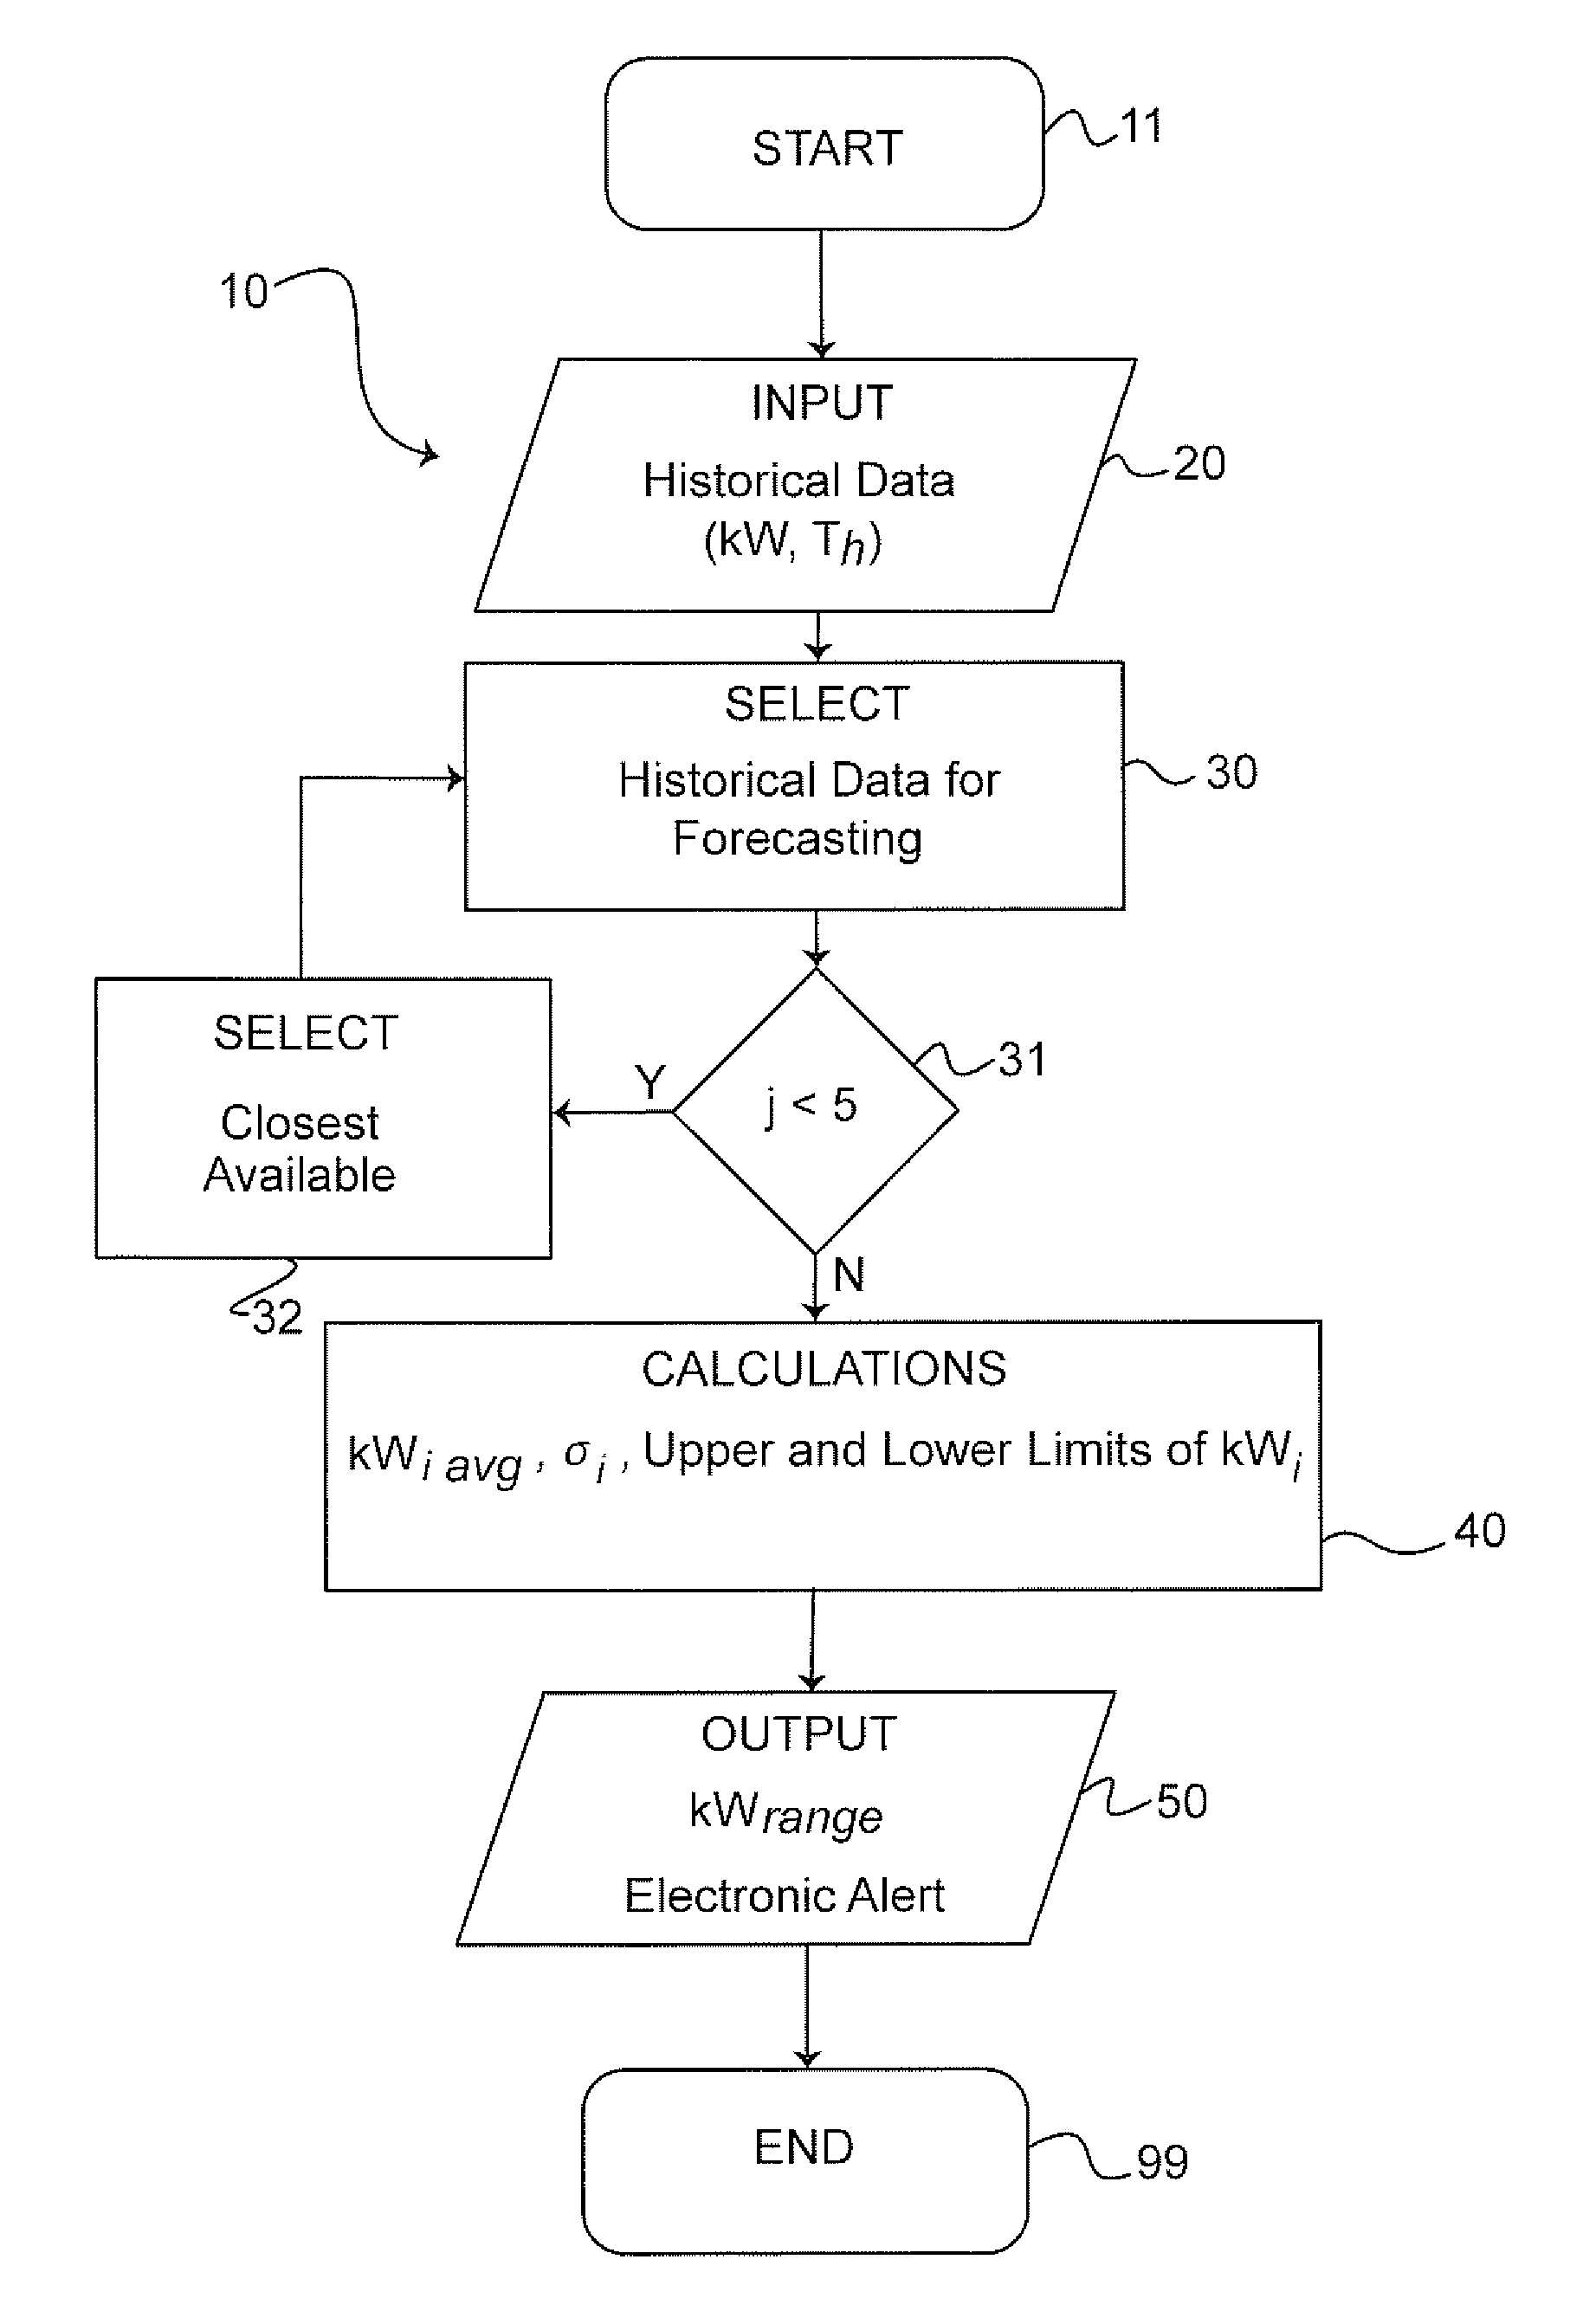
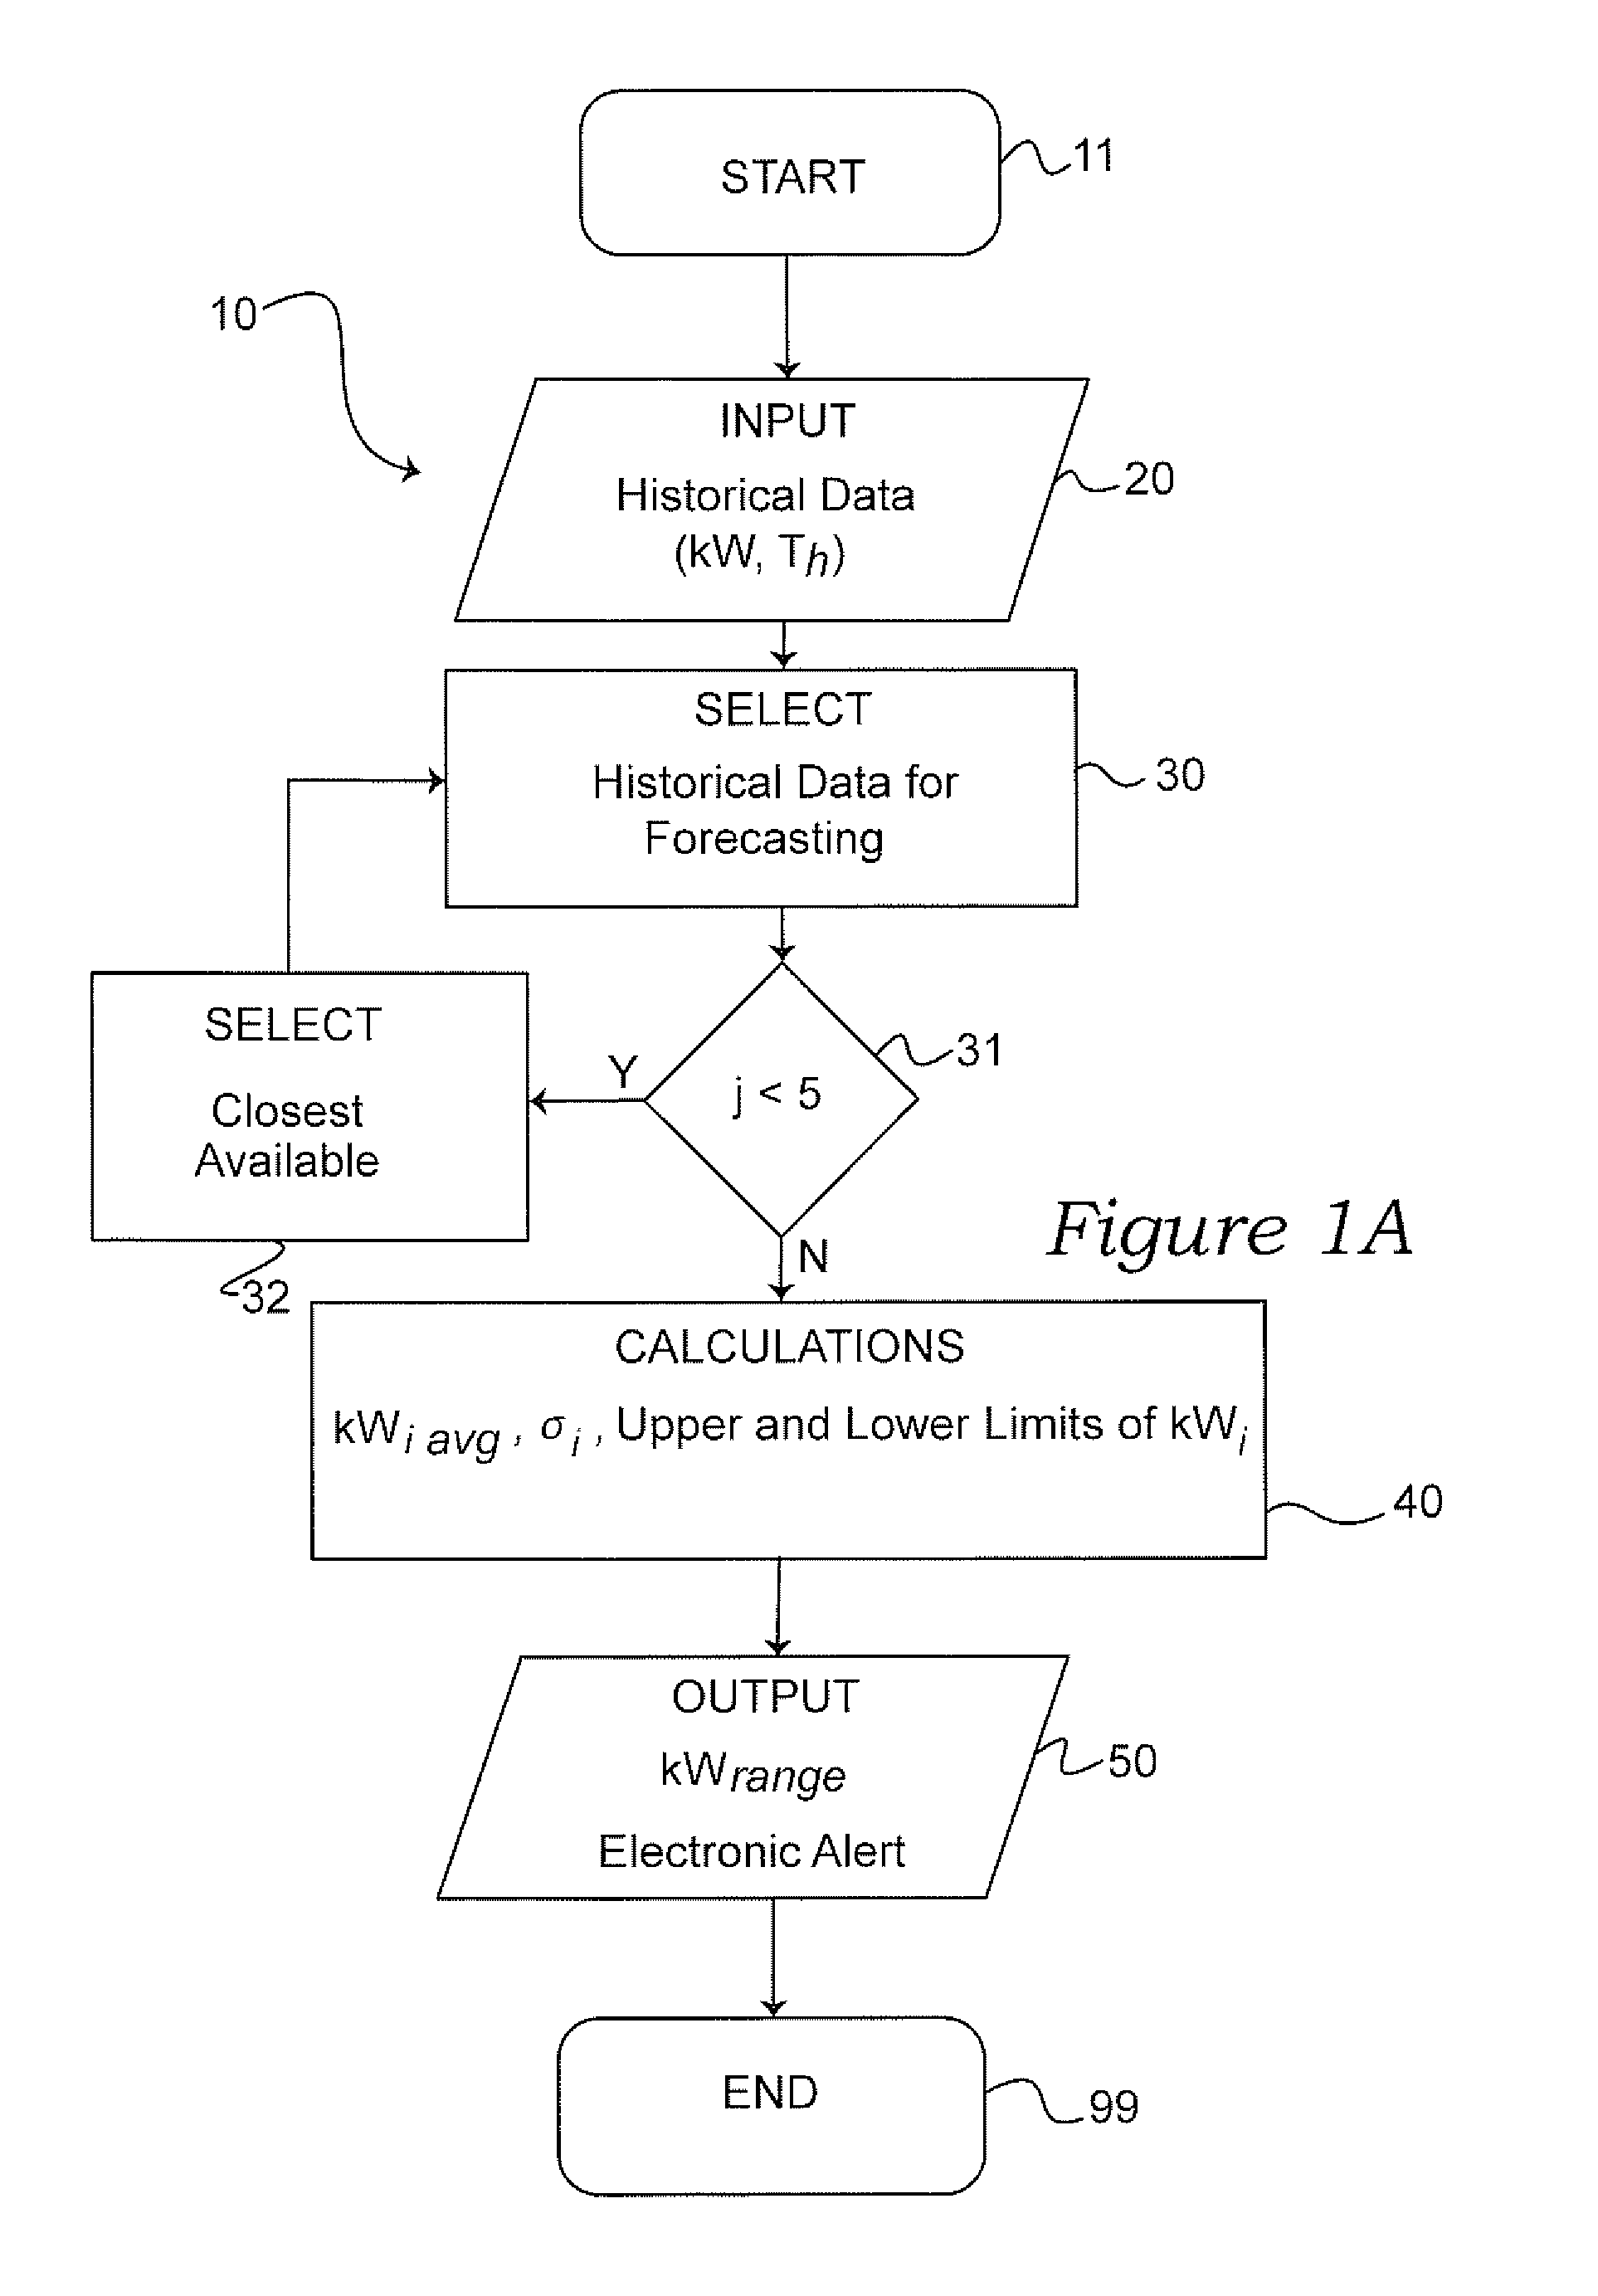
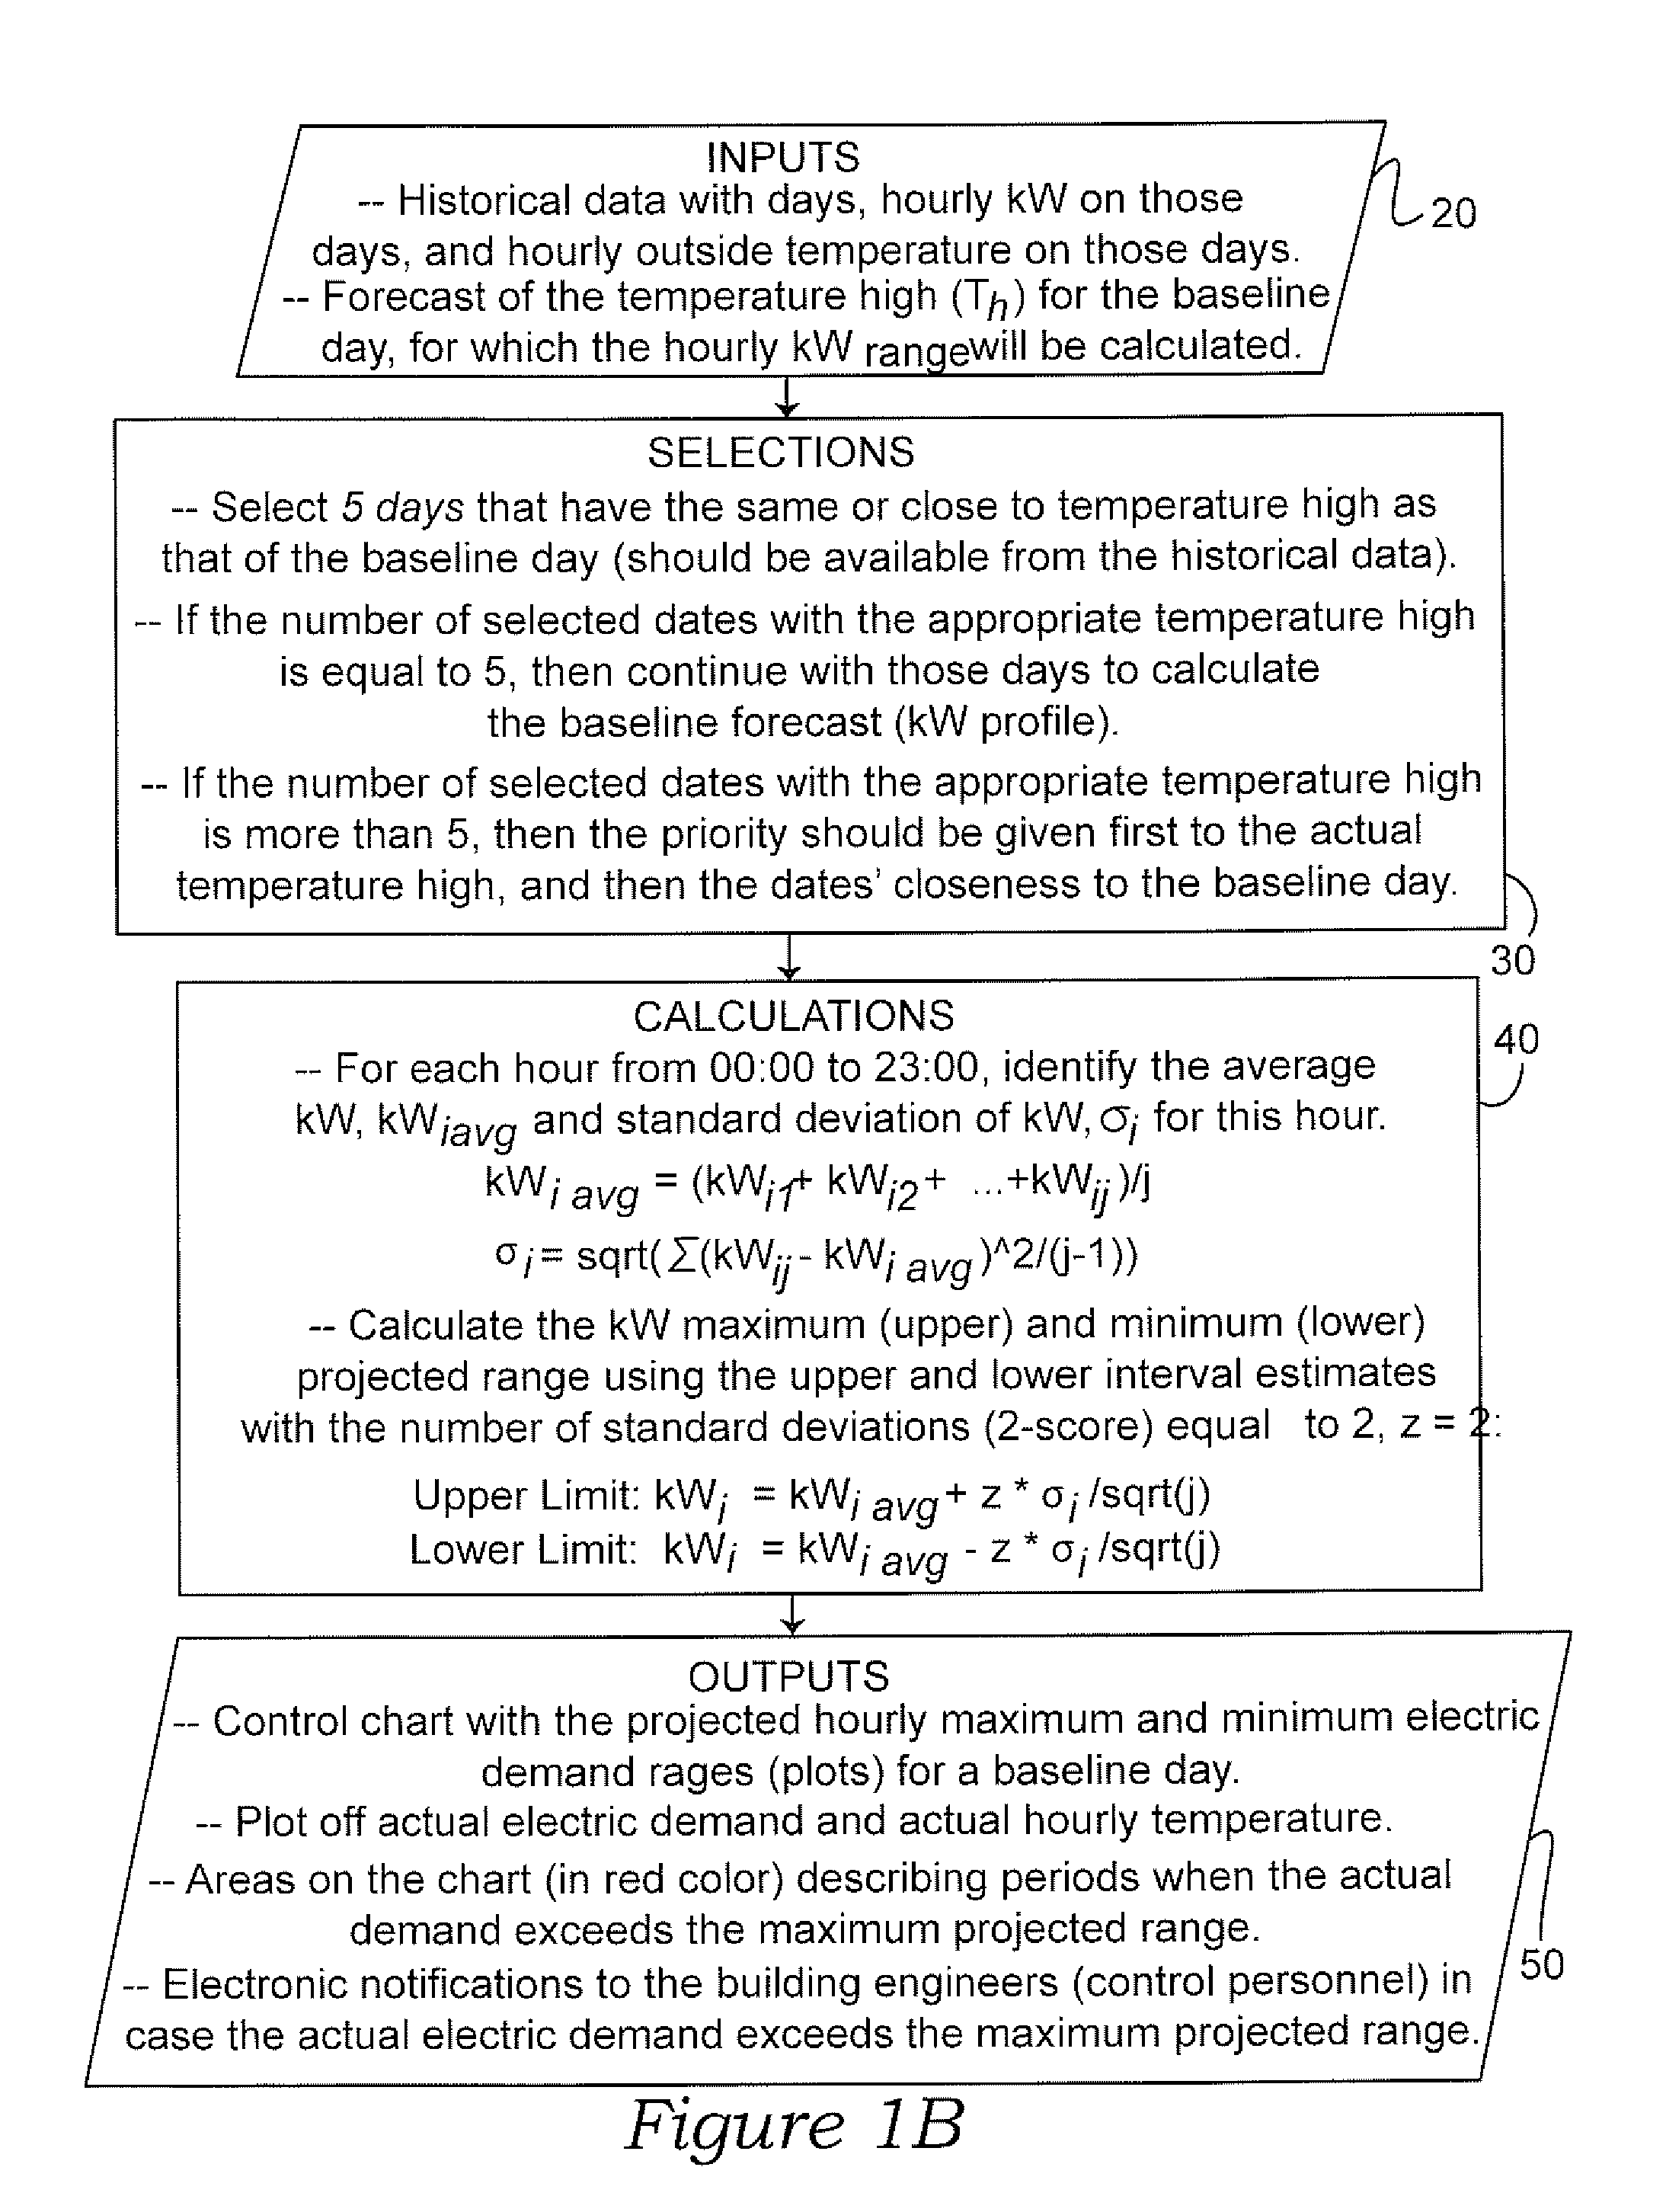
[0040]With regard to FIG. 1A, an overview diagram depicting a preferred flow process 10 of the present invention is illustrated. Generally, the method 10 attempts to first 11 gather historical temperature and electrical demand data 20 for statistical analysis 30, 40. More particularly, hourly electrical demand (kW-h) and peak demand (kW) during the hour against outside temperature is gathered to a historical database 30. Next, a baseline demand forecast 30 for a baseline day is calculated to determine a projected range in demand 40. Eventually, the projected range is compared to a plot 50 of actual hourly demand and also actual hourly temperature as explained in more detail herein.

[0041]For calculating 40 a projected range in peak demand, as illustrated in FIG. 1A and in FIG. 1B, the first step is to select 30 five (5) days 31, historically, that have the same or close to the same temperature high as the forecast high temperature for that baseline day. Next, if the number of selecte...


PUM


Abstract

A method and associated system for monitoring electrical demand performance in a building, industrial complex or university campus is disclosed. According to a preferred method, historical data is initially complied and statically analyzed to determine demand forecast for a baseline day. Further according to the method, electrical demand is plotted with another indication, more particularly outside air temperature. Additionally the invention provides and electronic alert to building engineers when demand falls outside the expected demand range. Still further a control chart is provided with the expected electrical load range. Outside air temperature is also optionally considered historically and in real time in the method. The invention further contemplates commissioning building engineers to reduce demand when a real time demand is higher than an expected energy demand. A system is also disclosed herein having instrumentation and electronic devices controlled by software and transmitting data.

Description

PRIORITY CLAIM[0001]This patent application contains subject matter claiming benefit of the priority date of U.S. Provisional Patent Application Ser. No. 61 / 301,313 filed on Feb. 4, 2010 and entitled, SYSTEM AND METHOD FOR MONITORING ELECTRICAL DEMAND PERFORMANCE, accordingly, the entire contents of this provisional patent application is hereby expressly incorporated by reference.BACKGROUND OF THE INVENTION[0002]1. Field of the Invention[0003]The present invention relates generally to systems and methods for efficient energy usage and resultant monetary gain. More particularly, in a preferred embodiment, the present invention is a system and method to aid building engineers to effectively manage energy demand and energy sources in commercial and industrial HVAC applications.[0004]2. Description of the Art[0005]Energy producers typically charge customers according to electrical demand (measured in kW hour) and also by a peak demand in a given hour (measured in kW). Energy management ...

Claims


Application Information

Patent Timeline
Patent Type & Authority Applications(United States)
IPC IPC(8): G08B21/00
CPCG05B2219/2614G05B13/026
Inventor RADOVILSKY, ZINOVYGUTKIN, EUGENEST. GERMAIN, SCOTT J.PRADO, MARLONROBEROV, EUGENERUIZ, FRANCISCO J.TSUNEHIRO, PATRICK
Owner INTREGATED BUILDING SOLUTIONS
Learn More