Systems and methods of monitoring a patient through frequency-domain photo migration spectroscopy

a technology system, applied in the field of frequency-domain photo migration spectroscopy, can solve the problems of expensive stable light sources, adverse effects on the fdpm phase response, and the use of instrument components and temperature, so as to and reduce the dependency of signal on instrument specific frequency response and temperature

a technology system, applied in the field of frequency-domain photo migration spectroscopy, can solve the problems of expensive stable light sources, adverse effects on the fdpm phase response, and the use of instrument components and temperature, so as to and reduce the dependency of signal on instrument specific frequency response and temperature

US20120165629A1Inactive Publication Date: 2012-06-28MASIMO CORP

Image

  • Systems and methods of monitoring a patient through frequency-domain photo migration spectroscopy
  • Systems and methods of monitoring a patient through frequency-domain photo migration spectroscopy
  • Systems and methods of monitoring a patient through frequency-domain photo migration spectroscopy

Examples


Embodiment Construction

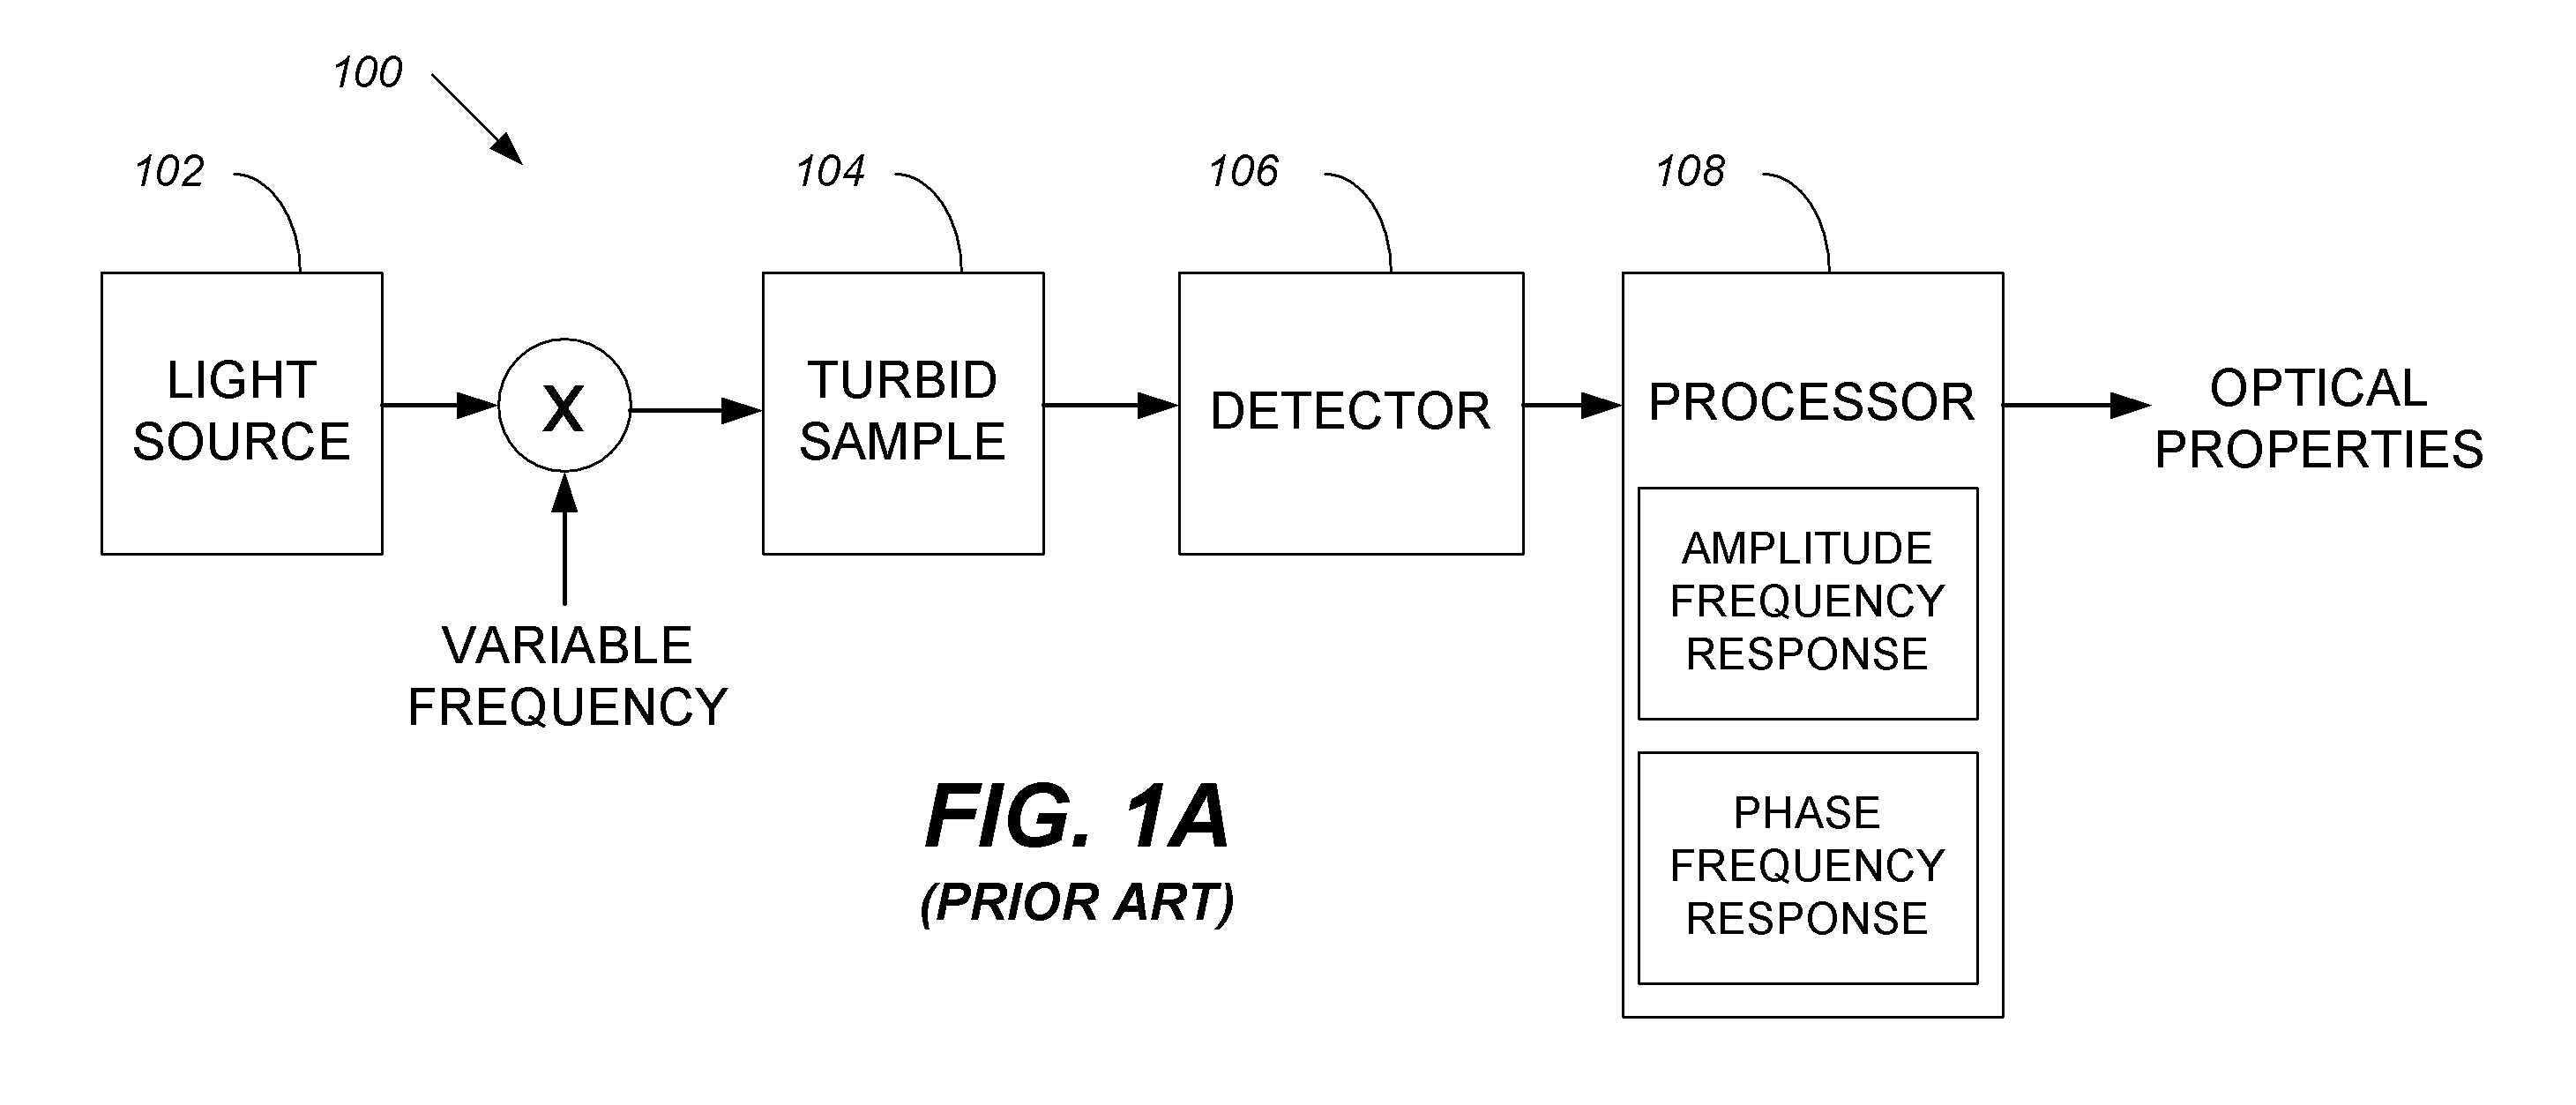
[0020]FIG. 1A illustrates a traditional FDPM system 100 including a for example, sinusoidal light source 102 modulated at variable frequencies irradiating a sample 104. After attenuation and scattering of radiation, a detector 106 receives the light and outputs a signal indicative of the attenuation and scattering to a processor 108. The processor 108 processes the signal to determine bulk optical properties, such as, for example, absorption and scattering of the sample. In an embodiment, the processor 108 may advantageously use an amplitude and phase frequency response in its determination.

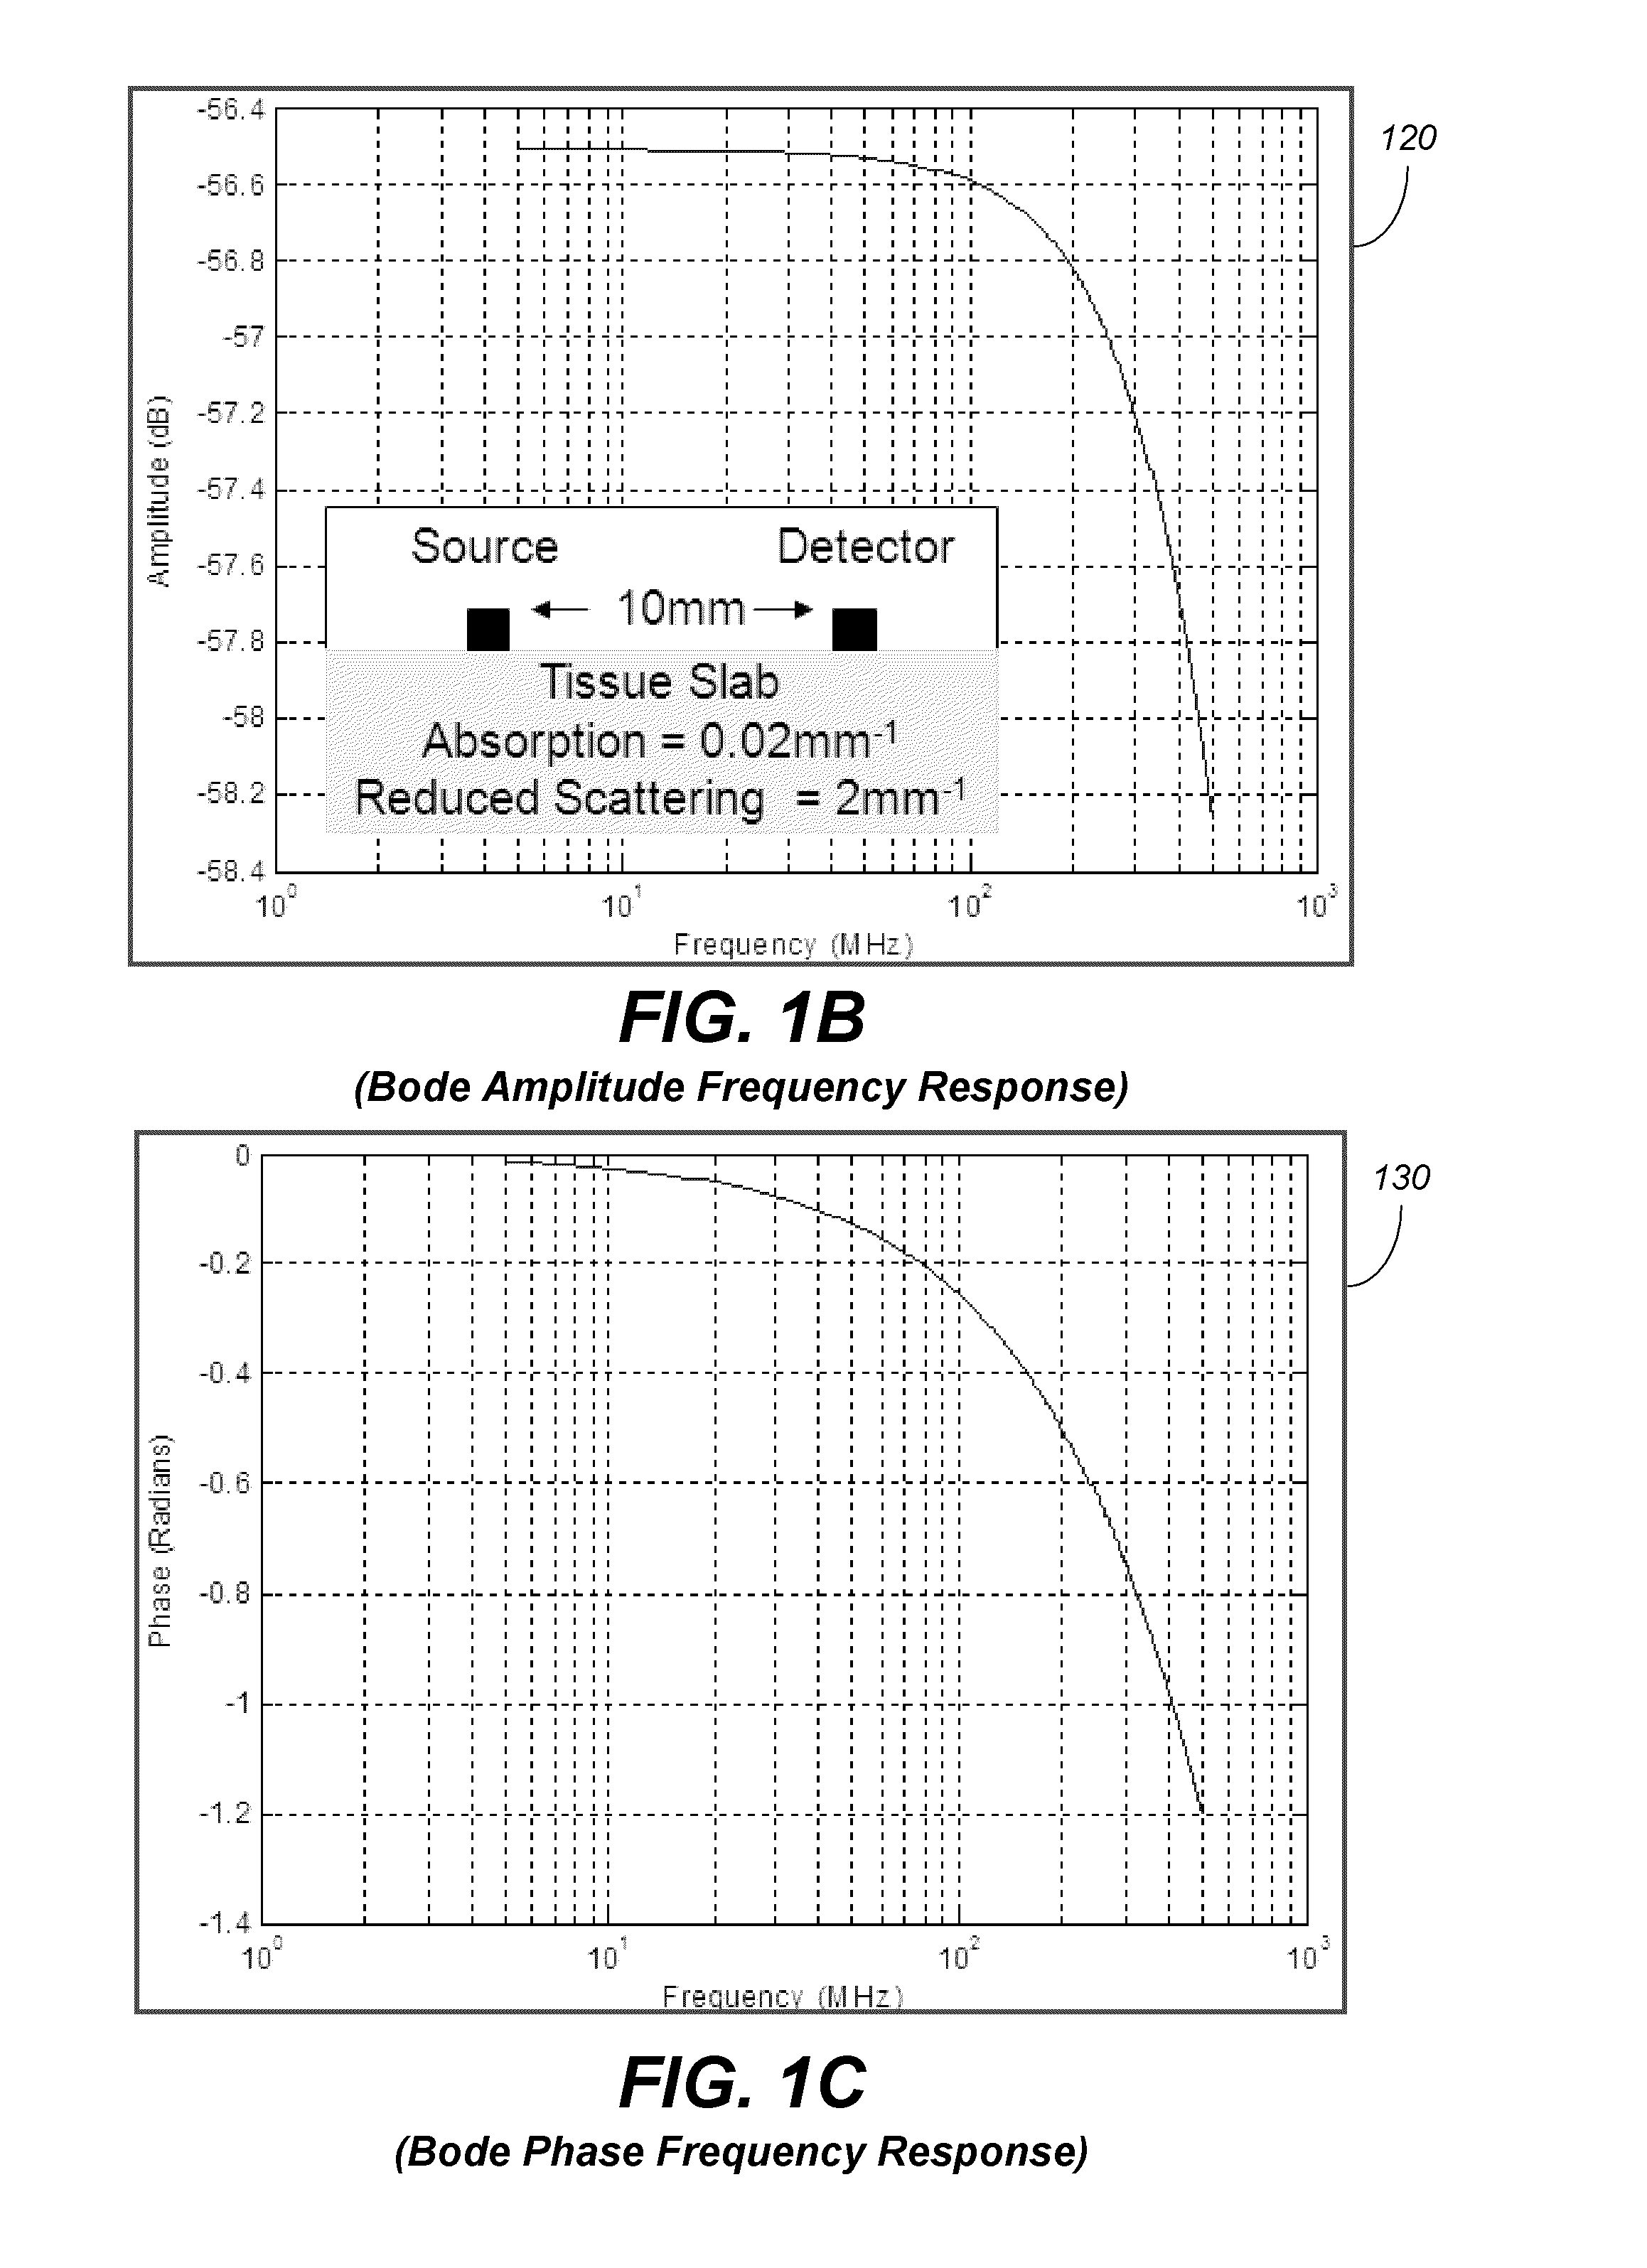
[0021]FIG. 1B illustrates an exemplary Bode plot 120 of the bulk amplitude frequency response of the sample 104 of FIG. 1A. In general, the amplitude plot 120 is a graph of the logarithm of the transfer function of the substantially linear, time-invariant sample versus varied frequency, plotted with a log-frequency axis, to show the system's frequency response. In particular, FIG. 1B shows the am...


PUM


Abstract

FDPM processing provides an amplitude signal and a phase signal at a modulation frequency to improve measurement fidelity during measurement of one or more blood parameters. In an embodiment, a light source modulates light at a modulation frequency around 200 MHz to produce an amplitude and phase plethysmograph, usable to access clinical test data.

Description

REFERENCE TO RELATED APPLICATIONS[0001]The present application claims priority benefit under 35 U.S.C. §119(e) from U.S. Provisional Application No. 61 / 388,545, filed Sep. 30, 2010, entitled “Systems and Methods of Monitoring a Patient Through Frequency-Domain Photo Migration Spectroscopy,” which is incorporated herein by reference.FIELD OF THE DISCLOSURE[0002]The present disclosure relates to the field of monitoring patients through analysis of absorption data. More specifically, the disclosure relates to frequency-domain photo migration spectroscopy.BACKGROUND OF THE DISCLOSURE[0003]Frequency-domain photo migration (“FDPM”) spectroscopy is often used to determine optical properties of turbid samples, including the determination of absorption and scattering properties of the samples. In general, FDPM usually includes irradiating a sample at an air-medium interface with light whose intensity is modulated at variable frequencies, often in the MHz range. A photo-detector receives the ...

Claims


Application Information

Patent Timeline
28 Jun 2012
Publication
US20120165629A1
IPC
A61B5/1455; A61B6/00
CPC
A61B5/14551
Inventors
MERRITT, SEAN; LAMEGO, MARCELO M.