
Method of normalizing a fluorescence analyzer

a fluorescence analyzer and fluorescence technology, applied in the field of fluorescence analysis, can solve the problems of increasing the cost associated with the manufacture and qualification of such analyzers, and reducing the level of variation to insignificant levels

Active Publication Date: 2012-11-29
IDEXX LABORATORIES
View PDF2 Cites 14 Cited by
  • Summary
  • Abstract
  • Description
  • Claims
  • Application Information

AI Technical Summary

Benefits of technology

[0024]In yet still another embodiment, one or more fitting parameters specific to the interaction of the sensor spectra with the analyzer spectra are used in calc

Problems solved by technology

However, producing filters and source(s) (e.g., LED(s)) for use in the analyzers that are optimized to the required individual analyzer accuracy such that wavelength variation is reduced to insignificant levels would significantly increase the costs associated with the manufacture and qualification of such analyzers.

Method used


Image

  • Method of normalizing a fluorescence analyzer
  • Method of normalizing a fluorescence analyzer
  • Method of normalizing a fluorescence analyzer

Examples


embodiment 1

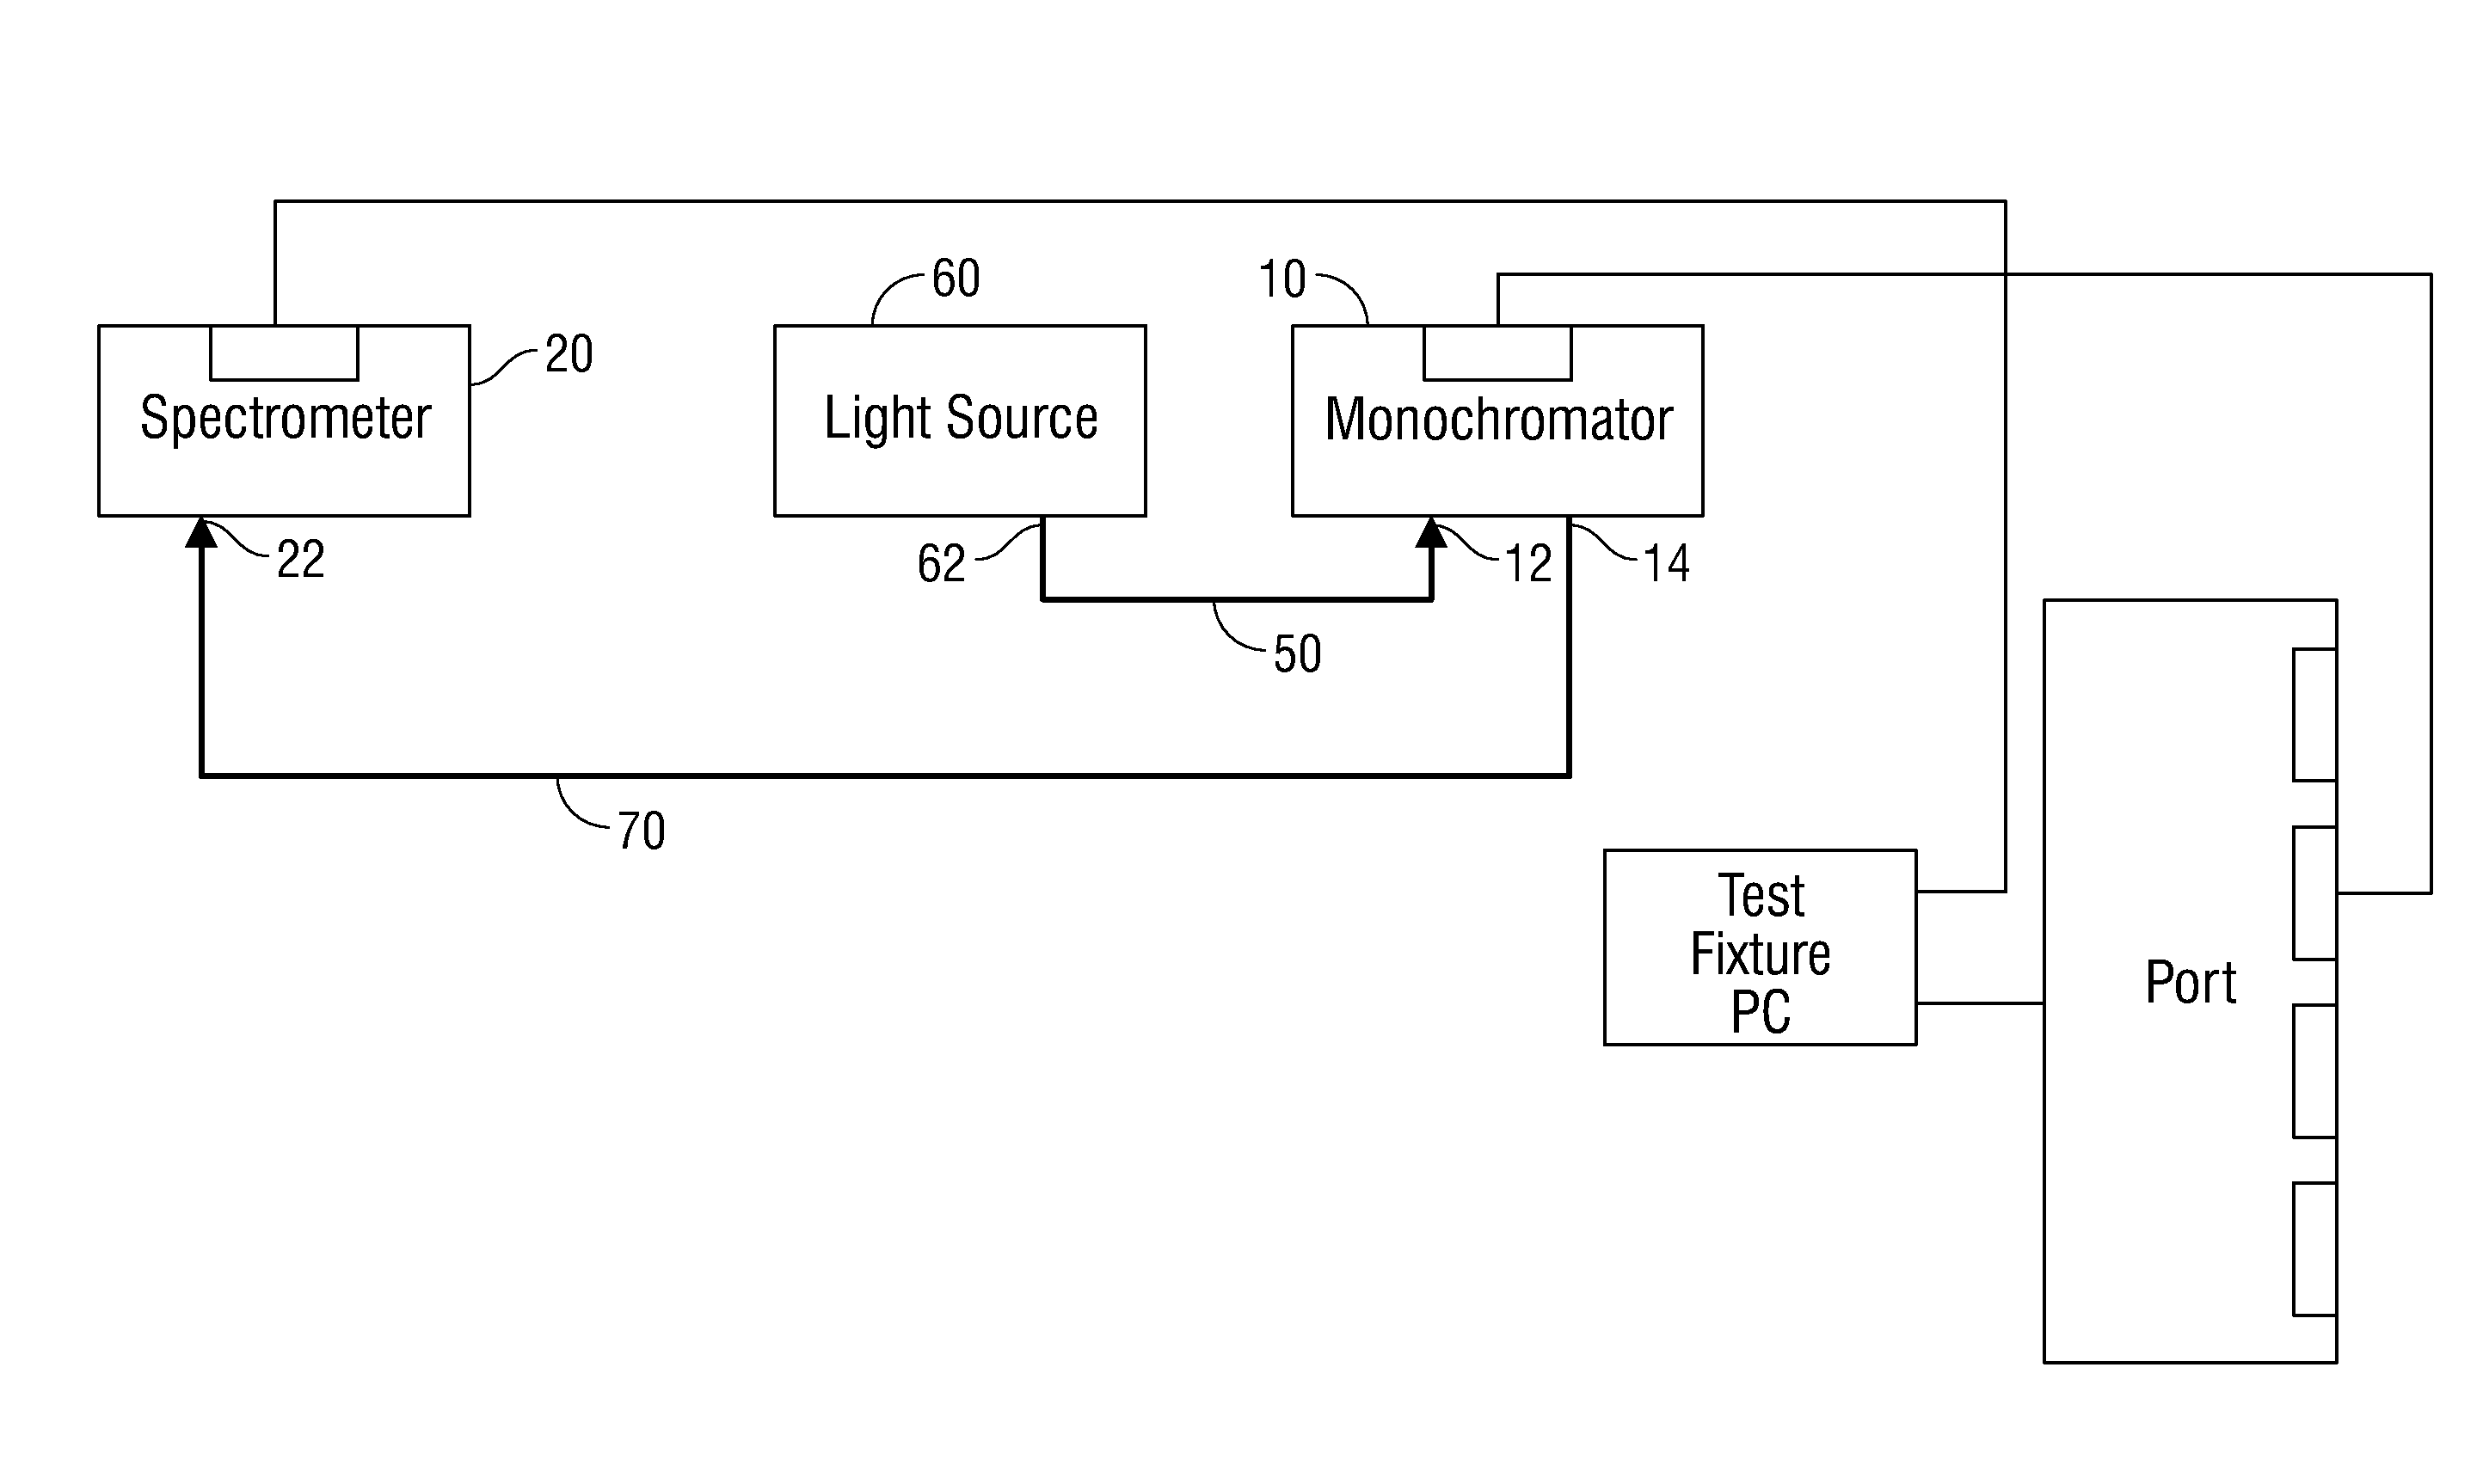
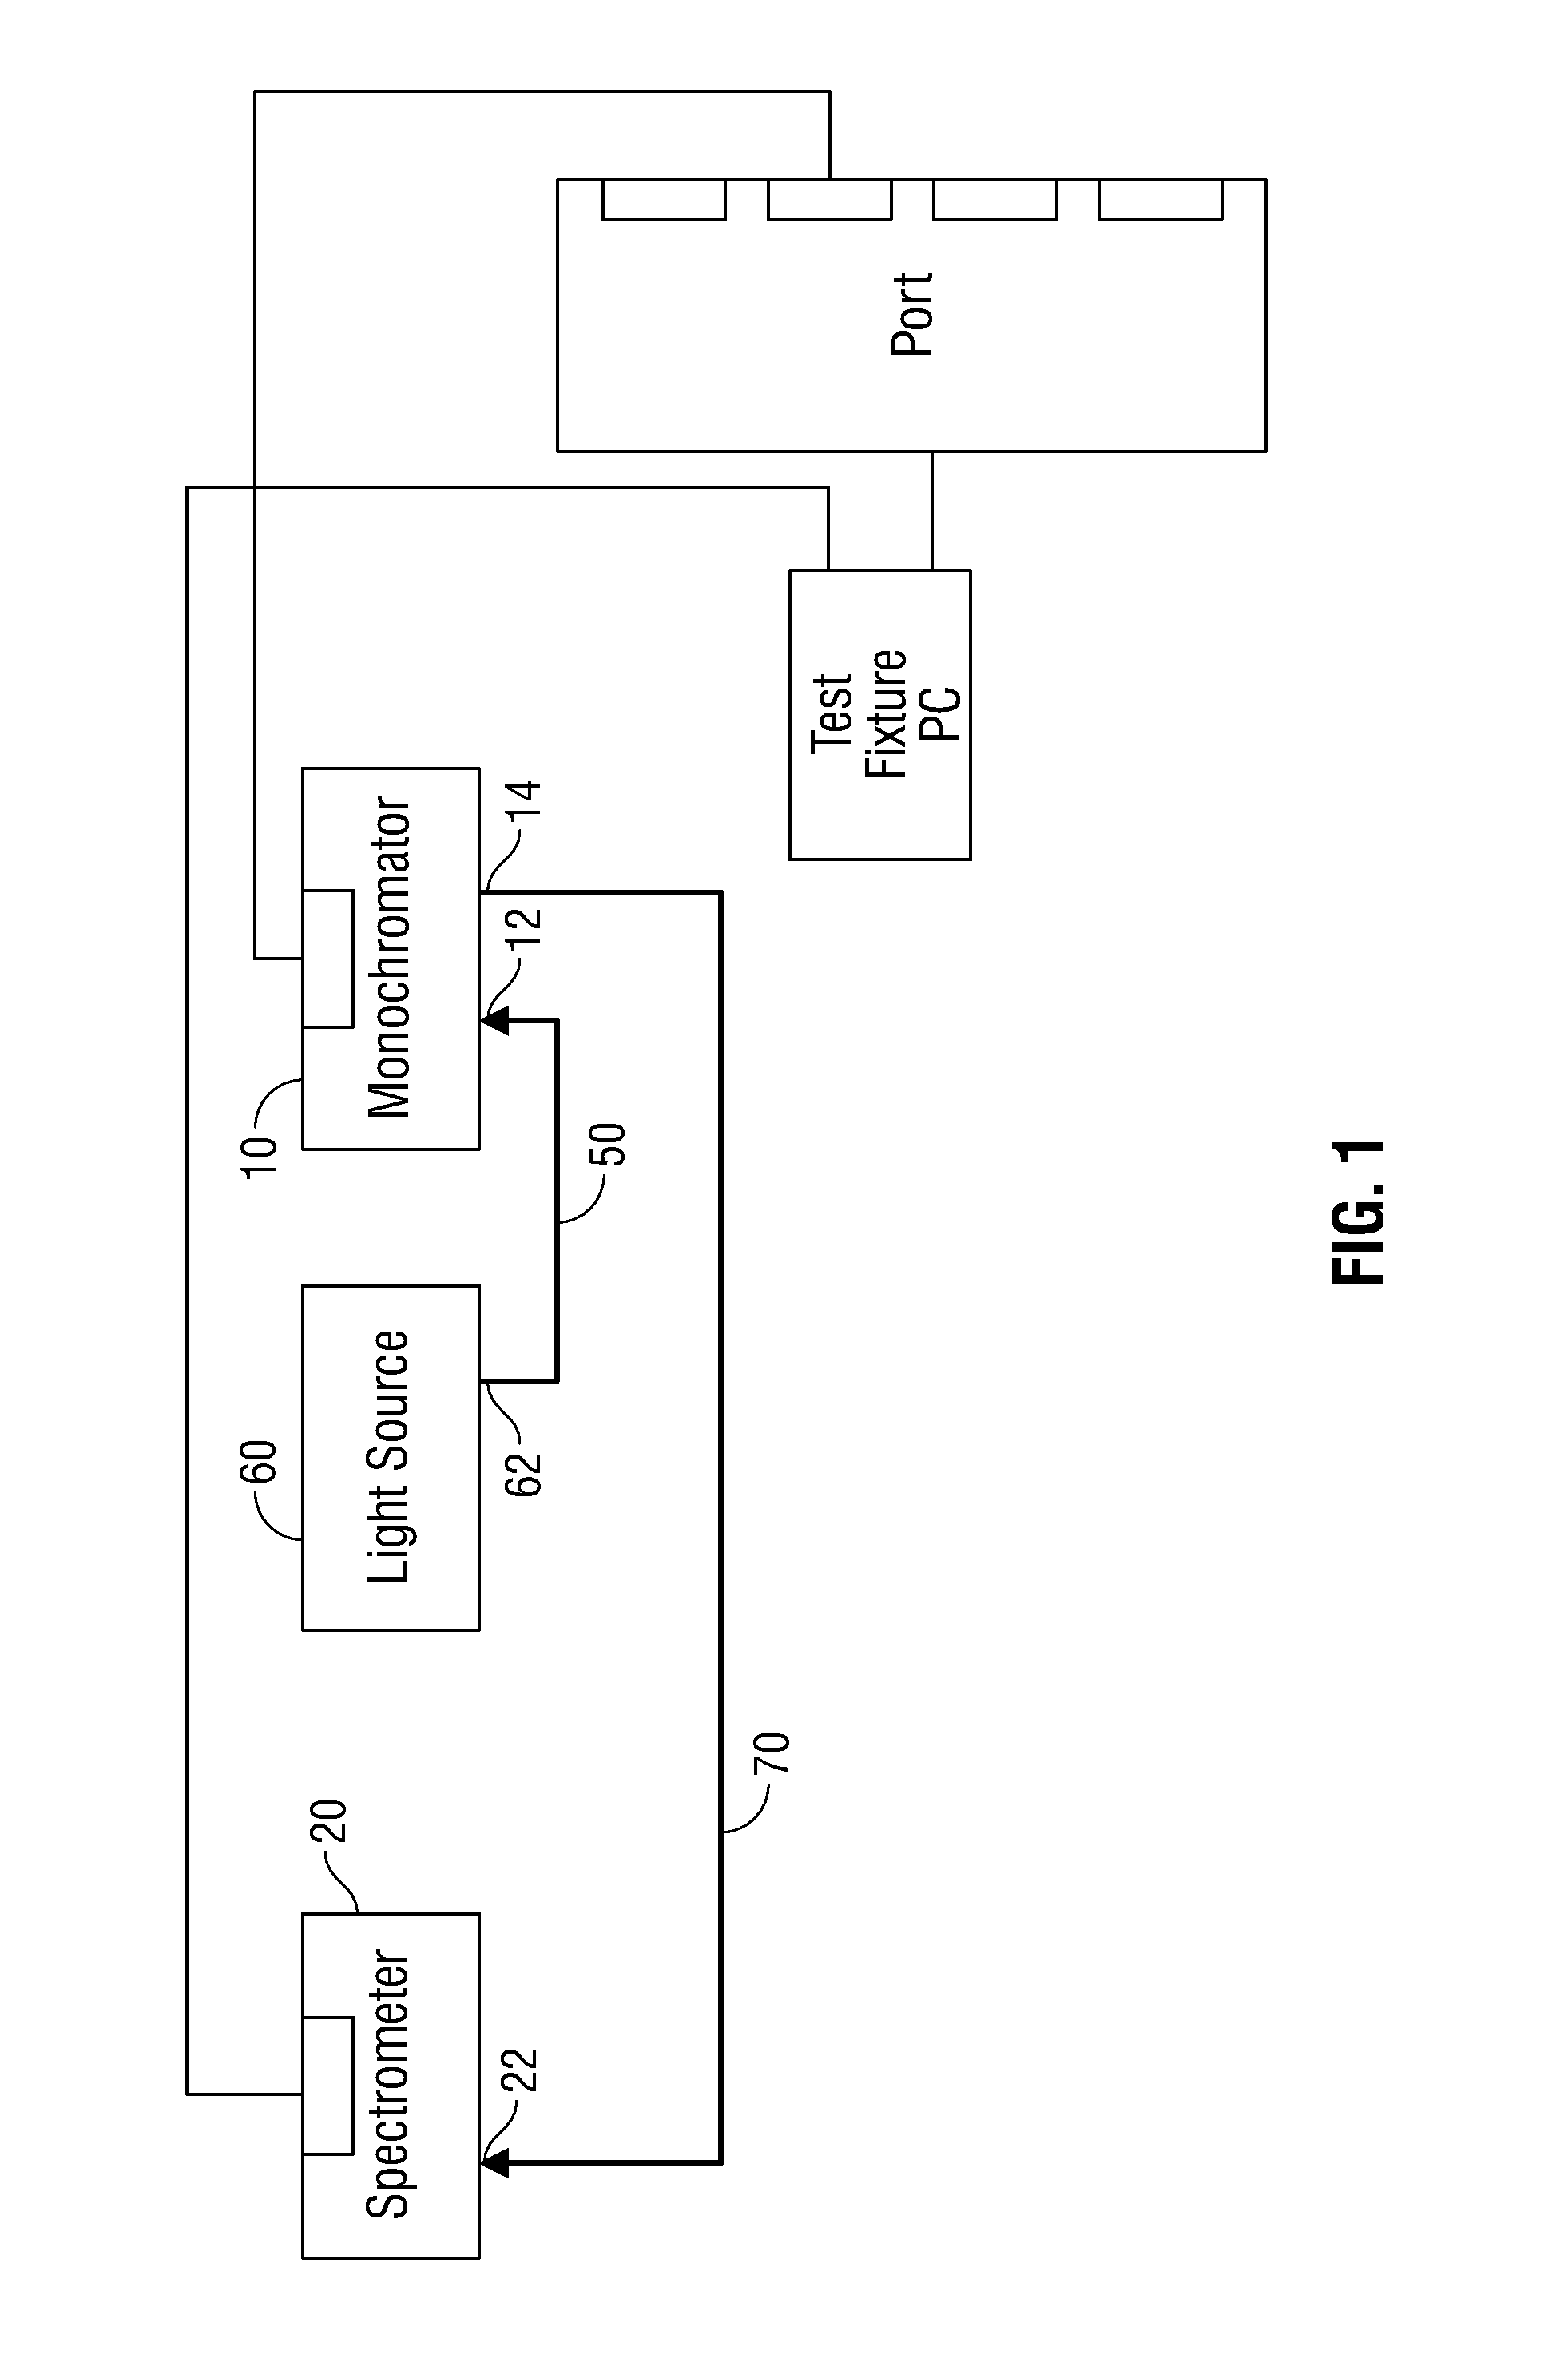
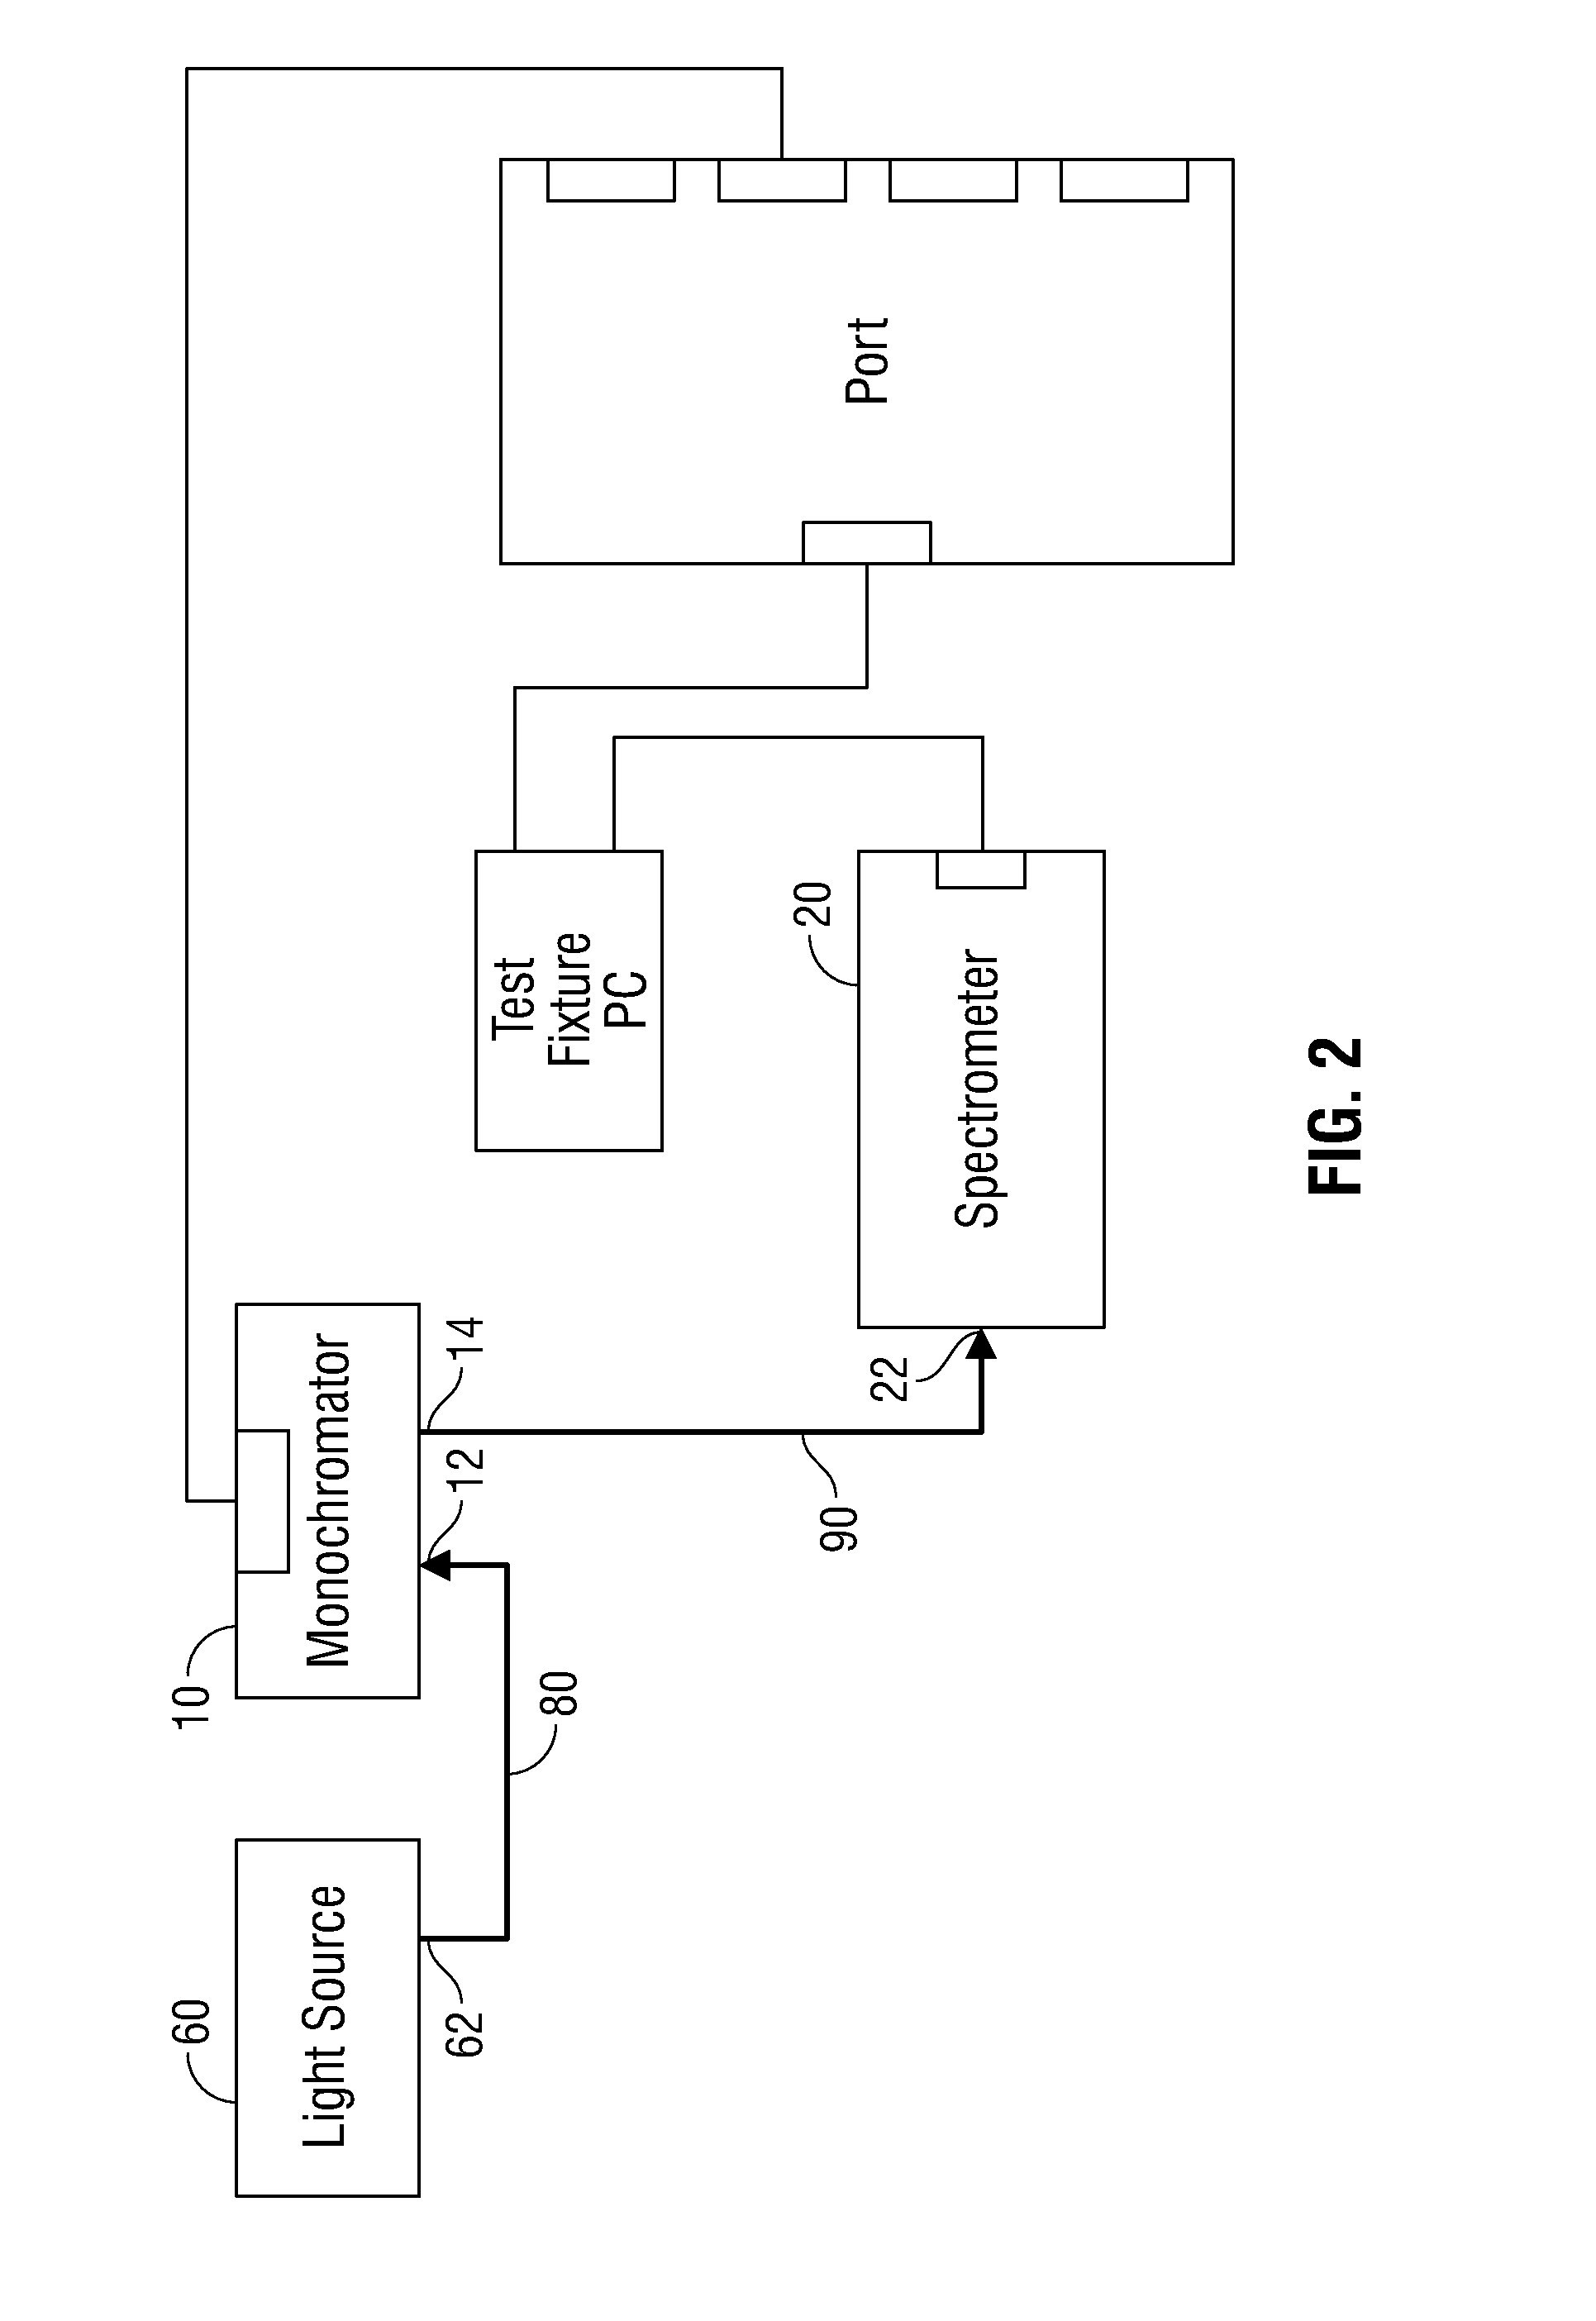
[0075]Initially, as discussed above, the module excitation spectrum data, relative irradiance as a function of wavelength, f(λi)m,ex,in, is collected as (wavelength, relative irradiance) ordered pairs, and is indexed accordingly. The module emission sensitivity data, detector counts as a function of monochromator step, is converted to (wavelength, relative irradiance sensitivity) ordered pairs in accordance with the monochromator calibration information discussed above, to yield a relative irradiance sensitivity spectrum as a function of wavelength, f(λi)m,em,corr. This emission sensitivity spectrum may be overlapped with a composite dry slide emission spectrum to minimize the effects of portions of the module emission sensitivity spectrum unimportant for calculating module normalization factors. Further, as mentioned above, both data sets may be filtered. The subscripts m, ex or em, and in or corr indicate, respectively, the specific module, excitation or emission sensitivity, and ...

embodiment 2

[0085]In another embodiment, as discussed above, the overlap between the spectra, e.g., the excitation and emission spectra, of the module and the slide, e.g., the fluorophore or sensor, is analyzed to determine the normalization factor for a particular analyzer and electrolyte to be detected. The relative overlap between the spectra is important because, for example, a particular module may more effectively excite the fluorescence of an “early” or “late” sensor (i.e., where there is greater overlap between the spectra) or may less effectively excite the “late” or “early” fluorescence of the sensor (i.e., where the spectra are less overlapped) thereby introducing a bias (or biases) toward and / or against a particular sensor's analyzer response. However, by analyzing the overlap between the spectra of the module and the “early” and “late” sensor spectra, such variations, or biases, can be accounted for in determining the normalization factor for a particular module and electrolyte (or...


PUM


Abstract

A method of normalizing an analyzer response value of a fluorescence analyzer is provided. The method includes measuring an excitation spectrum of the analyzer and measuring an emission sensitivity spectrum of the analyzer. Next, a normalization factor based at least in part upon the excitation spectrum of the analyzer and the emission sensitivity spectrum of the analyzer is determined. The sample is then analyzed to obtain an uncorrected analyzer response value. A normalized analyzer response value is calculated based at least in part upon the uncorrected analyzer response value and the normalization factor.

Description

BACKGROUND[0001]1. Technical Field[0002]The present disclosure relates to fluorescence analysis and, more particularly, to methods of normalizing fluorescence analyzers according to specific wavelength characteristics thereof.[0003]2. Background of Related Art[0004]Filter fluorometry refers generally to the process of illuminating a sample and quantitating the resulting, detected fluorescence signal. A filter fluorometer, designed to perform fluorometry, employs one or more light sources, optical filters, and detectors to select the wavelength ranges of both the illuminating light and the light detected. Generally, these two kinds of wavelength ranges do not overlap to any appreciable extent, and the detection wavelengths are longer than the illumination wavelengths. Using a predetermined calibration curve, the detected signal is correlated to the amount of fluorescent component present in the sample. For example, filter fluorometry (hereafter, simply “fluorometry”) may be used to m...

Claims


Application Information

Patent Timeline
IPC IPC(8): G01J3/30
CPCG01J3/28G01J3/4406G01N2201/124G01N2021/6417G01N21/64
Inventor MISENER, GARLAND CHRISTIANMILAN, JAMES EDWARDLACHAPELLE, ROBERT W.
Owner IDEXX LABORATORIES
Learn More