Lactate sensor
a lactate sensor and sensor technology, applied in the field of lactate sensors, can solve the problem of requiring a further reduction of measurement time, and achieve the effect of accurate measurement of lactate concentration and short period of tim
- Summary
- Abstract
- Description
- Claims
- Application Information
AI Technical Summary
Benefits of technology
Problems solved by technology
Method used
Image
Examples
example 1
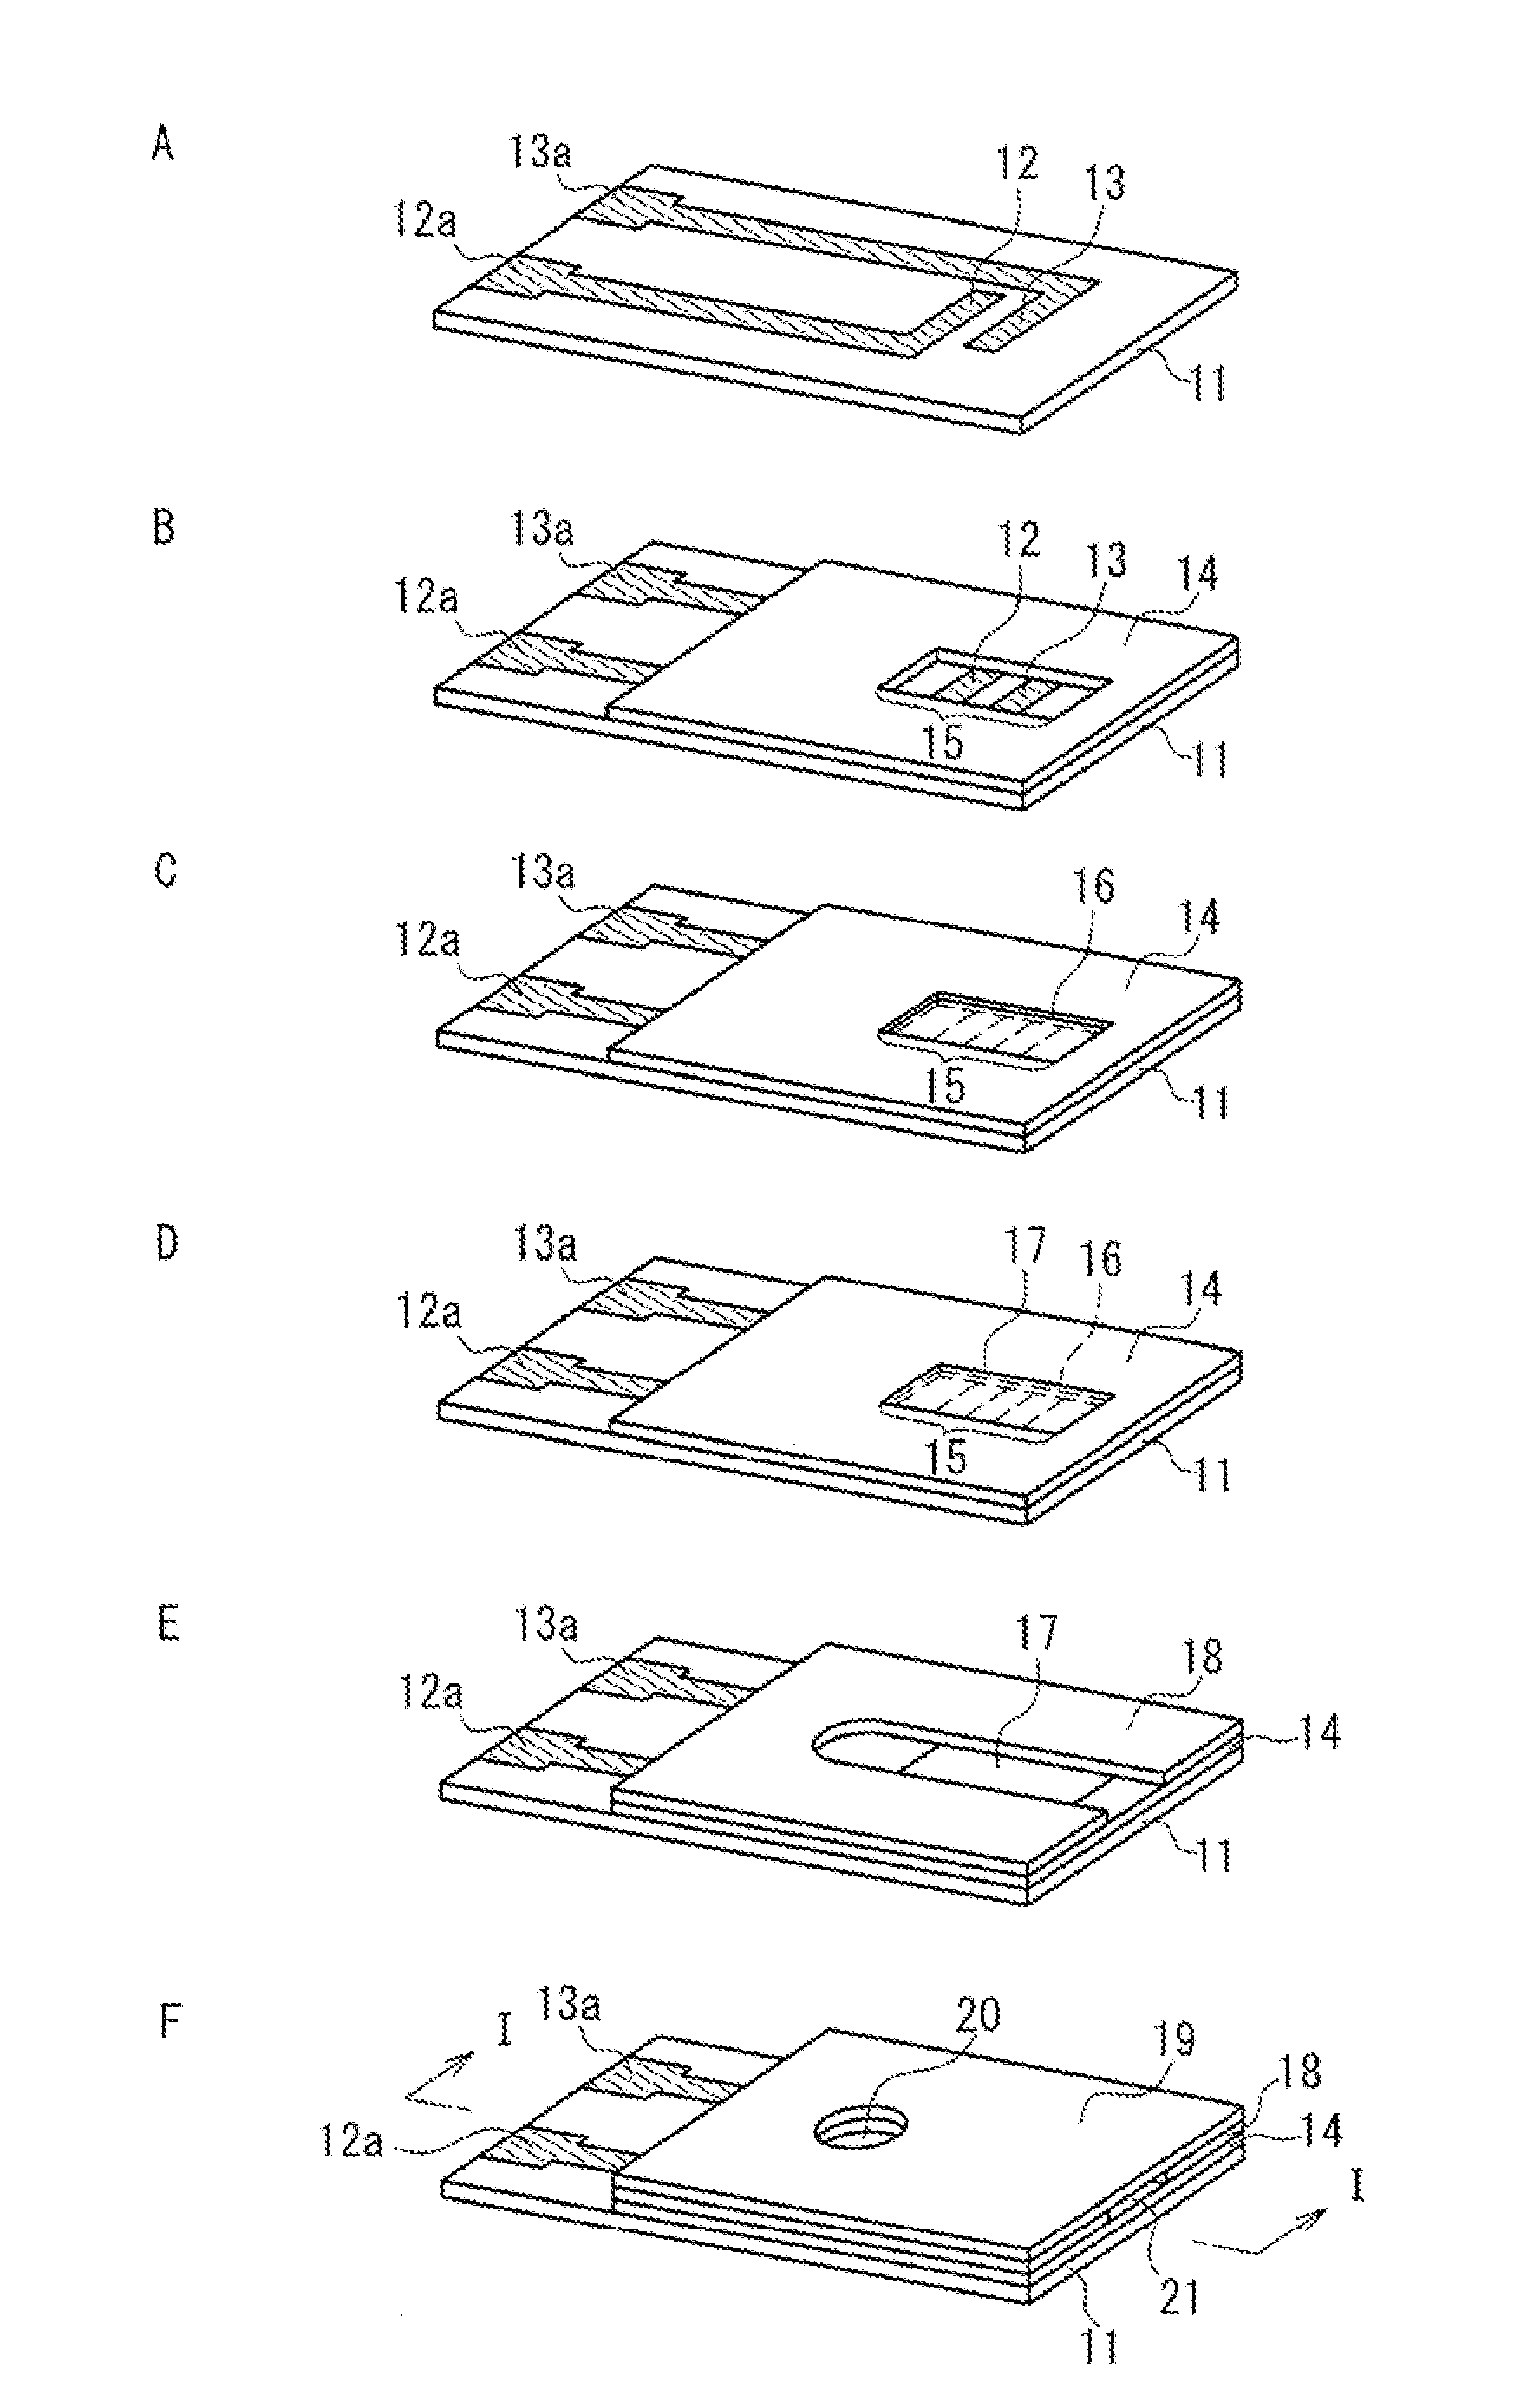
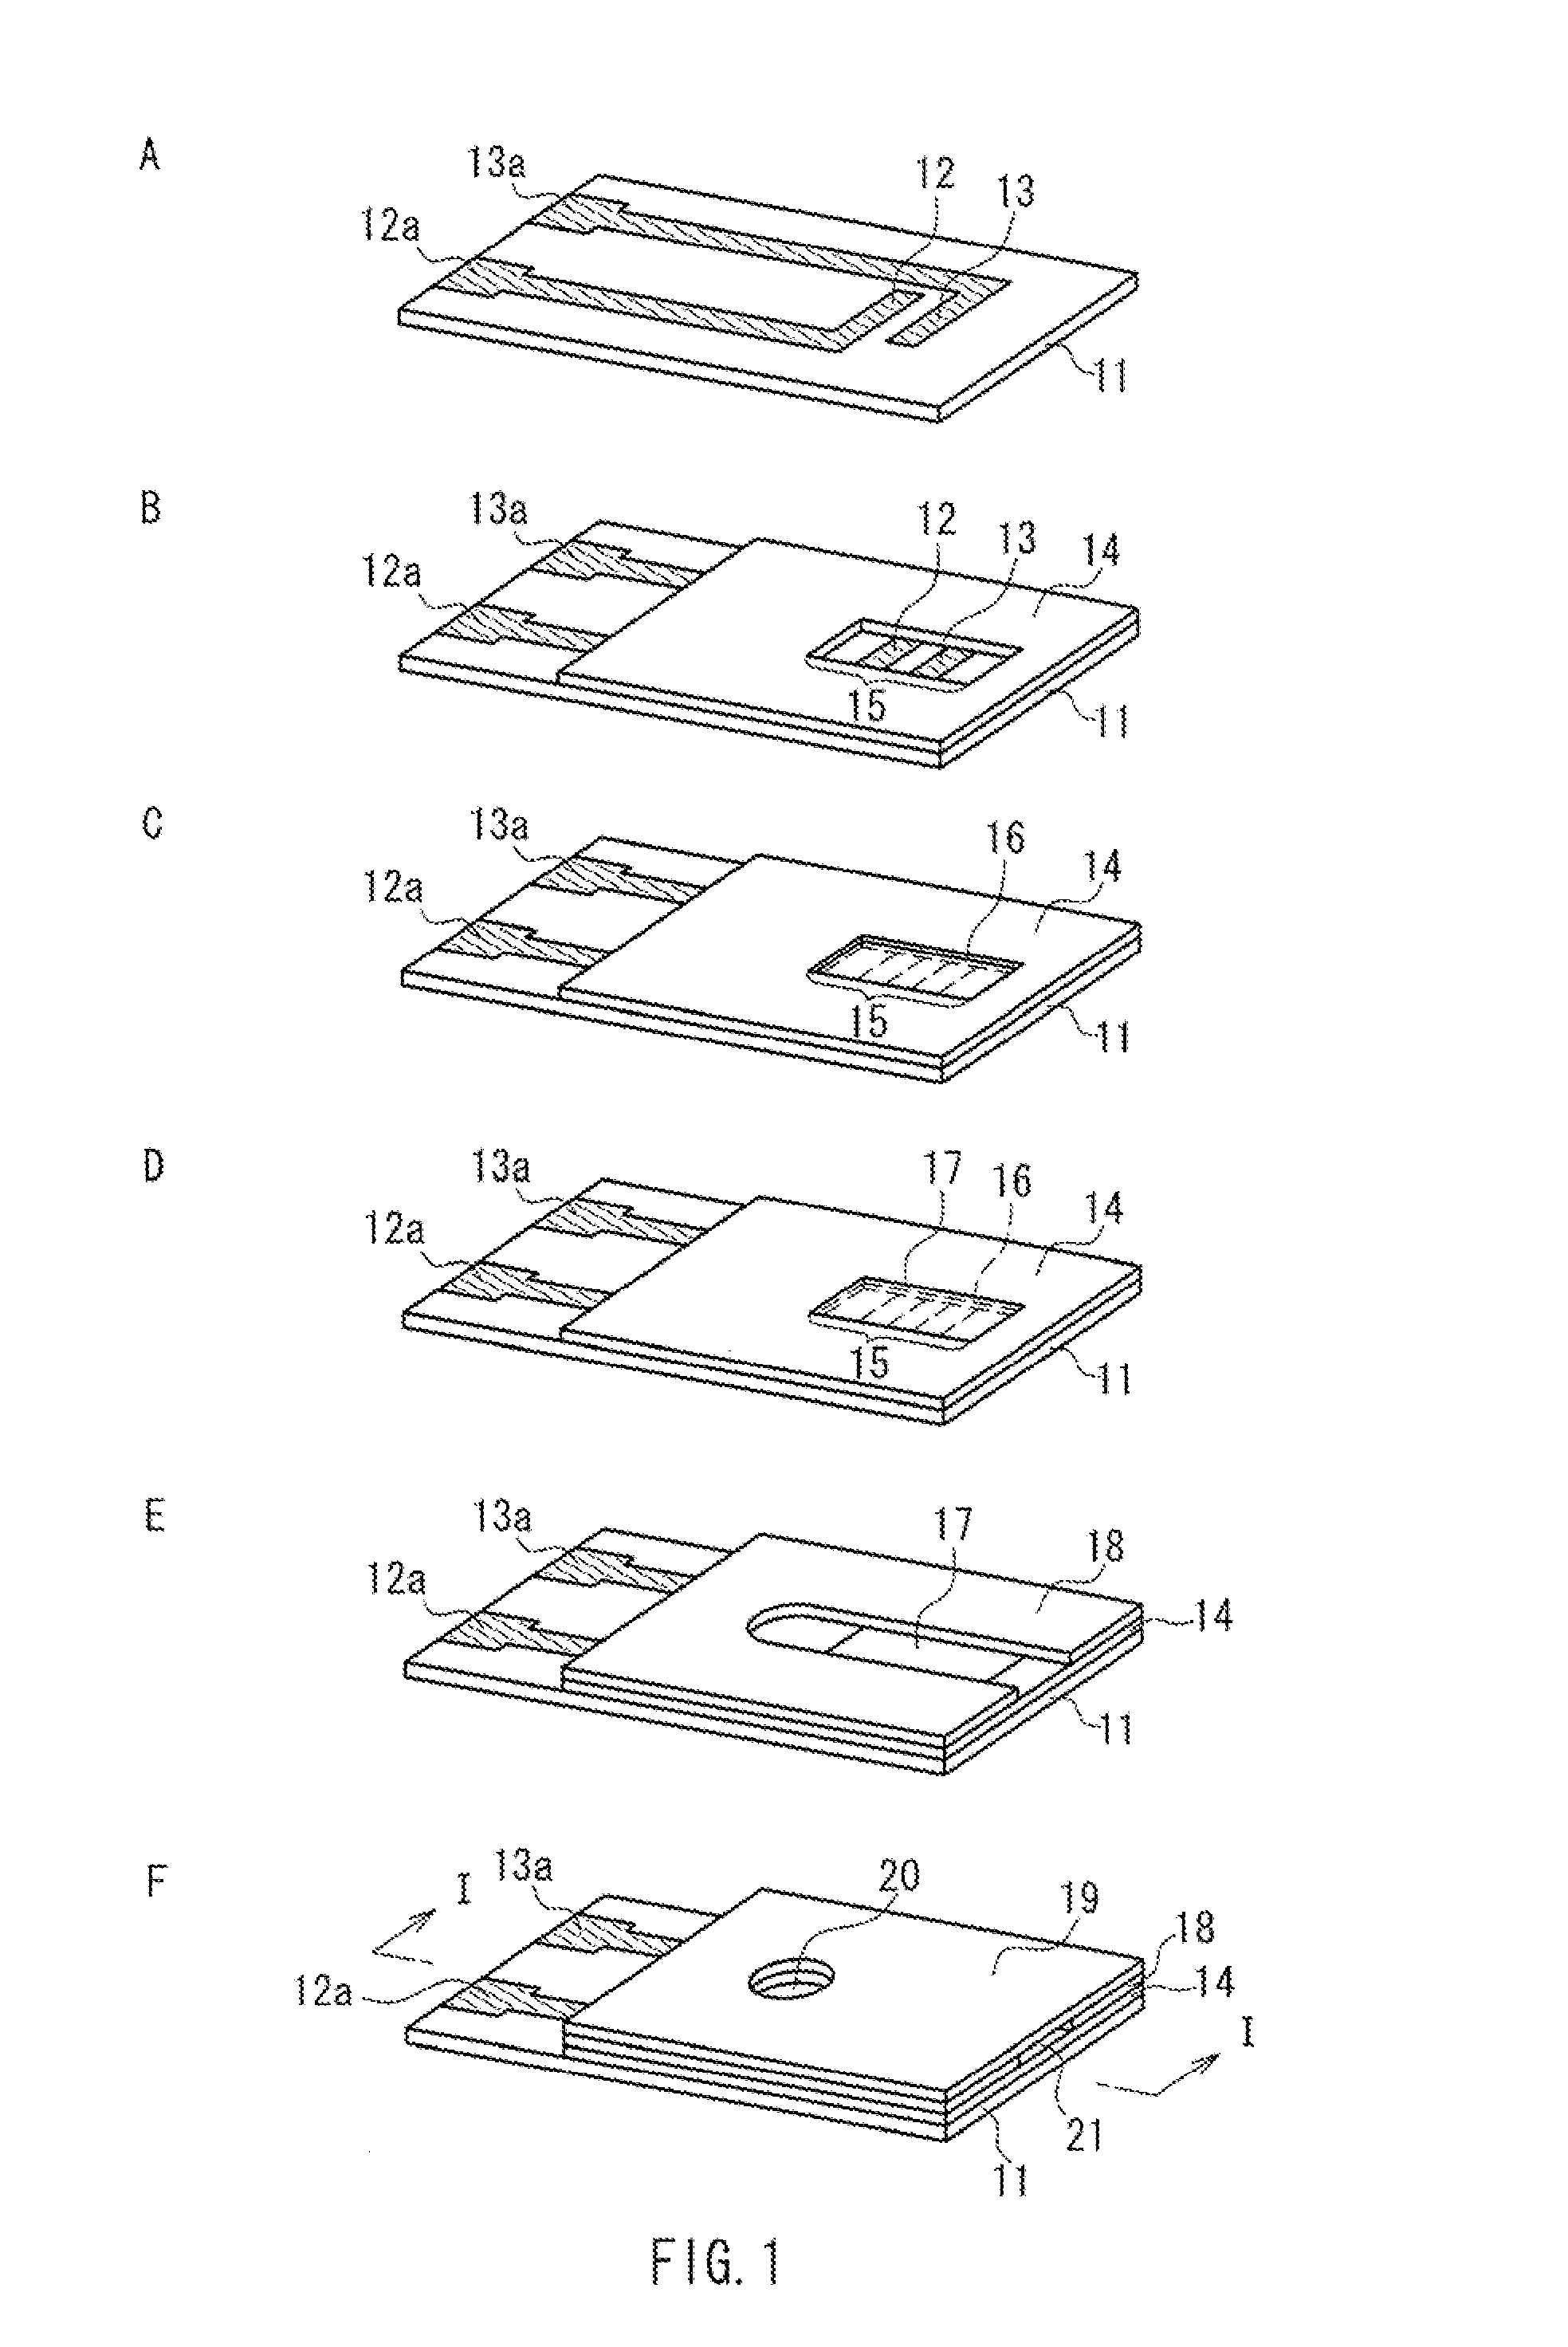
[0076]The lactate sensor of Example 1 having the same structure as the lactate sensor shown in FIG. 1 was prepared in the following manner.
[0077]First, a PET substrate (having a length of 50 mm, a width of 6 mm, and a thickness of 250 μm) was provided, as an insulating substrate 11 of a lactate sensor, and a carbon electrode system composed of a working electrode 12 and a counter electrode 13 having a lead 12a and a lead 13a, respectively, was formed by screen printing on one surface of the substrate.
[0078]Next, an insulating layer 14 was farmed on the electrode system as described below. First, an insulating paste was prepared by dissolving a polyester insulating resin in a carbitol acetate solvent so as to reach a concentration of 75 wt %, and the paste was scram-printed on the electrode system. Printing conditions included a 300 mesh screen, a squeegee pressure of 40 kg, and a printing amount of 0.002 mL / cm2 of the electrode area. Screen-printing was not performed on a detecting ...
example 2
[0085]A lactate sensor was prepared in the same manner as in Example 1 except that the second reagent solution contained 0.5 wt % of dextran (a molecular weight of 5000 to 10000, trade name “dextran”, Nacalai Tesque, Inc.). Lactate was measured in the same manner as in Example 1 except that the lactate sensors of Examples 1 and 2 were used, venous whole blood samples with adjusted lactate concentrations (lactate concentrations of 4, 6, 10, 18, and 24 mg / dL) were used, and the measurement temperature was 25° C. or 10° C. Results are shown in FIG. 4FIG. 4A is a graph showing the results obtained at a measurement temperature of 25° C. and FIG. 4B is a graph showing the results obtained at a measurement temperature of 10° C. In FIGS. 4A and 4B, squares represent data for the lactate sensor of Example 1, and rhombuses represent data for the lactate sensor of Example 2.
[0086]It was confirmed that the lactate sensors of Examples 1 and 2 both enable a measurement in a very short measurement...
example 3
[0087]Lactate sensors were prepared in the same manner as in Example 2 except that the molecular weight of the dextran used was 100 to 500, 1000 to 2000, or 10000 to 20000, and lactate was measured using these sensors. The same results as those obtained from the lactate sensor of Example 2 in which dextran having a molecular weight of 5000 to 10000 was used were obtained (data not shown).
PUM
| Property | Measurement | Unit |
|---|---|---|
| Concentration | aaaaa | aaaaa |
Abstract
Description
Claims
Application Information
 - R&D
- Intellectual Property
- Life Sciences
- Materials
- Tech Scout
- Unparalleled Data Quality
- Higher Quality Content
- 60% Fewer Hallucinations
Browse by: Latest US Patents, China's latest patents, Technical Efficacy Thesaurus, Application Domain, Technology Topic, Popular Technical Reports.
© 2025 PatSnap. All rights reserved.Legal|Privacy policy|Modern Slavery Act Transparency Statement|Sitemap|About US| Contact US: help@patsnap.com


