Characterization of Subvisible Particles Using a Particle Analyzer

a particle analyzer and sub-visible technology, applied in the field of characterization of sub-visible particles using a particle analyzer, can solve the problems of significant morbidity, patient suffering and even death, and the immune response can have devastating effects

Active Publication Date: 2013-07-11
TAKEDA PHARMA CO LTD
View PDF4 Cites 8 Cited by
  • Summary
  • Abstract
  • Description
  • Claims
  • Application Information

AI Technical Summary

Benefits of technology

[0006]The present specification provides methods for simultaneous detection, counting and characterization of subvisible particles. Unlike other methods, the presently disclosed methods provide information about the nature (e.g., proteinaceous v. non-proteinaceous), composition, property (e.g., a structural, functional or chemical property), amount, and size of detected subvisible particles. This, in part, is accomplished by the use of a fluorescent dye that detects subvisible particles below 1 μm. This detection can allow for the identification of such subvisible particles from background noise as well as the distinction of proteinaceaous subvisible particles from non-proteinaceaous subvisible particles and the identification a particular composition or property presence in (or absence from) the proteinaceaous subvisible particles. Additionally, the disclosed methods allow for the characterization of individual particles while analyzing a bulk sample.

Problems solved by technology

Factors that reduce or eliminate the effectiveness of a protein-based treatment can lead to patient suffering and even death.
For example, in the case of treatment of hemophilia A, neutralizing antibodies to Factor VIII can cause life-threatening bleeding episodes, resulting in significant morbidity and necessitating treatment with a prolonged course of a tolerance-inducing therapy to reverse immunity.
If the endogenous protein serves a nonredundant biological function, such an immune response can have devastating results.
As such, protein aggregates have the potential to negatively impact clinical performance.
Such factors include a change in the type of filling pump during scale-up to commercial manufacturing, changes in formulation or container / closure, and even unintentional changes in the manufacturing process such as alterations in filling pump mechanical parameters or other unforeseen factors.
However, smaller protein aggregates usually do not constitute a sufficient mass fraction of the protein population to be quantified based on aggregate mass or loss of monomeric protein.
Even though protein aggregates are potentially immunogenic, current United States Pharmacopeia (USP) particulate testing is not designed to monitor or assess the presence of protein aggregates in a therapeutic protein product.

Method used


Image

  • Characterization of Subvisible Particles Using a Particle Analyzer
  • Characterization of Subvisible Particles Using a Particle Analyzer
  • Characterization of Subvisible Particles Using a Particle Analyzer

Examples


example 1

Establishing Limits of Size Detection and Size Distribution Ranges

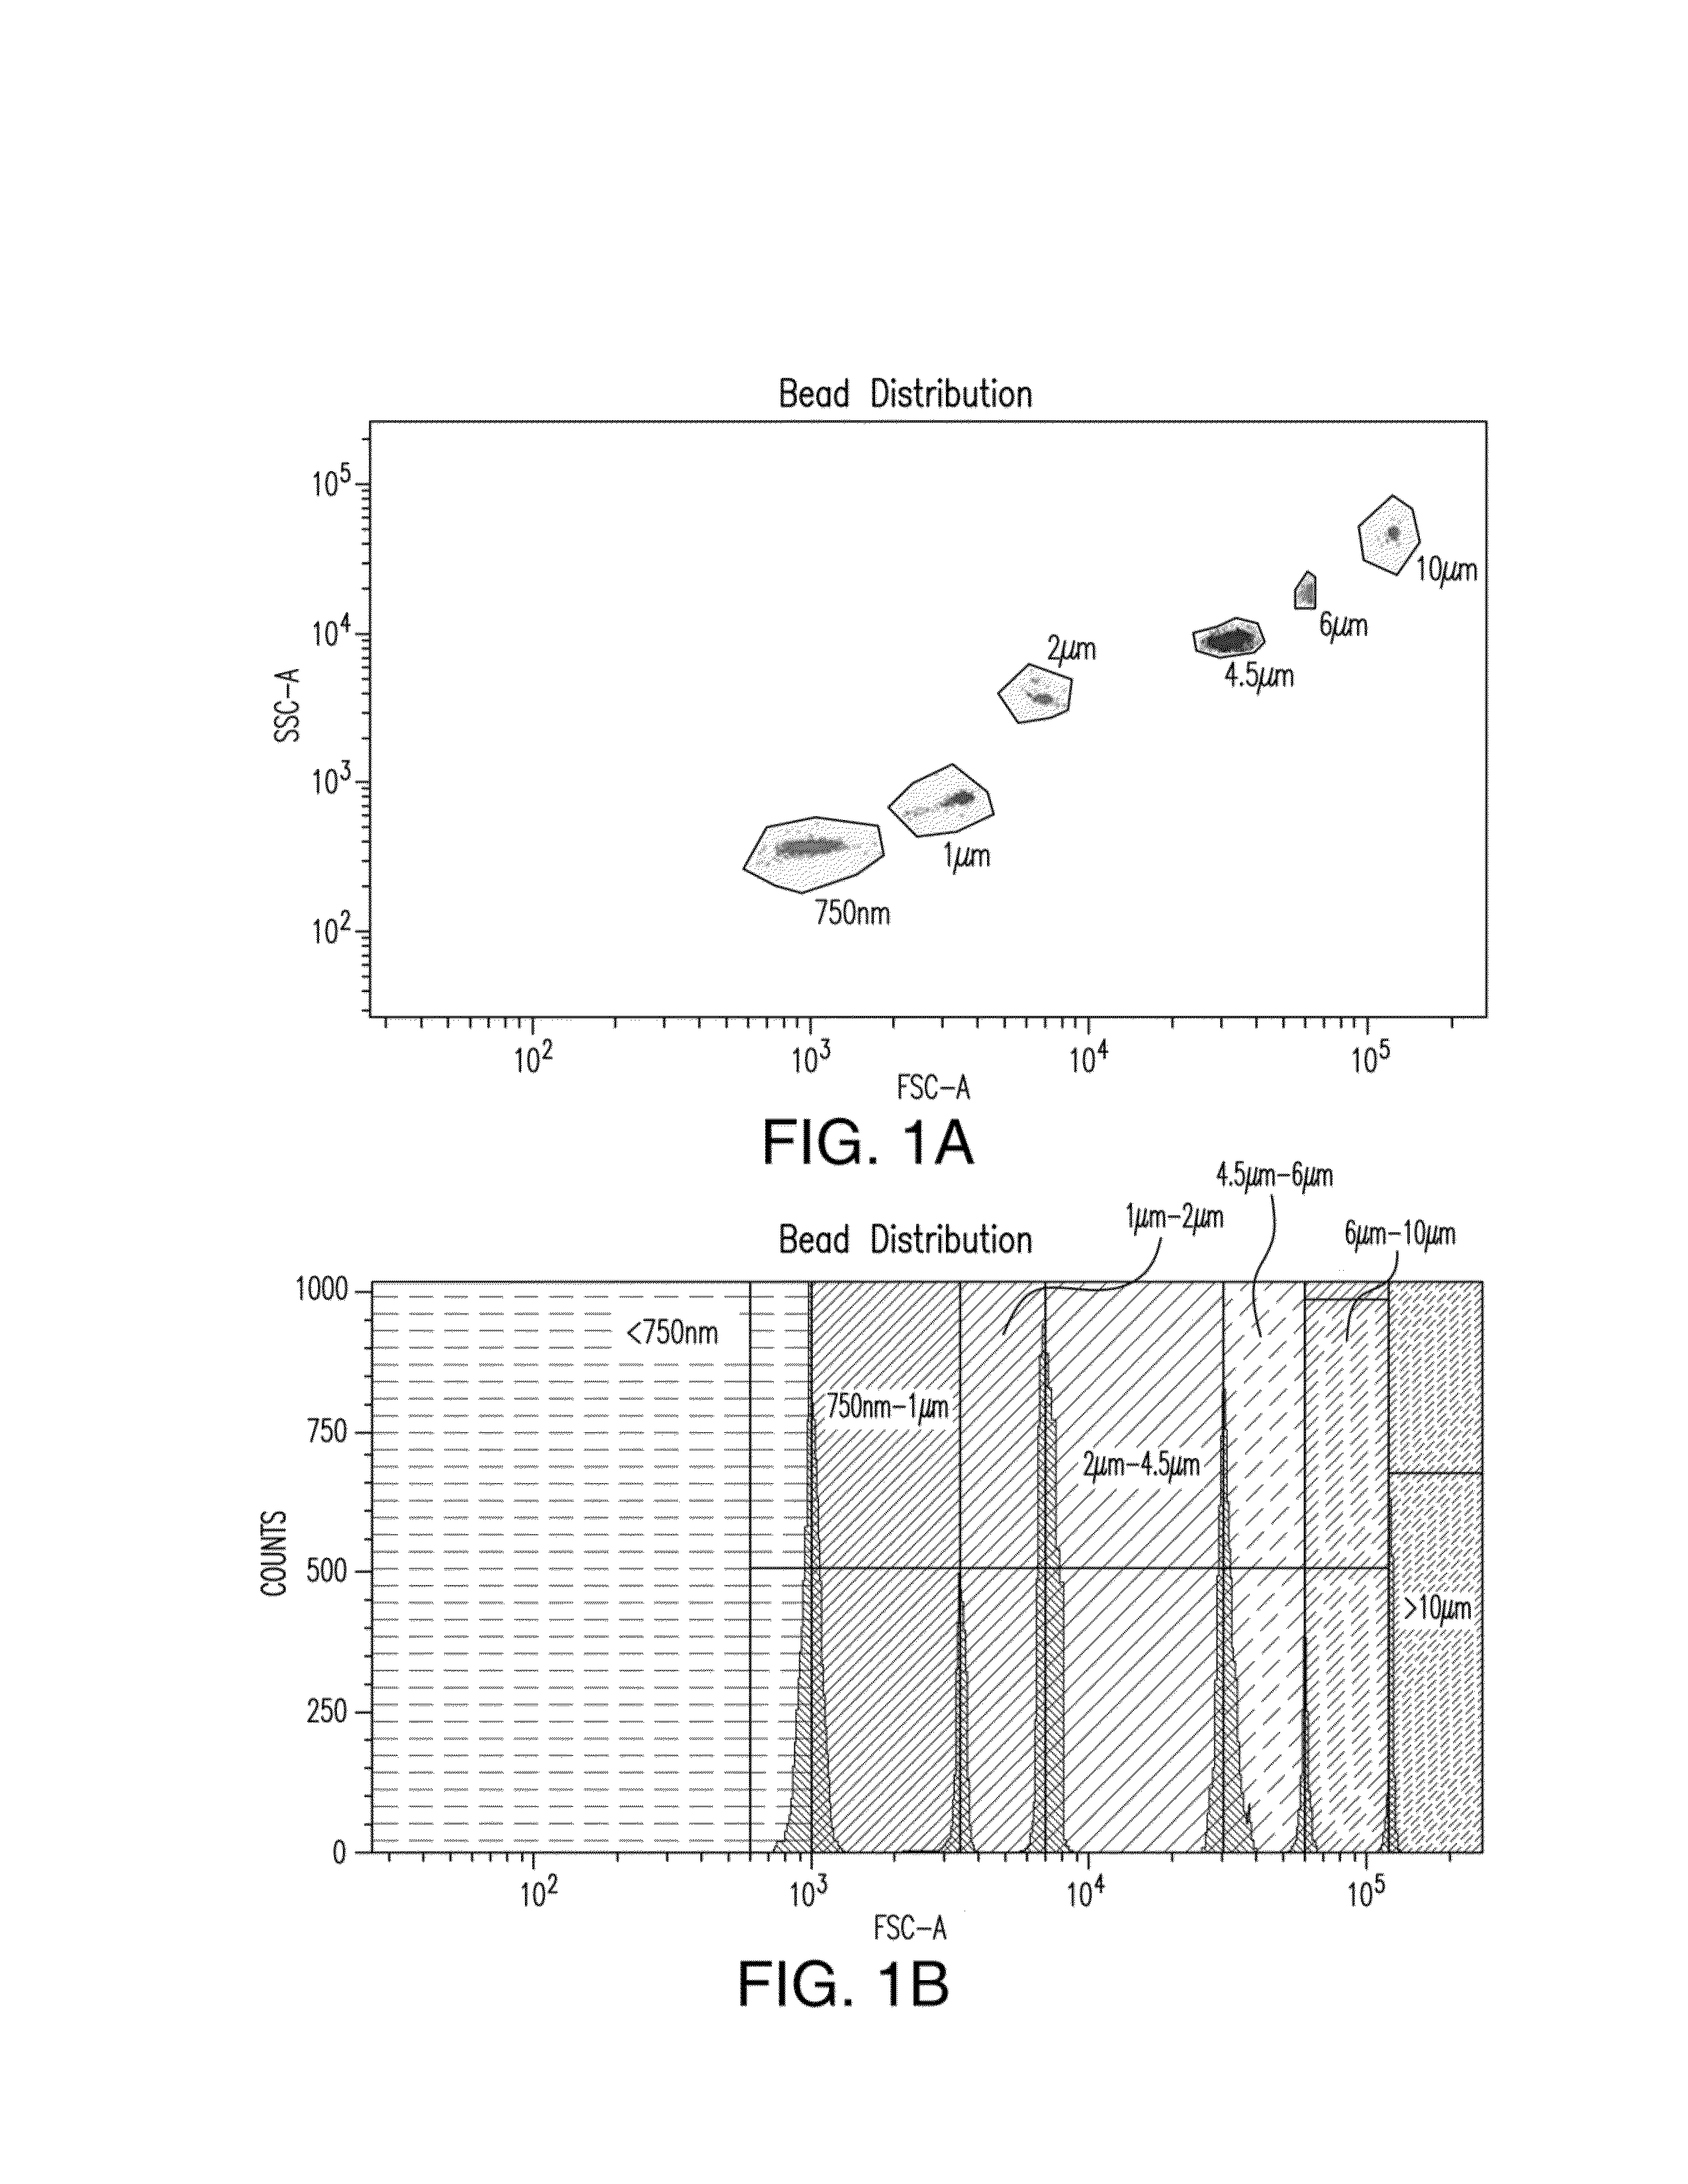
[0163]To be able to establish size distribution ranges a size standard stock solution was prepared from Fluoresbright Size Calibration Kit I and II (Polysciences, Inc., Warrington, Pa.). This stock solution included microspheres having mean diameters of 0.75 μm, 1.0 μm, 2.0 μm, 4.5 μm, 6.0 μm and 10 μm and was prepared according to the manufacturer's instructions.

[0164]The prepared test sample was analyzed using a BD LSRFORTESSA™ particle analyzer (Becton Dickinson, San Jose, Calif.) equipped with a 405-nm violet laser, a 488-nm blue laser, a 561-nm yellow / green laser and a 635-nm red laser; and having two 488-nm light scattering detectors (low-angle forward scattering [FSC] and 90° side scattering [SSC]) and 16 fluorescence detectors. The forward and the side scatter were illustrated logarithmically. A threshold was set on the forward and side scatter in a manner that would include particles on the forward scatter vs...

example 2

Establishing Limits of Size Detection and Size Distribution Ranges

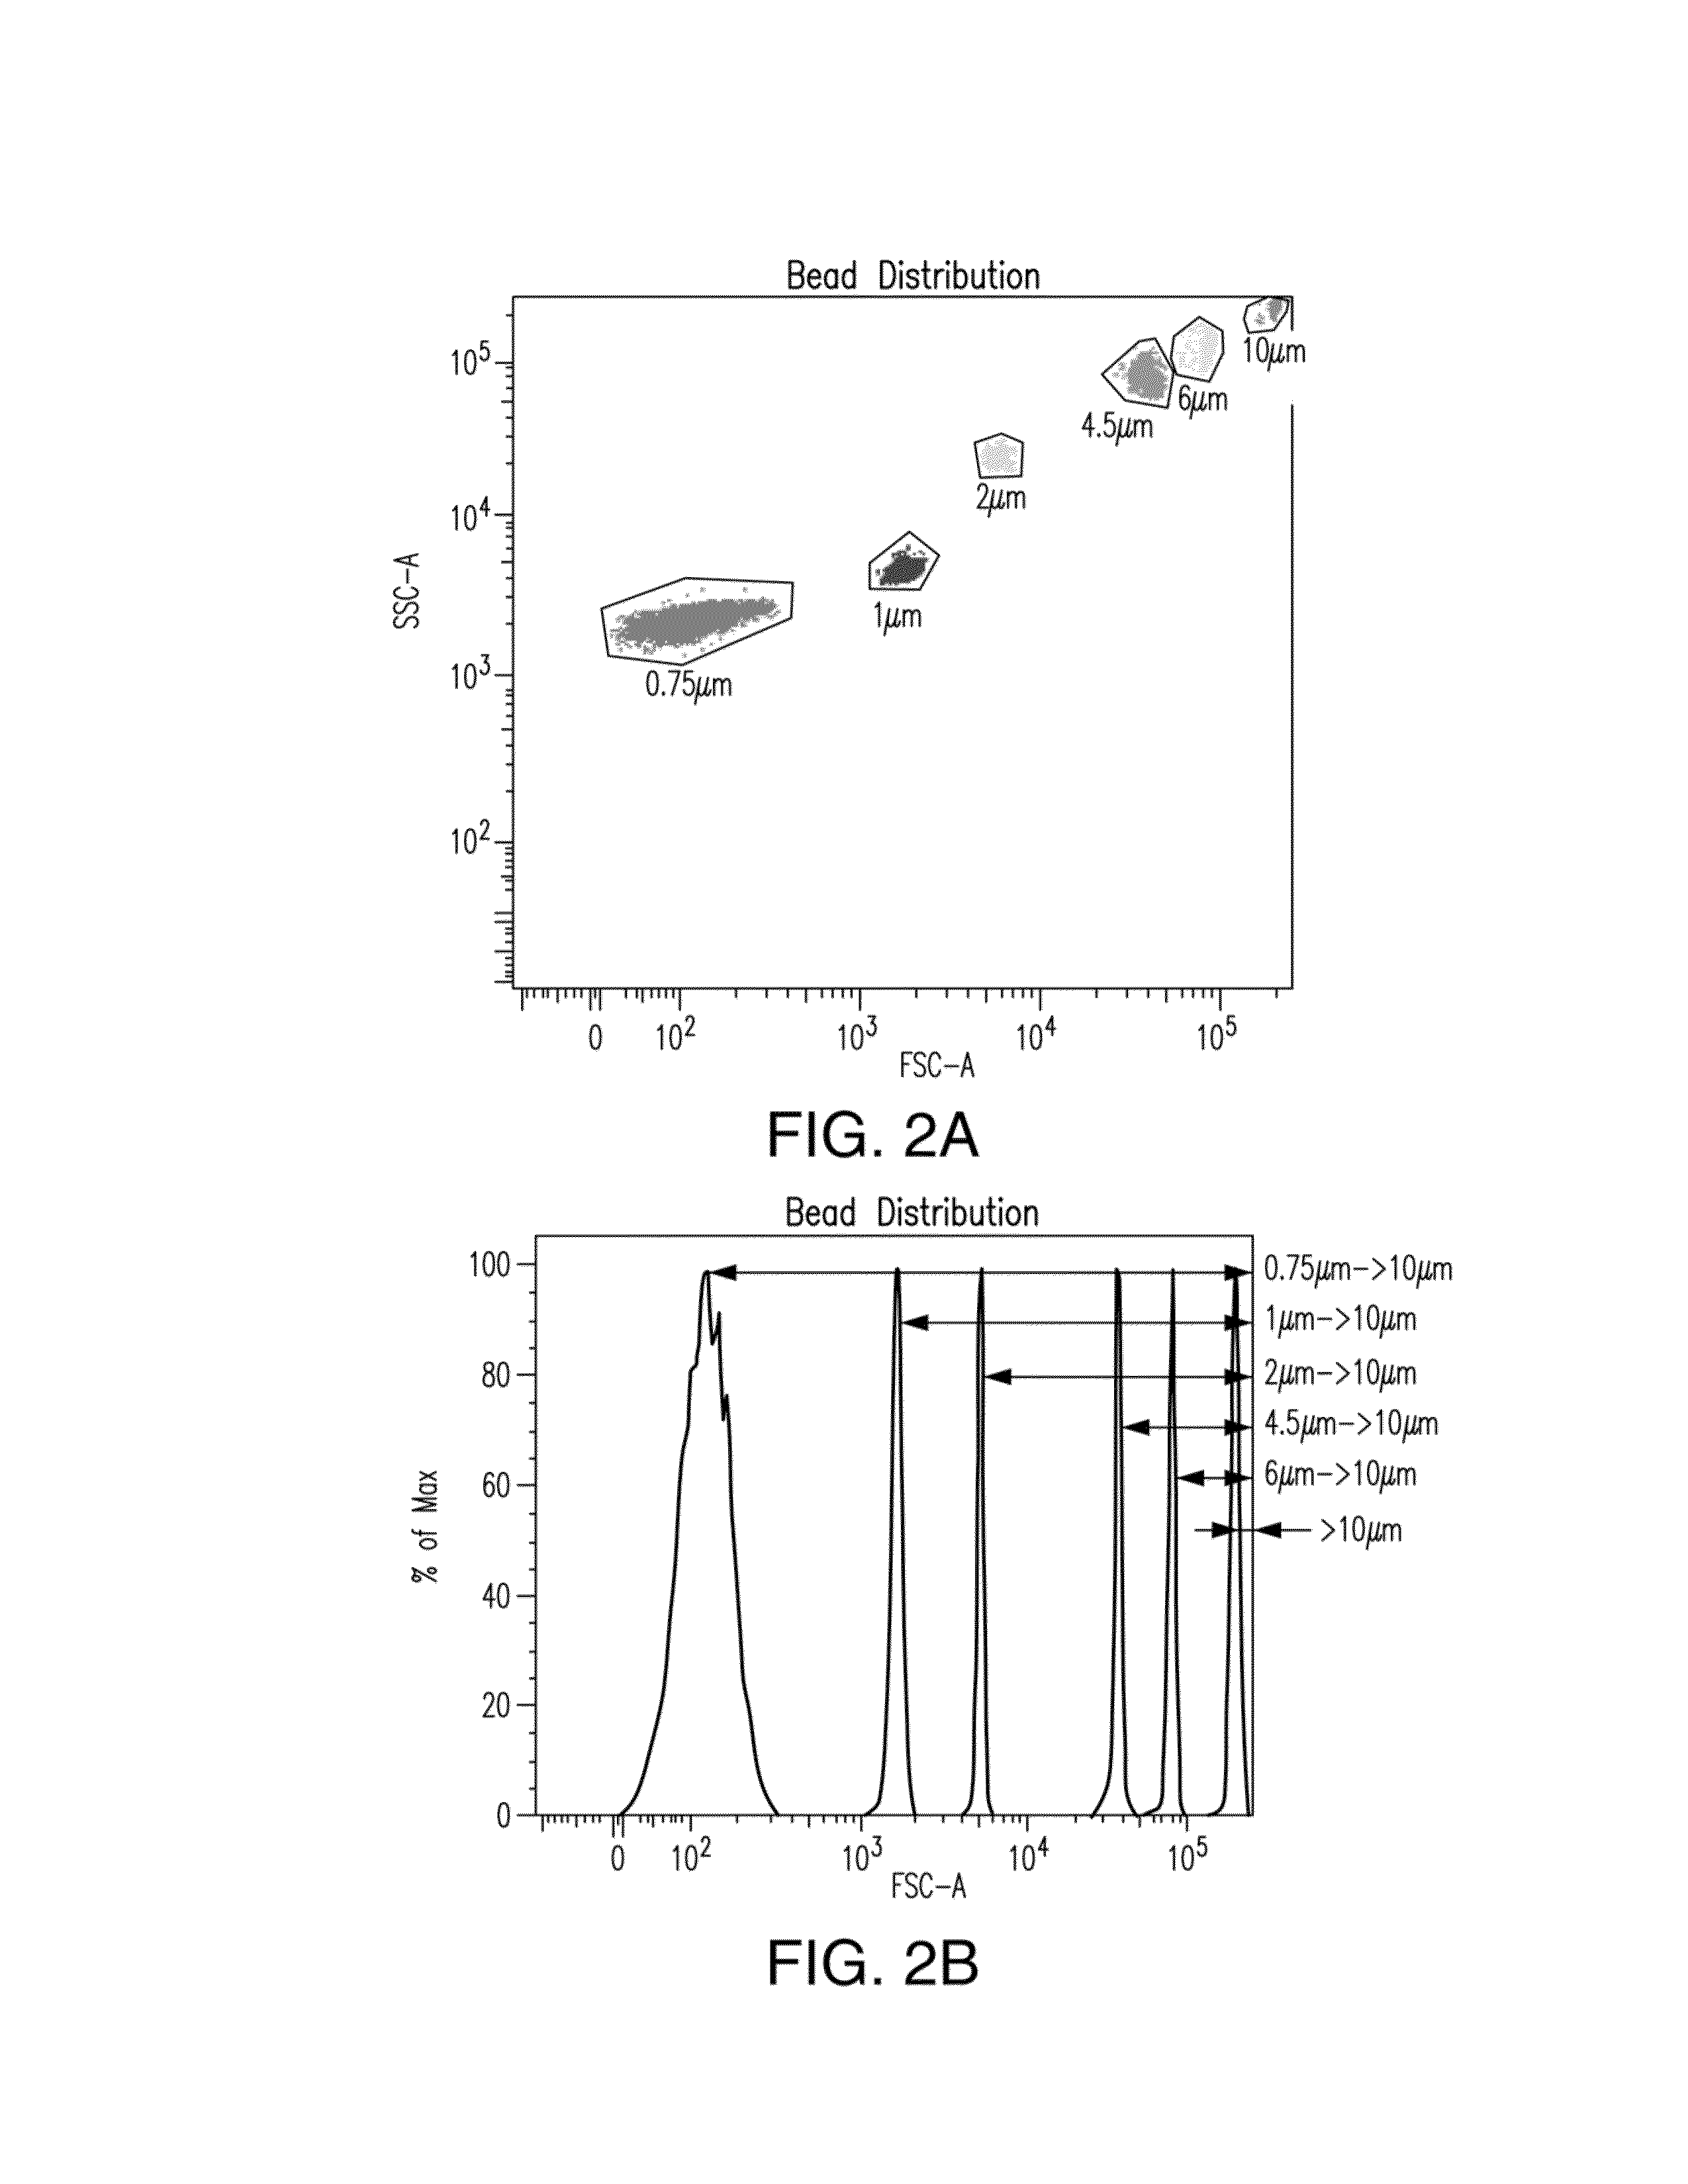
[0166]To be able to establish size distribution ranges a size standard stock solution was prepared from Fluoresbright Size Calibration Kit I and II (Polysciences, Inc., Warrington, Pa.). This stock solution included microspheres having mean diameters of 0.75 μm, 1.0 μm, 2.0 μm, 4.5 μm, 6.0 μm and 10 μm and was prepared according to the manufacturer's instructions.

[0167]The prepared test sample was analyzed using a BD FACSARIAIII™ particle analyzer (Becton Dickinson, San Jose, Calif.) equipped with a 405-nm violet laser, a 488-nm blue laser and a 633-nm red laser; and having two 488-nm light scattering detectors (low-angle forward scattering [FSC] and 90° side scattering [SSC]) and 11 fluorescence detectors. The forward and the side scatter were illustrated logarithmically. A threshold was set on the forward and side scatter in a manner that would include particles on the forward scatter vs. side scatter plot but still...

example 3

Detecting, Counting and Determination of Size Distribution of Particles

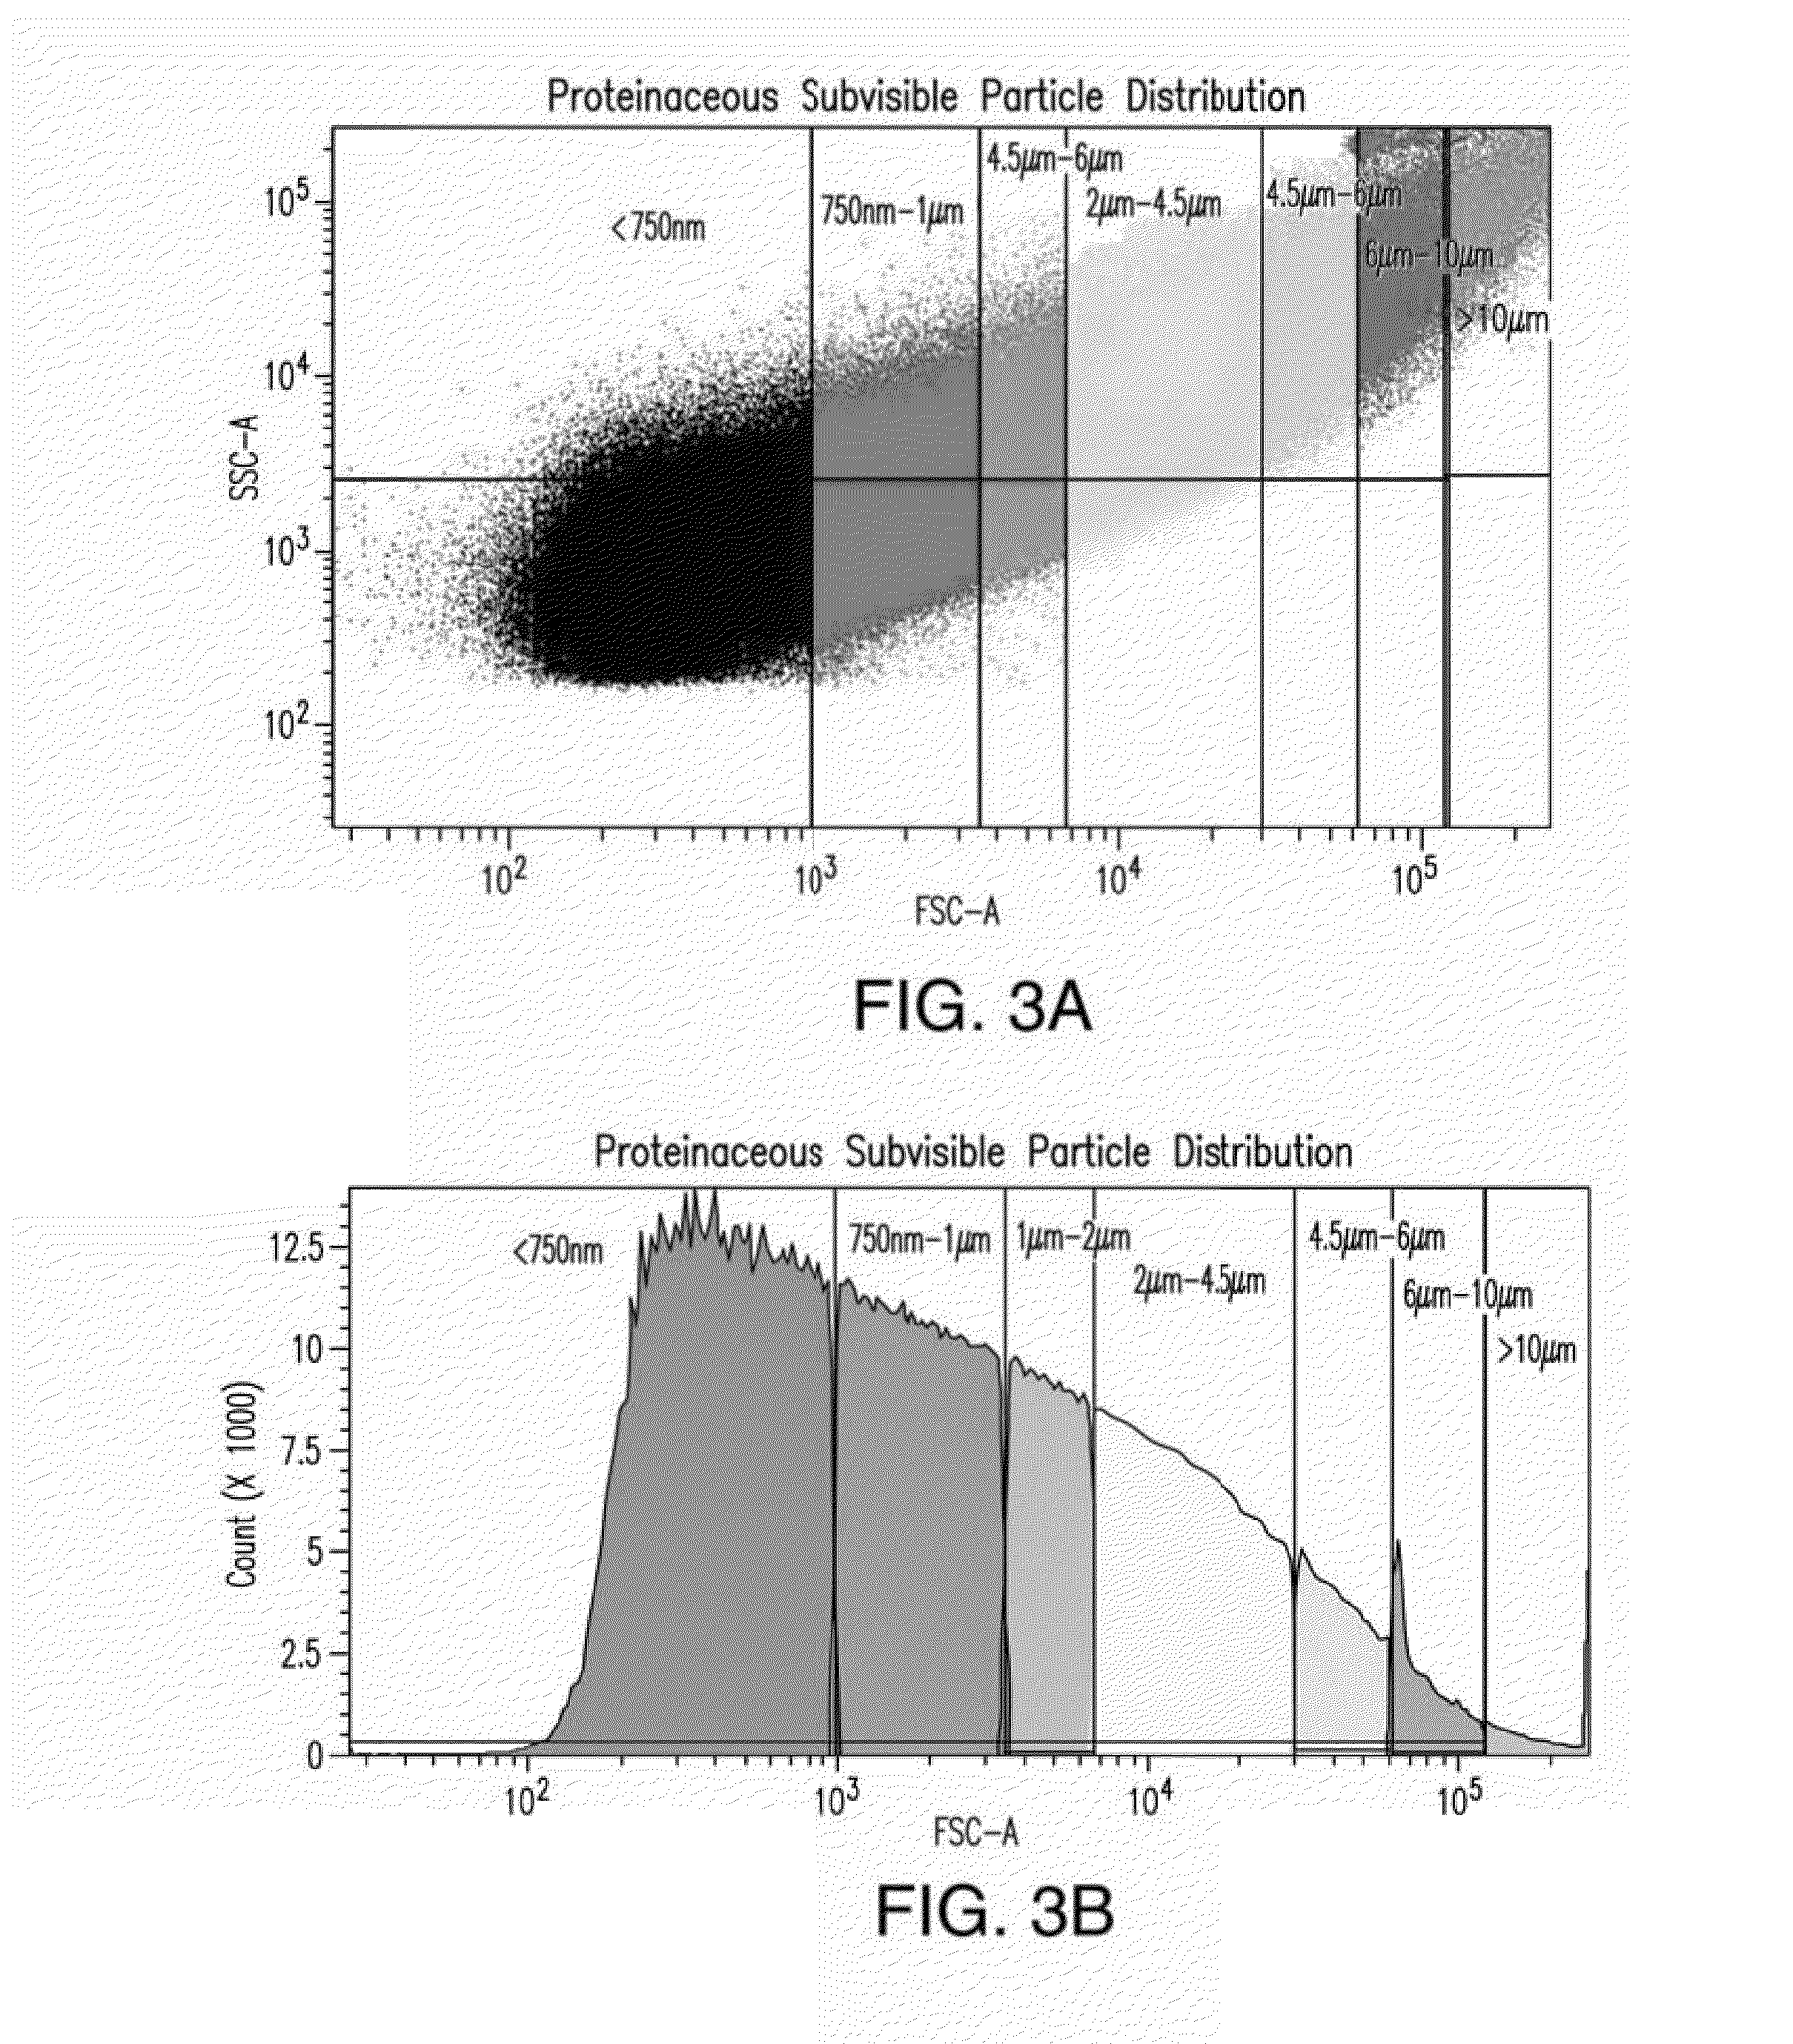
[0169]To prepare a test sample, 50 μL (about 49,500 microspheres) of COUNTBRIGHT™ Absolute Counting Beads (Invitrogen, Life Technologies Ltd., Paisley, Great Britain) were added to 450 μL of a particle sample including 50 μg / mL amyloid β peptide 1-42 aggregates.

[0170]The prepared test sample was analyzed using a BD LSRFORTESSA™ particle analyzer (Becton Dickinson, San Jose, Calif.) as described in Example 1. The stored settings, thresholds, and gates determined by the size standard in Example 1 were used as a template for size distribution ranges. All events were analyzed, recorded, and evaluated as described in Example 1. Each sample was evaluated three times and a mean value and standard deviations of the three results were calculated. A control sample comprising formulation buffers was analyzed in parallel to record the background signal for the corresponding test sample. Background signals were subtracted fro...


PUM

PropertyMeasurementUnit
fluorescence excitation wavelengthaaaaaaaaaa
fluorescence emission wavelengthaaaaaaaaaa

Abstract

The present specification discloses methods of characterizing a population of particles using a particle analyzer. Particles may be characterized by size, absolute number, whether the particle is non-proteinaceous or proteinaceous, whether a proteinaceous particle has or lacks a certain physical property, or any combination thereof.

Description

[0001]This application claims priority pursuant to 35 U.S.C. §119(e) to U.S. Provisional Application 61 / 747,720 filed on Dec. 31, 2012 and U.S. Provisional Application 61 / 585,425 filed on Jan. 11, 2012, the content of each of which is hereby incorporated by reference in its entirety.INTRODUCTION[0002]Therapeutic protein products provide unique and effective treatments for numerous human diseases and medical conditions. In many cases, these treatments are used chronically to slow disease progression, reduce morbidity and / or to replace essential proteins that are not produced endogenously in an individual. Factors that reduce or eliminate the effectiveness of a protein-based treatment can lead to patient suffering and even death. One means by which efficacy of therapeutic proteins can be compromised is by an immune response, resulting in antibody-mediated neutralization of the protein's activity or alterations in bioavailability. For example, in the case of treatment of hemophilia A, ...

Claims


Application Information

Patent Timeline
Patent Type & Authority Applications(United States)
IPC IPC(8): G01N33/68G01N33/86C12Q1/56
CPCG01N33/48735G01N33/6803G01N33/6839G01N2015/1493G01N33/86G01N15/1429G01N15/1012C12Q1/56
Inventor MALISAUSKAS, MANTASLUBICH, CHRISTIANPRENNINGER, THOMASREIPERT, BIRGIT
Owner TAKEDA PHARMA CO LTD
Why Eureka
Try Eureka