
Multiplex measure of isotype antigen response

Inactive Publication Date: 2014-01-30
SQI DIAGNOSTICS SYST
View PDF11 Cites 1 Cited by
  • Summary
  • Abstract
  • Description
  • Claims
  • Application Information

AI Technical Summary

Benefits of technology

This patent explains a way to quickly and inexpensively detect and measure multiple substances in a sample using one reaction vessel. This method helps to avoid the need for individual tests for each substance.

Problems solved by technology

This often requires a multitude of tests and samples, increases delay in time to treatment, costs and possibility of analytical error.
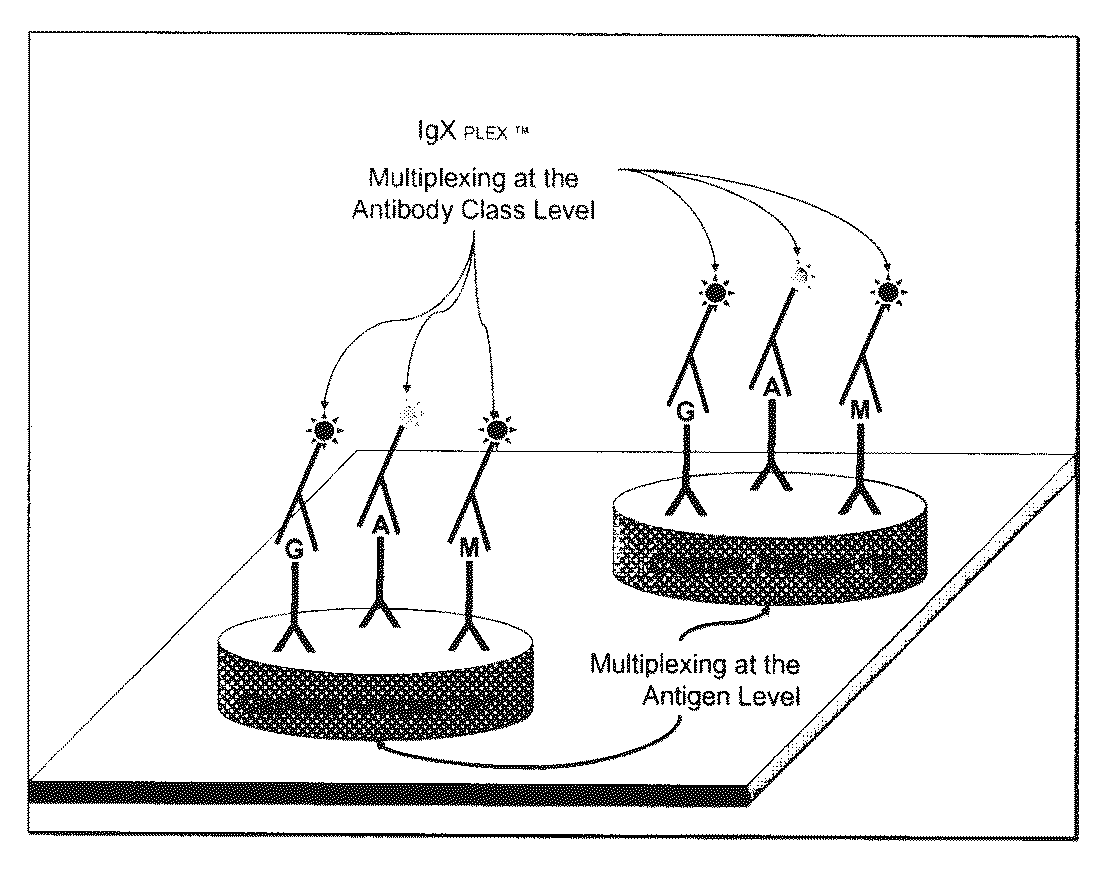
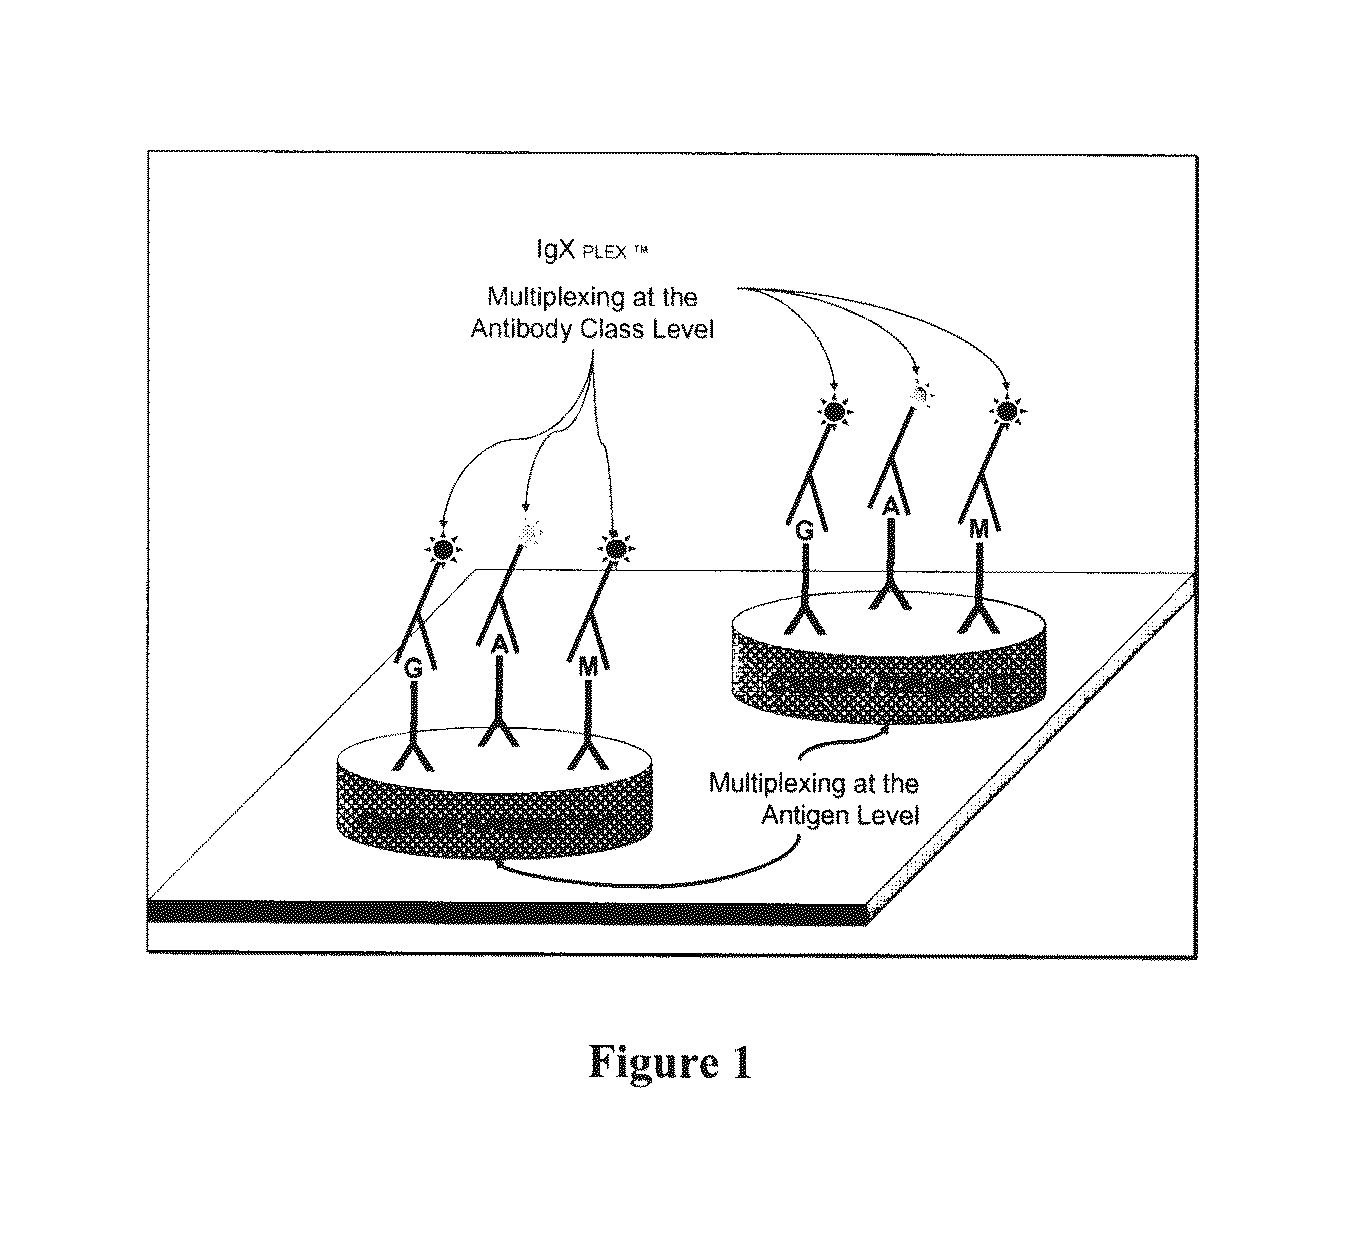
Current immunoassay methods do not detect antibodies that are of multiple isotypes and subclasses in the same test well / cycle.
This is a major limitation for detecting diseases with more than one marker or transgenic organisms which express more than one transgenic product.
The result is a need for two separate washing steps which defeats the purpose of the direct assay.
These bead based systems' capability is limited to each microparticle, i.e., bead being suspended in a volume of test fluid that contains the analyte to be detected as a separate entity which needs to bind freely and specifically onto the surface of the test bead.
This method is not suitable for quantitative results.
While methods for sequentially detecting and quantifying multiple analytes limited to capturing isotype and subclass for a single analyte are known, these methods require the use of separate assaying steps for each of the analytes of interest and as such, can be time consuming and costly, especially in the context of a clinical setting.

Method used


Image

  • Multiplex measure of isotype antigen response
  • Multiplex measure of isotype antigen response
  • Multiplex measure of isotype antigen response

Examples


example 1

Multiplex Immunogenicity Testing

[0104]Wherein a therapeutic protein and / or its analytical components are immobilized on a planar microarray surface, analytical components may include subunits of the therapeutic protein e.g. antibody fragments or fusion partners, metabolic products of the therapeutic protein, peptide components, formulation components, biosimilars, or potential cross reacting entities.

[0105]Samples collected from untreated and therapeutic protein treated patients are incubated with the immobilized microarray components. Samples are most likely to be serum or plasma. These samples may be pre-treated or prepared in such a way as to enrich for the availability of any antibodies which the patient may have developed in response to the therapeutic protein or prior exposure to similar entities. Following sample incubation, the microarray surface is interrogated for the presence of patient derived antibodies which have been captured and bound by the immobilized analytes.

[010...

example 2

Neutralizing Antibodies

[0111]The method also interrogates neutralizing effects of a patient's antibodies, i.e.; their ability to directly affect the active mechanism of the therapeutic protein

[0112]In cases where the therapeutic protein is a ligand that binds to a receptor, the receptor will be immobilized on the array surface. A fluorescently labeled derivative of the therapeutic protein will be incubated with patient serum in a competitive type immunoassay. A high fluorescent signal in this case indicates an absence of neutralizing antibodies. As the titer of neutralizing antibodies increases in a sample, they will interfere with the ability of the labeled therapeutic protein to bind the receptor and thus decrease the florescent signal on the array surface.

[0113]As depicted in FIG. 10, in cases where the mechanism of the therapeutic protein is to block a ligand / receptor interaction, the receptor is immobilized on the microarray surface. A fluorescently labeled derivative of the ap...

example 3

Insulin Immunogenicity

[0114]As new insulin variants are developed the need to study the range of immune responses in patients requires the ability to detect, characterize and quantitate anti-insulin antibodies. Regardless of purity and origin, therapeutic insulins continue to be immunogenic in humans. Severe immunological complications rarely occur. Current human insulin and insulin analog therapies result in decreased anti-insulin antibodies levels. Anti-insulin antibody development is also affected by the mode of delivery: For example, use of subcutaneous and implantable insulin pumps or inhaled insulin. Formulation also effects immunogenic potential with regular or semilente insulins being less immunogenic than intermediate or long acting preparations. Aggregation levels also affect immunogenicity.

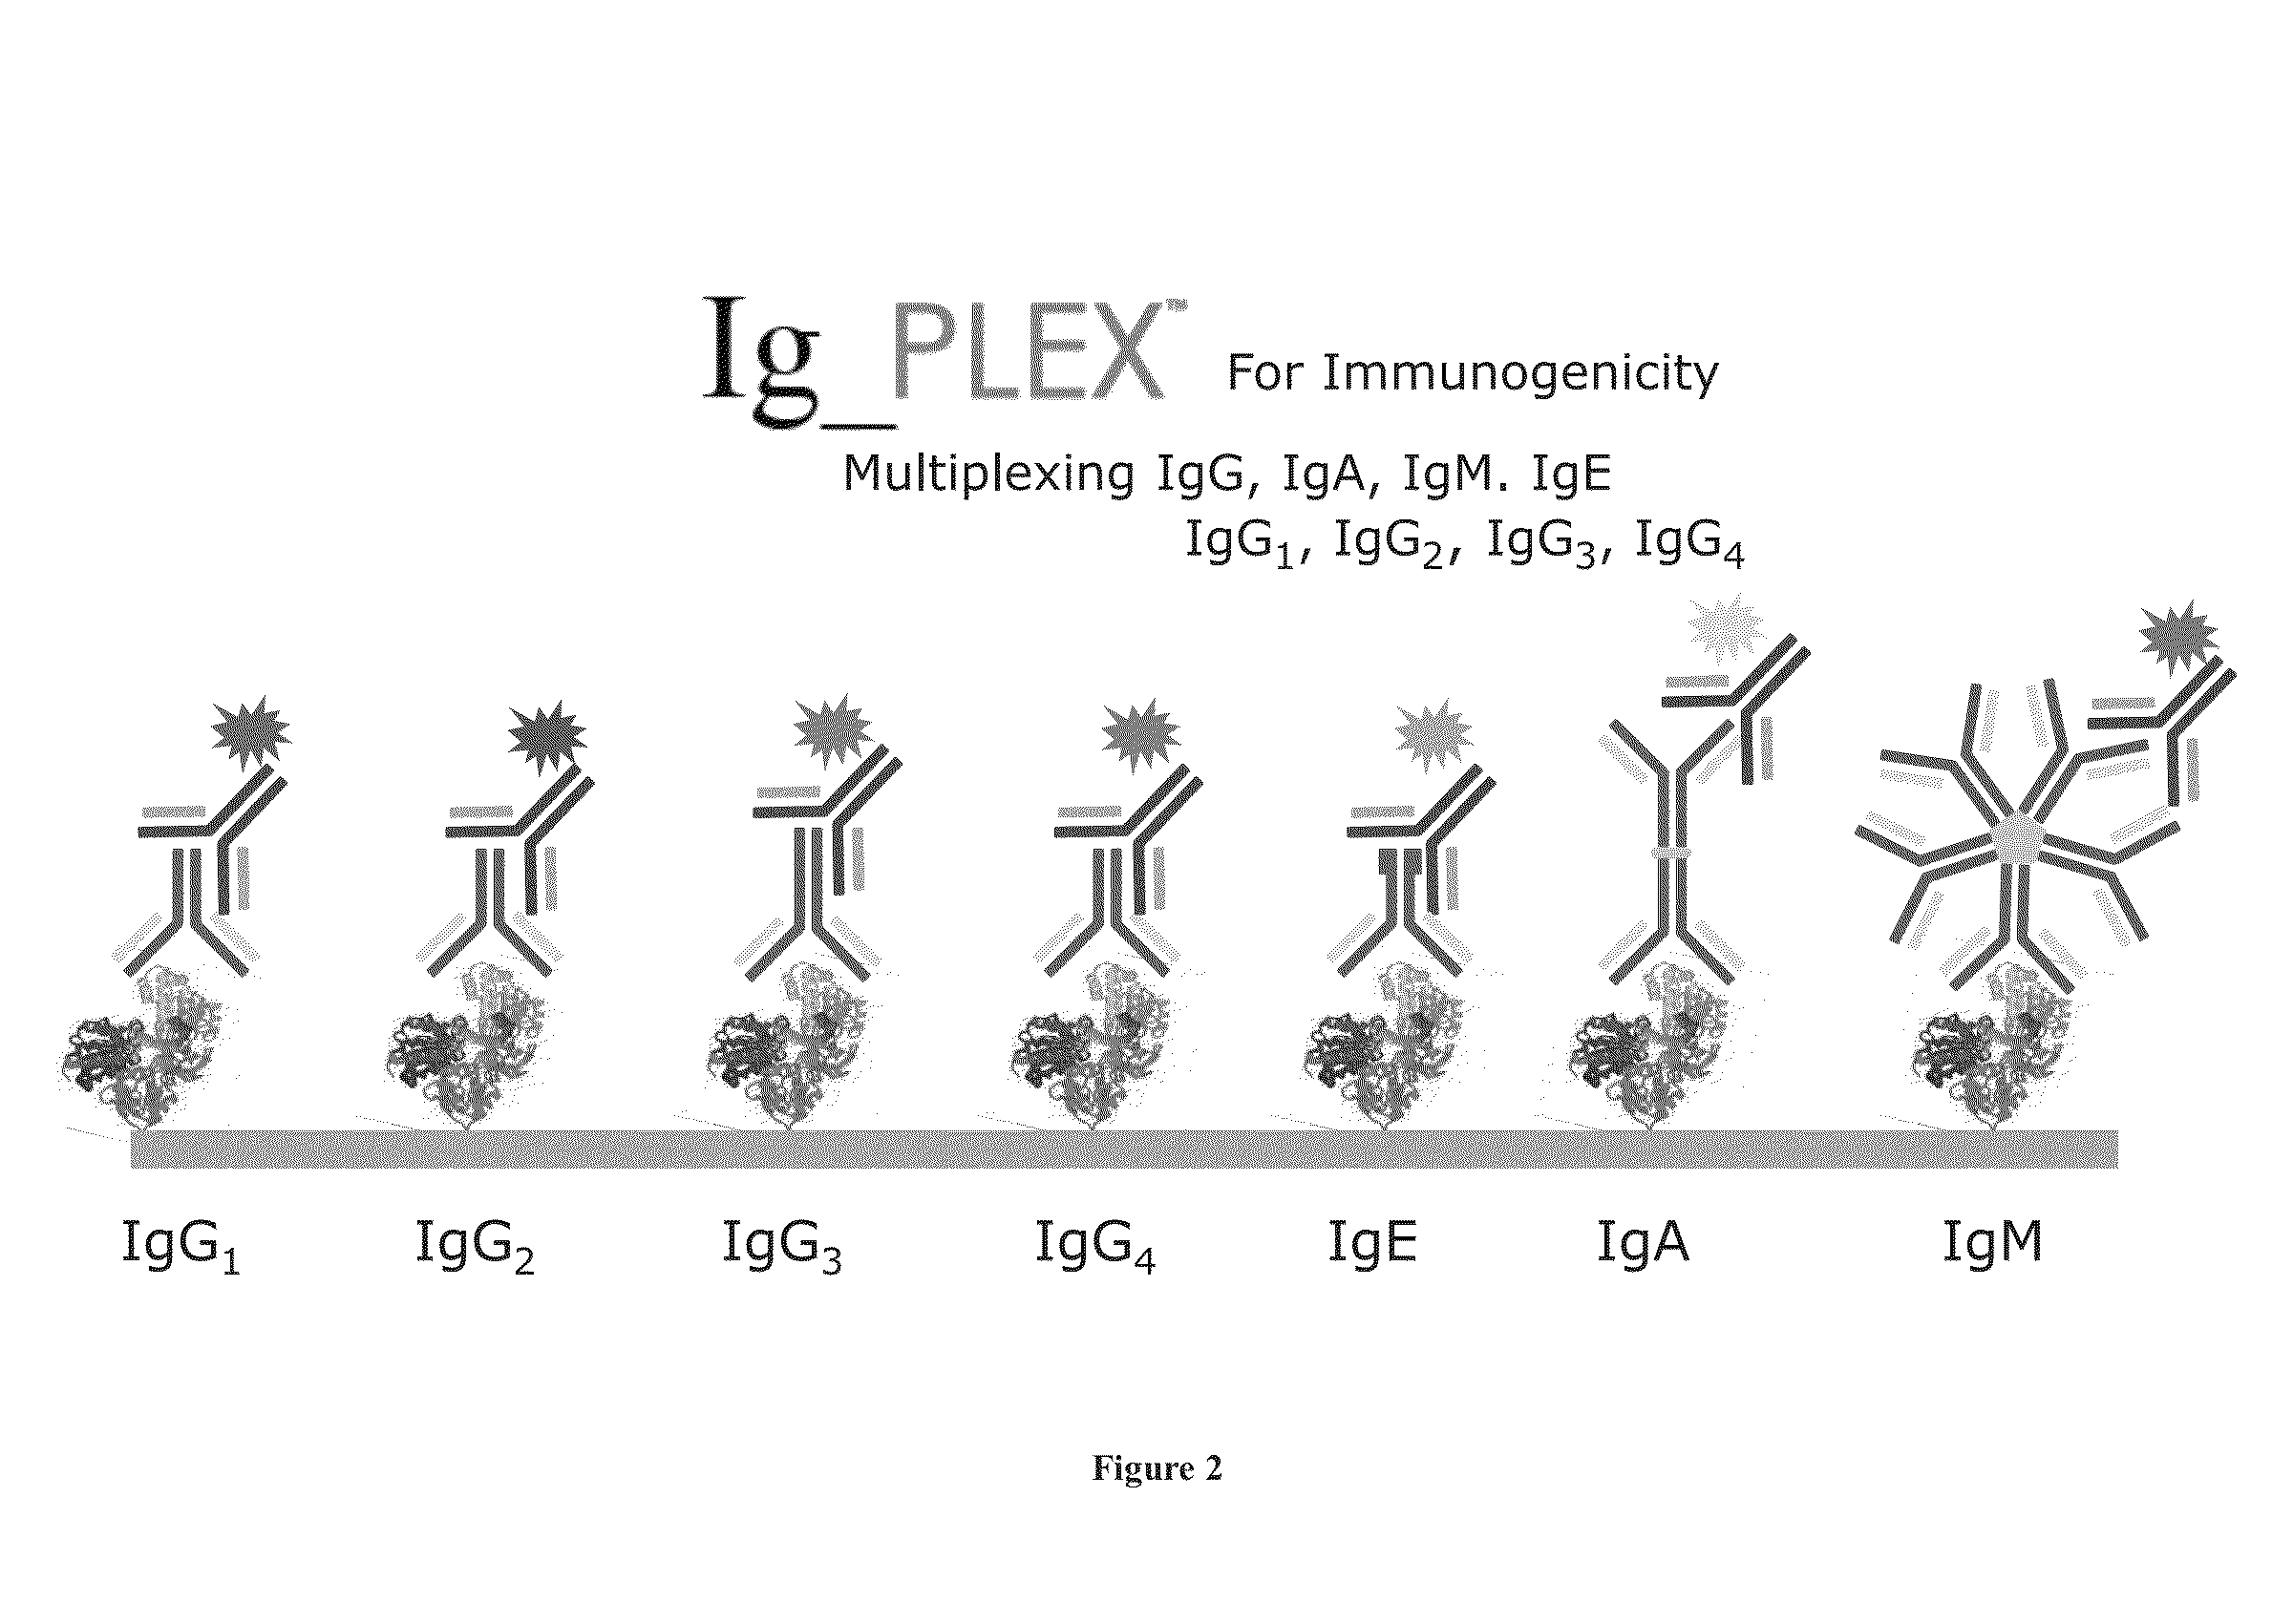
[0115]Anti-insulin antibodies responses consisting of Ig classes and IgG subclasses have been reported. Primarily IgG1-4 but IgA, IgM and IgE have also been reported. IgG is implicated ...


PUM


Abstract

Described are methods for simultaneous detection and quantifying multiple target analytes, including immunoglobulin isotypes and sub-classes, single and multiple protein antibodies within a test sample contained in a single reaction vessel. Such methods use reaction wells as on a multi-well plate, each single well comprising microarrays of calibration spots, each having a predetermined quantity of a target analyte; and capture spots, each having multiple agent antibodies, including isotypes and subclasses that specifically bind the target analytes. The captured analytes and the calibration spots are detected with fluorescently labeled antibodies specific for each different target analyte. Calibration spots generate calibration curves for quantitative determinations of different target analytes. Also described are methods for detecting and quantifying biomarkers, therapeutic proteins and patient derived antibodies; the use of secondary reagents to determine immunoglobulin classes Ig G, A, M, E and sub-classes including IgG1, IgG2, IgG3, IgG4 and IgA. The intensity of each fluorescent signal allows measurement of a specific immune response to a therapeutic protein and associated analytes; interrogates neutralizing effects of patient antibodies on therapeutic proteins, e.g., insulin therapy.

Description

CROSS-REFERENCE TO RELATED APPLICATIONS[0001]This application is a continuation in part of co-pending U.S. Ser. No. 11 / 632,746, filed on Mar. 26, 2008, which is a national phase entry under 35 U.S.C. §371 of International Patent Application PCT / CA2005 / 001147, filed Jul. 20, 2005, published in English as International Patent Publication WO 2006 / 007726 on Jan. 26, 2006, which claims the benefit under 35 U.S.C. §119 and under Article 8 of the PCT to Canadian Patent Application No. 2,475,240, filed Jul. 20, 2004, the entire contents of each of which are incorporated herein by reference.TECHNICAL FIELD[0002]The disclosure relates generally to biotechnology and more particularly to methods for the quantification of analytes and improved microarray methods for the detection and quantification of multiple analytes in a single sample. It also relates to the simultaneous quantification of isotype immunoglobulin classes Ig G, A, M, E, D and sub-classes including IgG1, IgG2, IgG3, IgG4, IgA1 an...

Claims


Application Information

Patent Timeline
IPC IPC(8): G01N33/564G01N33/543
CPCG01N33/6854G01N2800/102G01N33/543G01N33/564G01N33/54306G01N33/686
Inventor LEA, PETER
Owner SQI DIAGNOSTICS SYST
Learn More