
Method of visualizing a bridge therapy process

a bridge therapy and process technology, applied in the field of clinical decision support systems, can solve the problems of not having a test available that encapsulates the combined effect of both therapies, the risk of life-threatening bleeding events of medical anti-coagulation therapy, and the initial heparin treatment of all patients, so as to avoid the development of over-anticoagulation or under-anticoagulation of the haemostatic situation, the effect of improving the bridging process

Active Publication Date: 2014-05-01
KONINKLJIJKE PHILIPS NV
View PDF4 Cites 3 Cited by
  • Summary
  • Abstract
  • Description
  • Claims
  • Application Information

AI Technical Summary

Benefits of technology

The patent describes a method for safely managing blood coagulation during a transition period when using different types of anticoagulant drugs. The method involves measuring the levels of heparin-like drugs and vitamin K antagonists in the blood and displaying them simultaneously to a user. This enables the user to make informed decisions on how to balance the coagulation process and avoid over-anticoagulation or under-anticoagulation. The method improves the accuracy and precision of the bridging therapy process and contributes to the safety of the overall process.

Problems solved by technology

Medicinal anti-coagulation therapy has the risk of causing life-threatening bleeding events.
However, not all of these patients may have had an initial heparin treatment.
There is not a test available that encapsulates the combined effect of both therapies.
However, since the PT / INR is relatively insensitive to the effects of the heparin like drugs, targeting a constant value for this test will easily lead to overcompensation of the coagulation and an unacceptable high risk of bleeding.
Similarly for the second option, using the aPTT to monitor the anti-coagulation, the aPTT is somewhat sensitive to the anti-coagulant effect of the VKAs but is certainly not optimized to monitor VKA therapy, thus targeting a constant value for this test will also easily lead to over-anti-coagulation and an unacceptable high risk of bleeding.
In practice, physicians are known to opt for the third possibility: refrain from monitoring at all, but follow the (recommended) bridging guidelines, which are known to often lead to over-anti-coagulation.

Method used


Image

  • Method of visualizing a bridge therapy process
  • Method of visualizing a bridge therapy process
  • Method of visualizing a bridge therapy process

Examples


Embodiment Construction

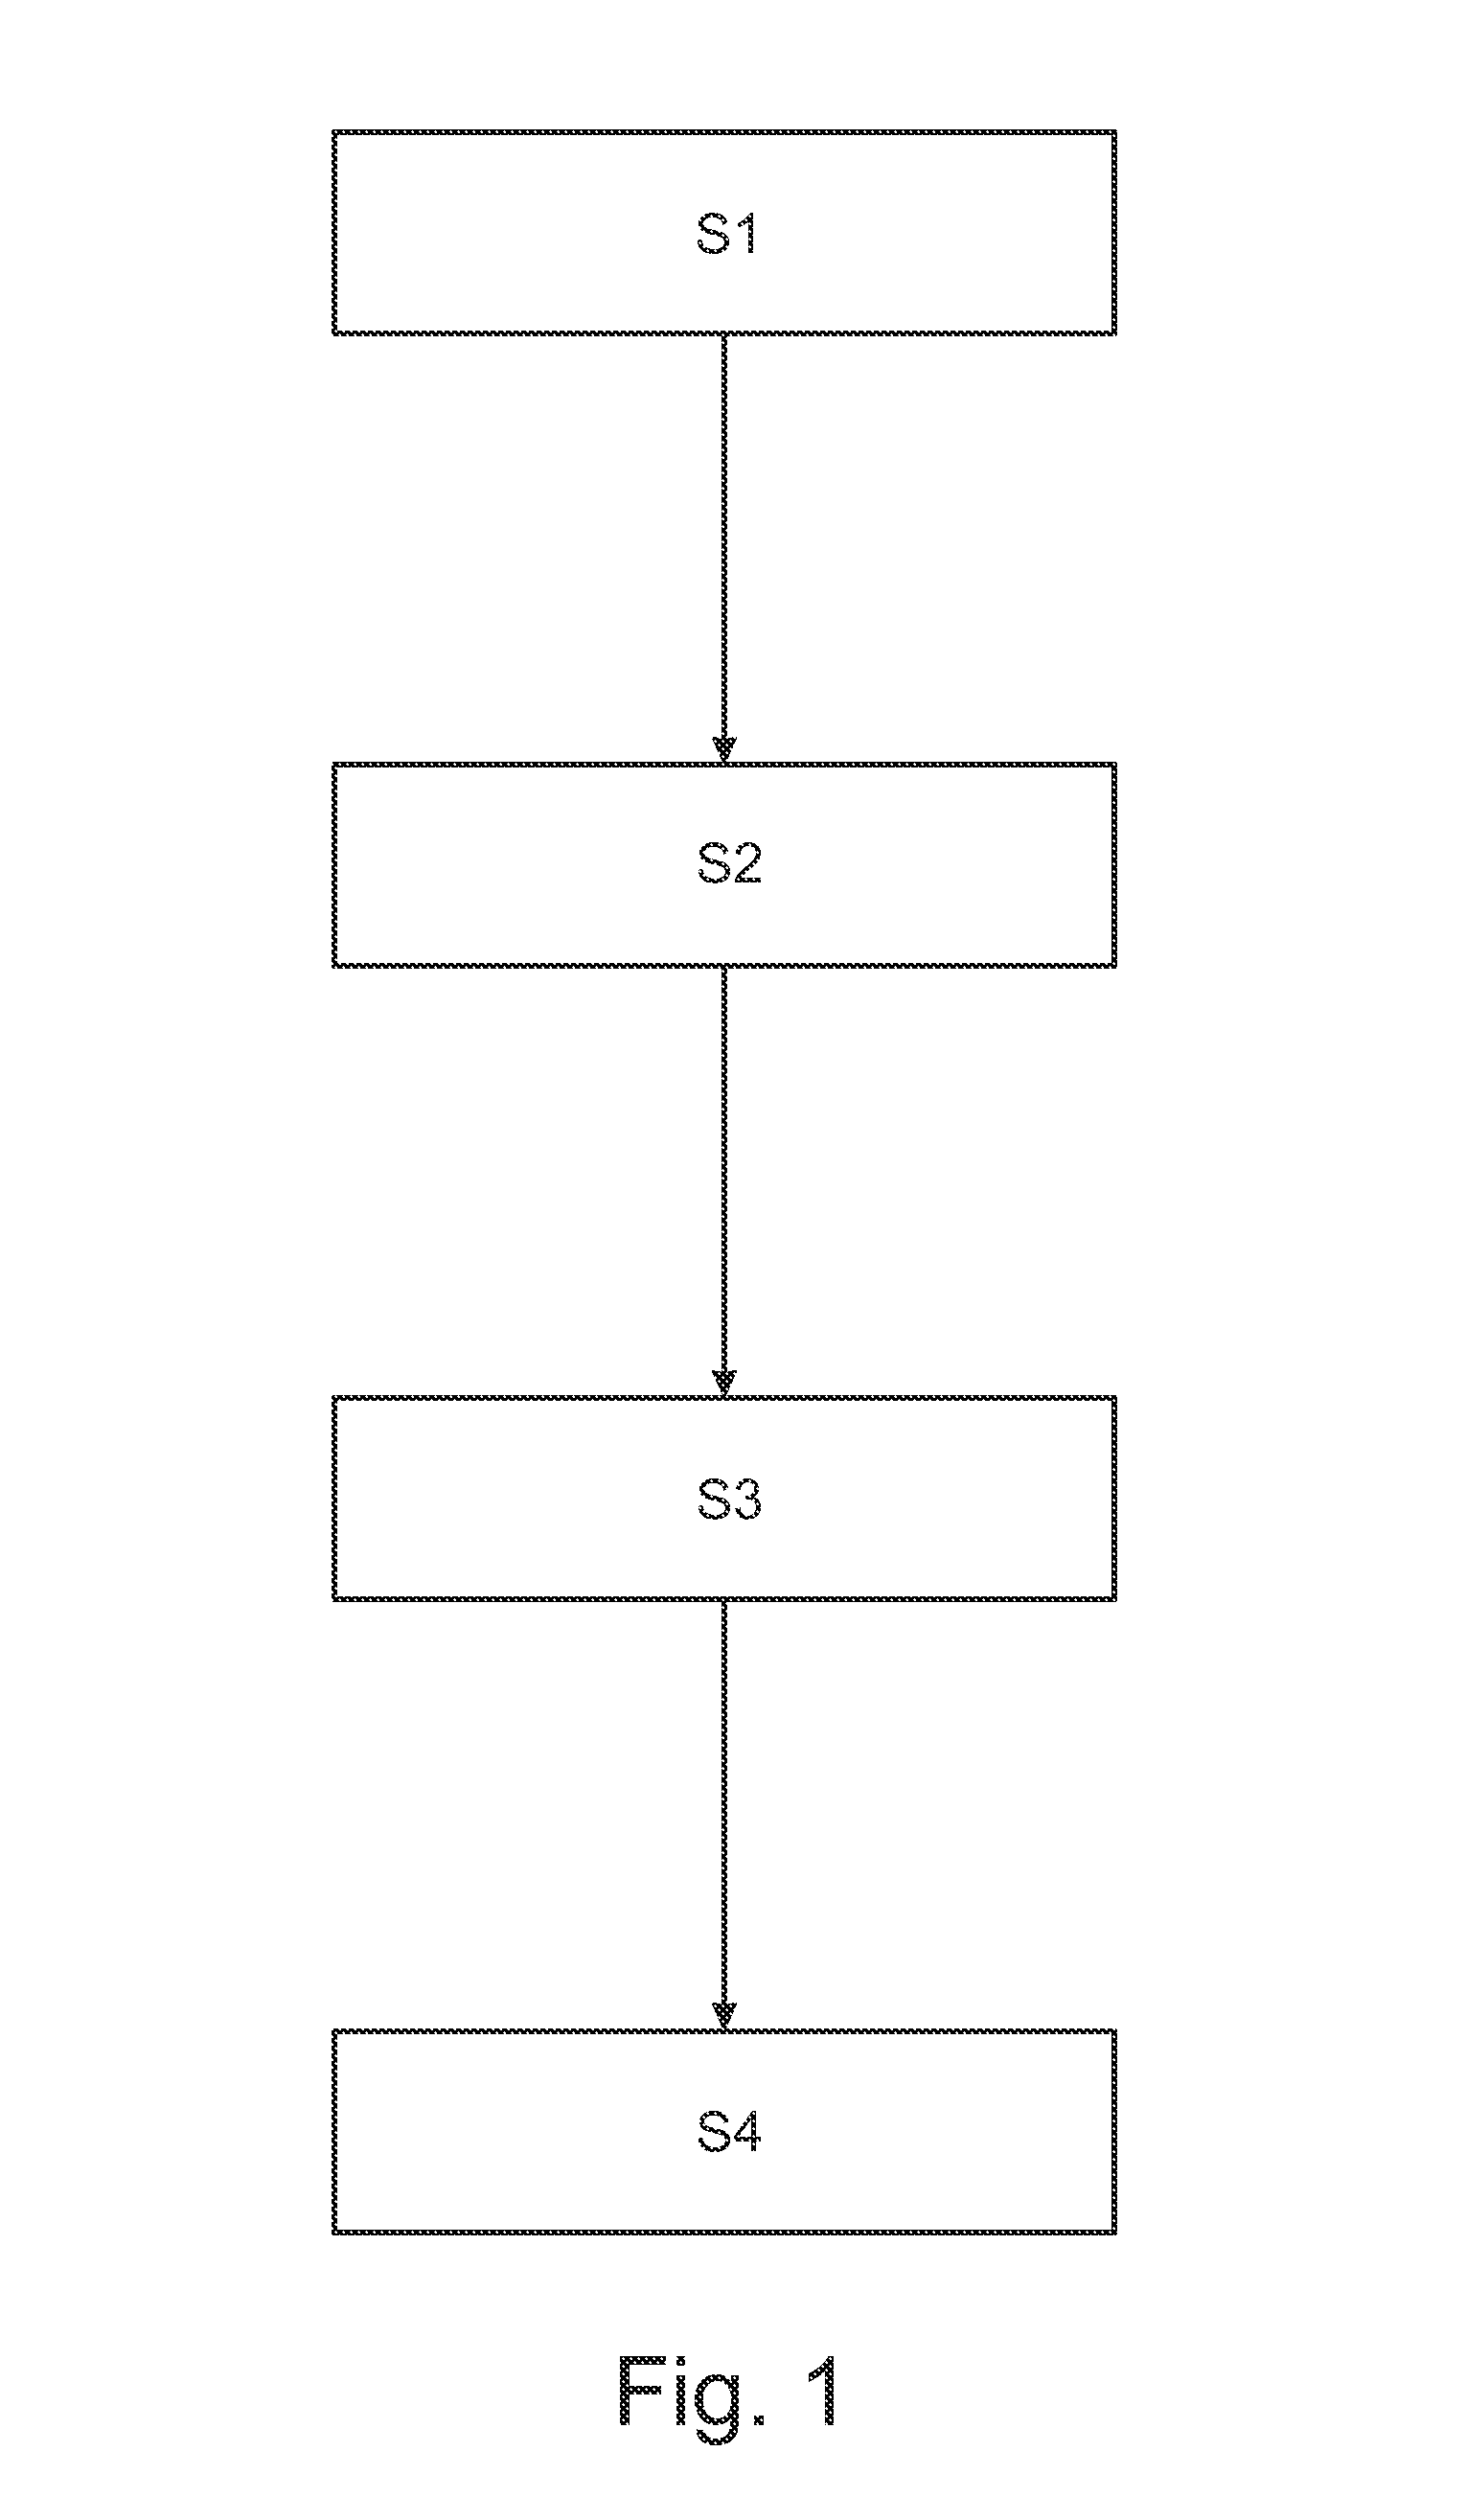
[0072]FIG. 1 shows a flow diagram of a method of visualizing a bridge therapy process wherein the presented method comprises steps (S1) to (S4). In step (S1) coagulation data describing haemostatic situation of a blood circulation of a patient is received. Such data may for example be received by a user interface or by a calculation arrangement or a computer system. Furthermore, the coagulation data comprise measured or simulated values of tests that indicate the haemostatic situation of a blood circulation. Therein values of an aPTT test, a PT test, an INR test, a test indicating thrombosis or coagulation, a test indicating bleeding or anticoagulation, a test indicating the haemostatic function and any test combination thereof, may be comprised by said term “coagulation data”.

[0073]Furthermore, the method depicted in FIG. 1 comprises the step (S2) which represents a displaying of the coagulation data to a user by means of a graphical representation. Furthermore, the step of display...


PUM


Abstract

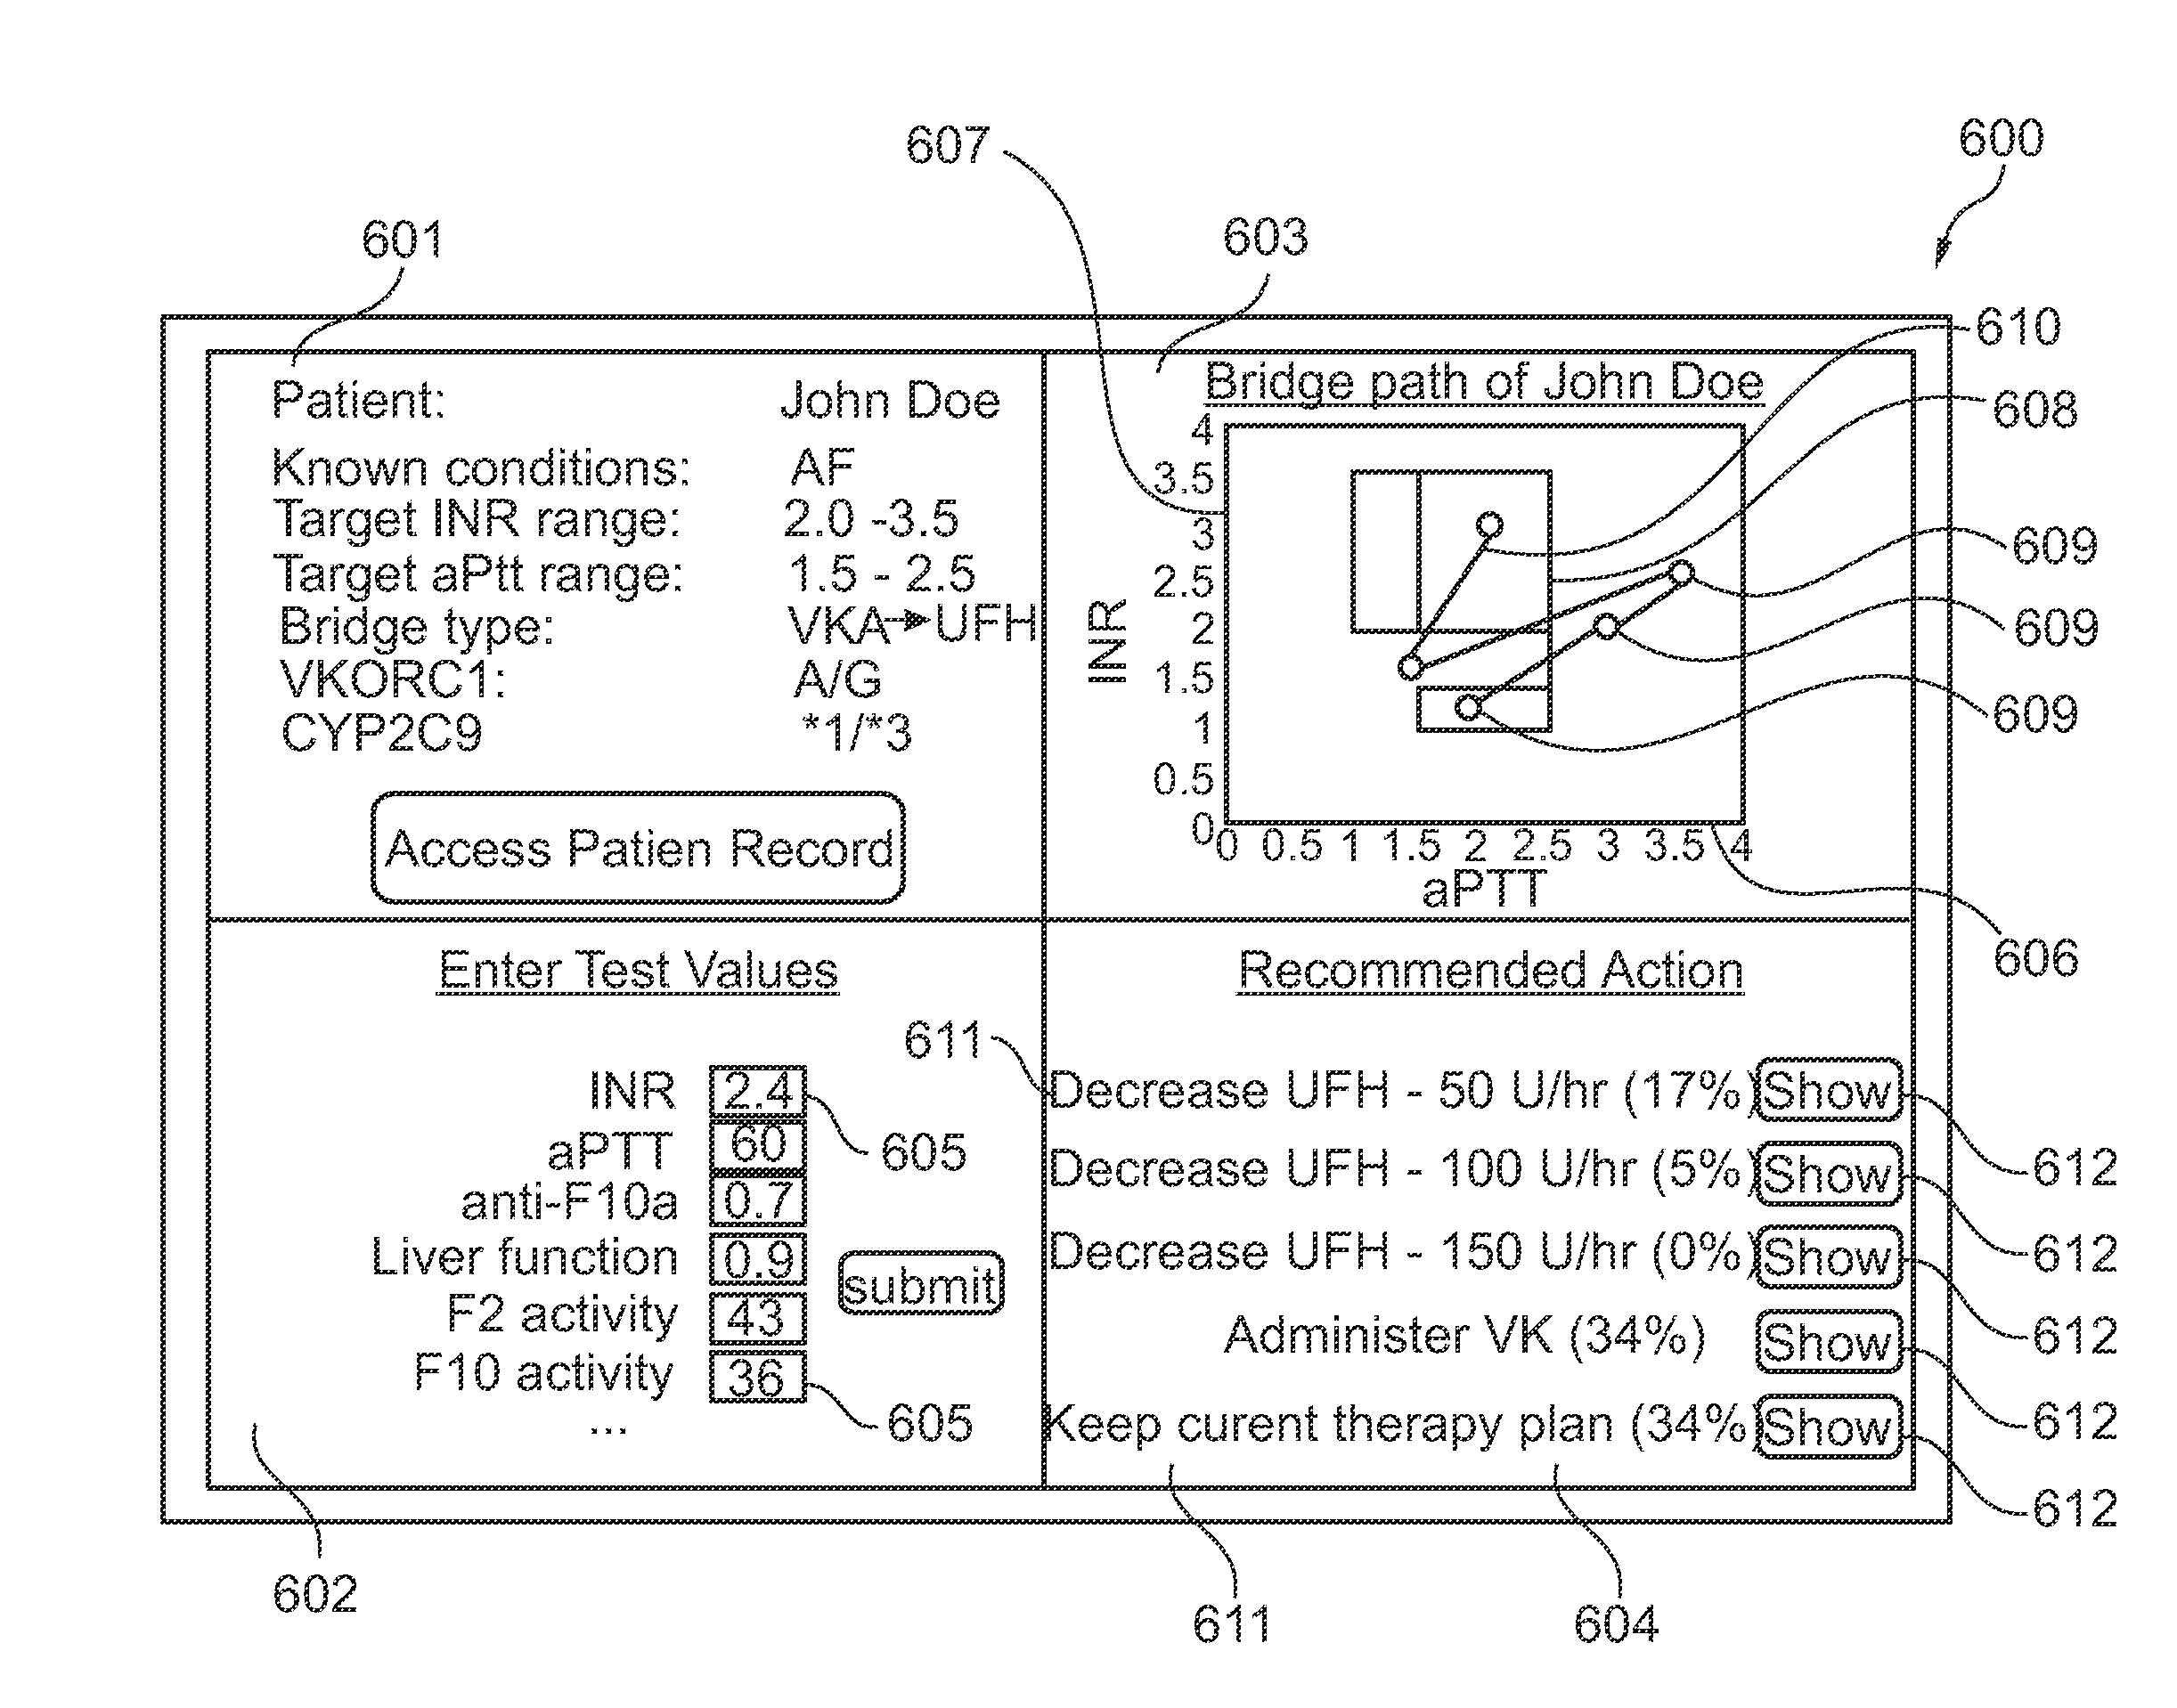
The present invention provides for a simultaneous graphical representation, a risk of bleeding and a risk of thrombosis providing a visualized bridge therapy process. Furthermore, the present invention provides for a computer-based prediction of the haemostatic situation of the examined blood circulation by using a combination of a biochemical model and a pharmacokinetic model for calculation or another mathematical representation of the blood circulation.

Description

FIELD OF THE INVENTION[0001]The present invention relates to clinical decision support systems. In detail, the present invention relates to a method of visualizing a bridge therapy process, to a user interface for visualizing a bridge therapy process, to a program element for visualizing a bridge therapy process and a computer readable medium.BACKGROUND OF THE INVENTION[0002]Medicinal anti-coagulation therapy has the risk of causing life-threatening bleeding events. Therefore, anti-coagulation therapy is regularly monitored to obtain the right balance between thrombosis and bleeding risk. The diagnostic test that is best used for this purpose depends on the type of anticoagulant drug that is administered. For short term anti-coagulation therapy that needs fast adjustments, unfractionated heparin, or heparin-like drugs such as low-molecular weight heparin (LMWH) and pentasaccharides are used. For longer term therapy, oral, vitamin K antagonist (VKA) type anticoagulants are most widel...

Claims


Application Information

Patent Timeline
Patent Type & Authority Applications(United States)
IPC IPC(8): G06F19/26A61B5/026A61B5/00G16B45/00G16H10/40G16H50/50
CPCG06F19/26A61B5/026A61B5/4848A61B5/7278G16H50/50G16H50/20G16H40/60G16H20/10A61B5/02042G16B5/30G16B45/00A61B5/02028A61B5/7275A61B5/7475G16H50/30G16H10/40A61B5/742
Inventor VAN OOIJEN, HENIK JANVAN DEN HAM, RENEBAKKER, BART
Owner KONINKLJIJKE PHILIPS NV
Learn More