

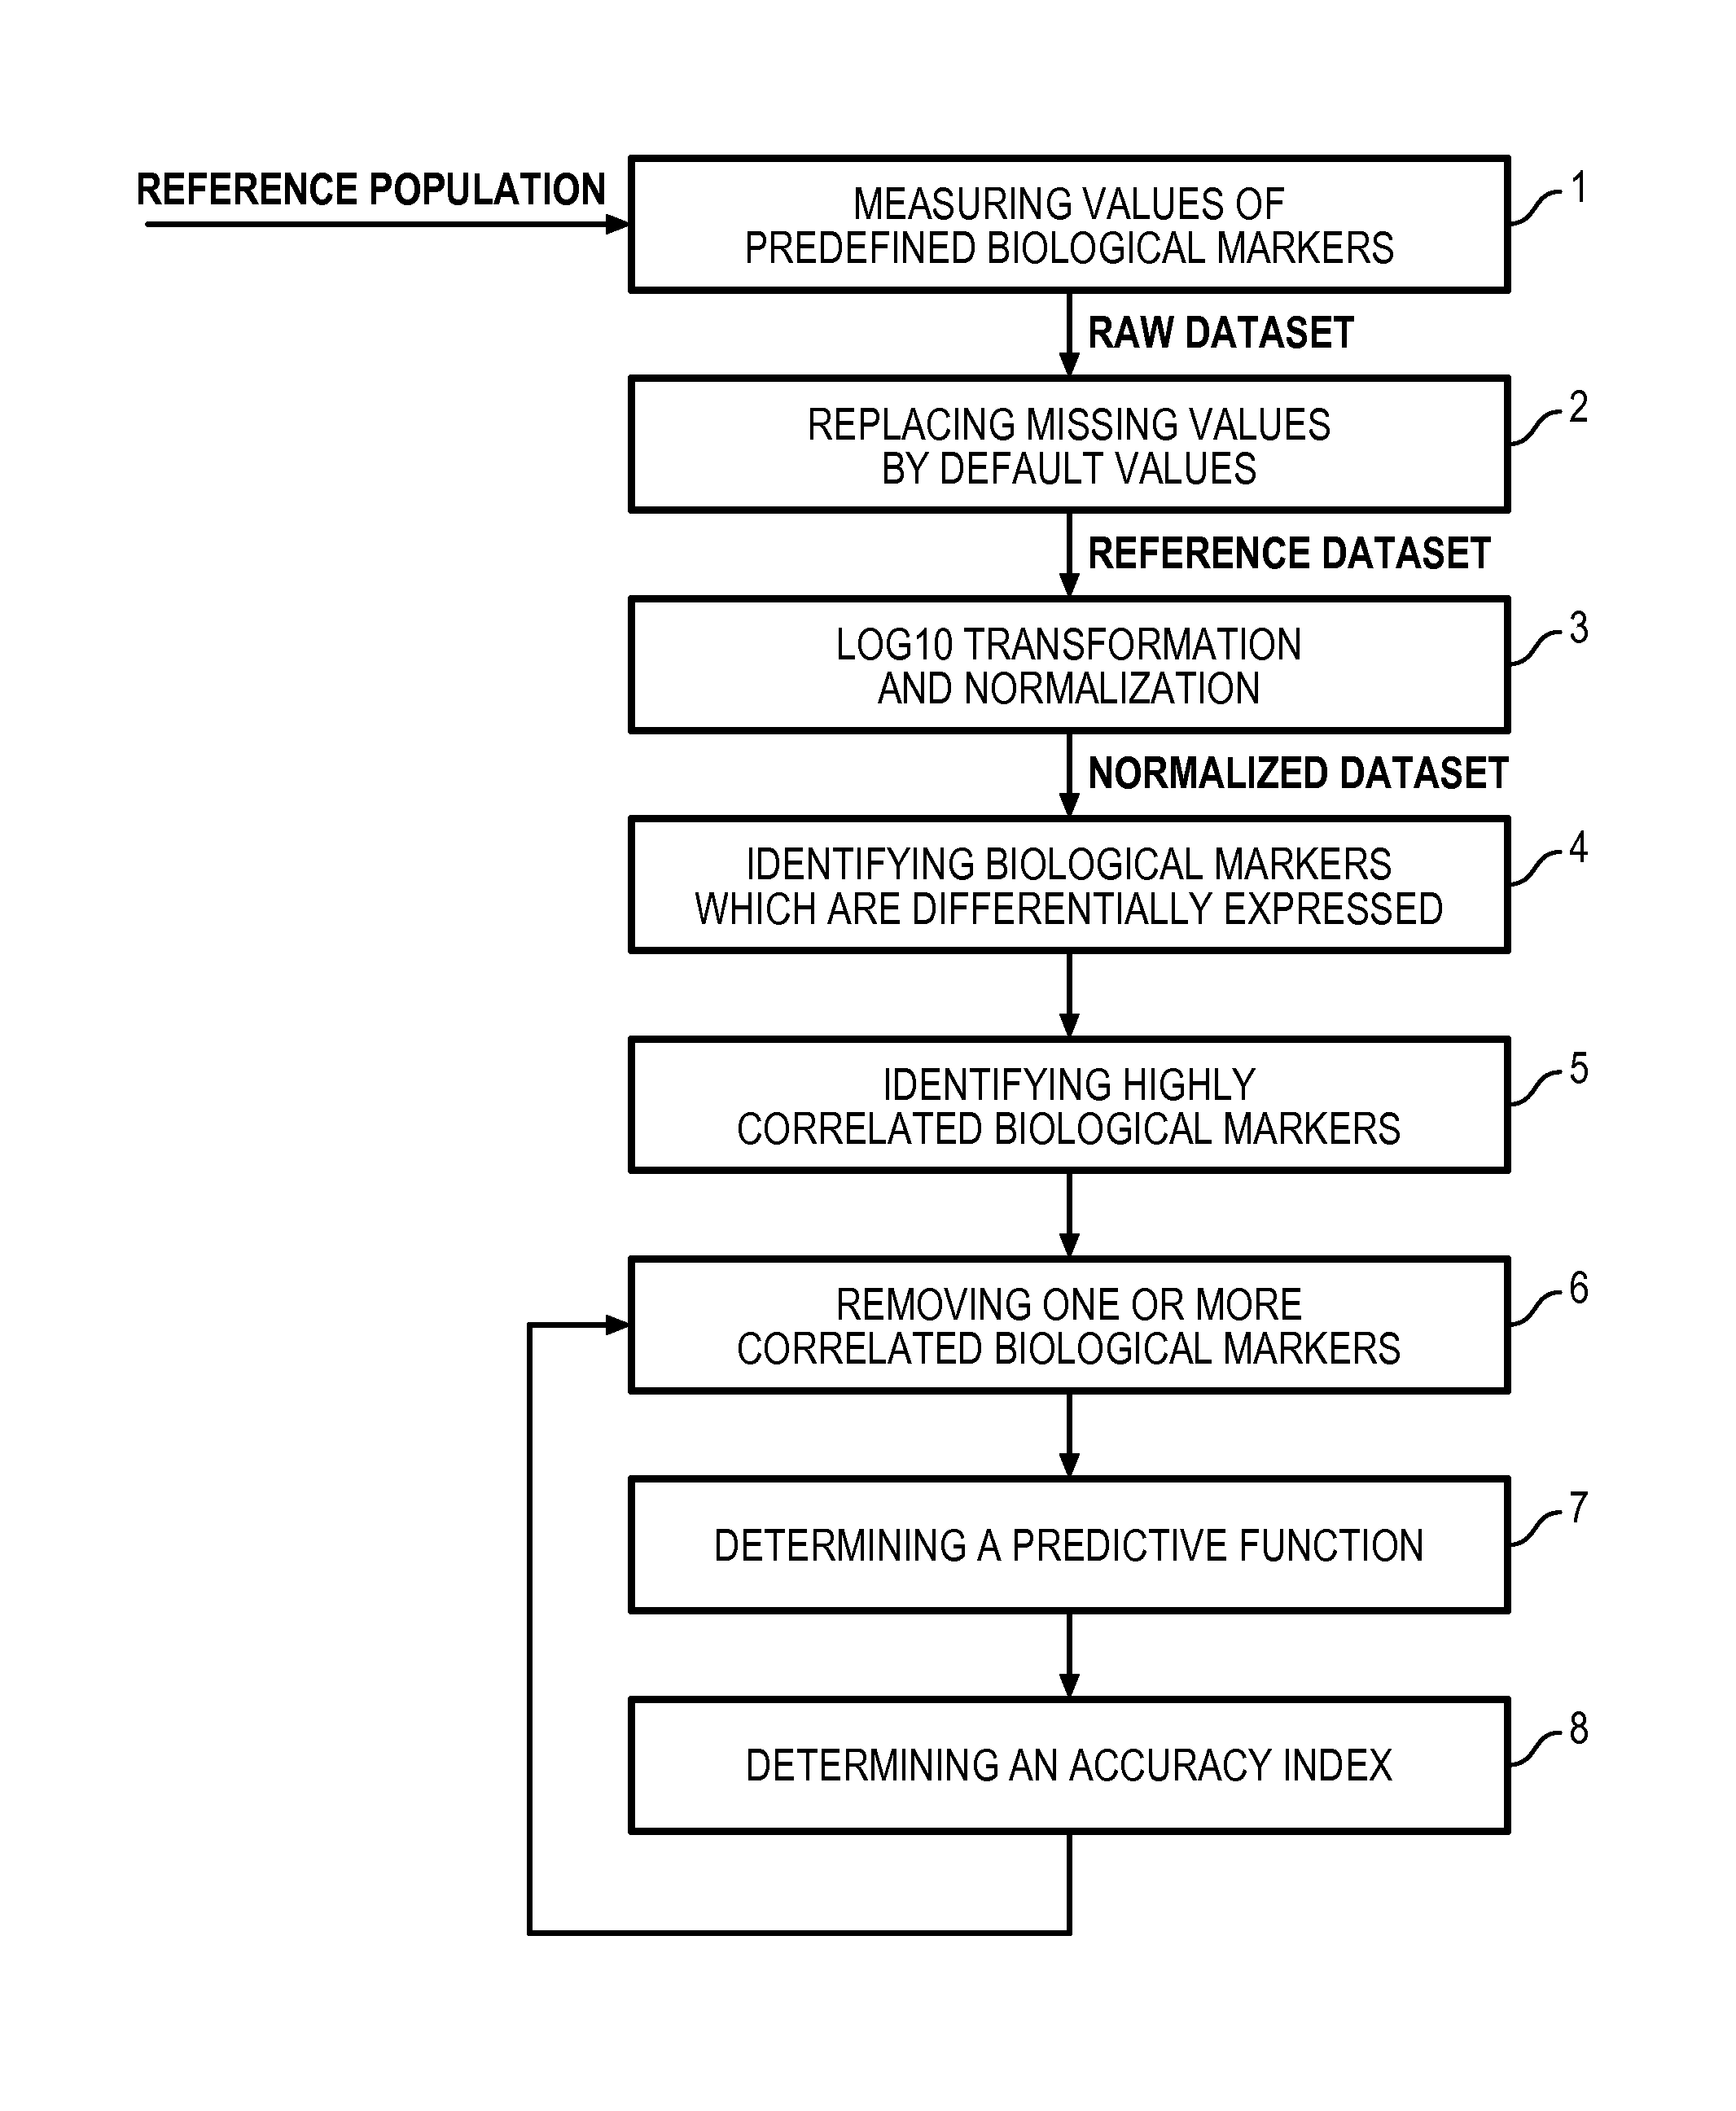
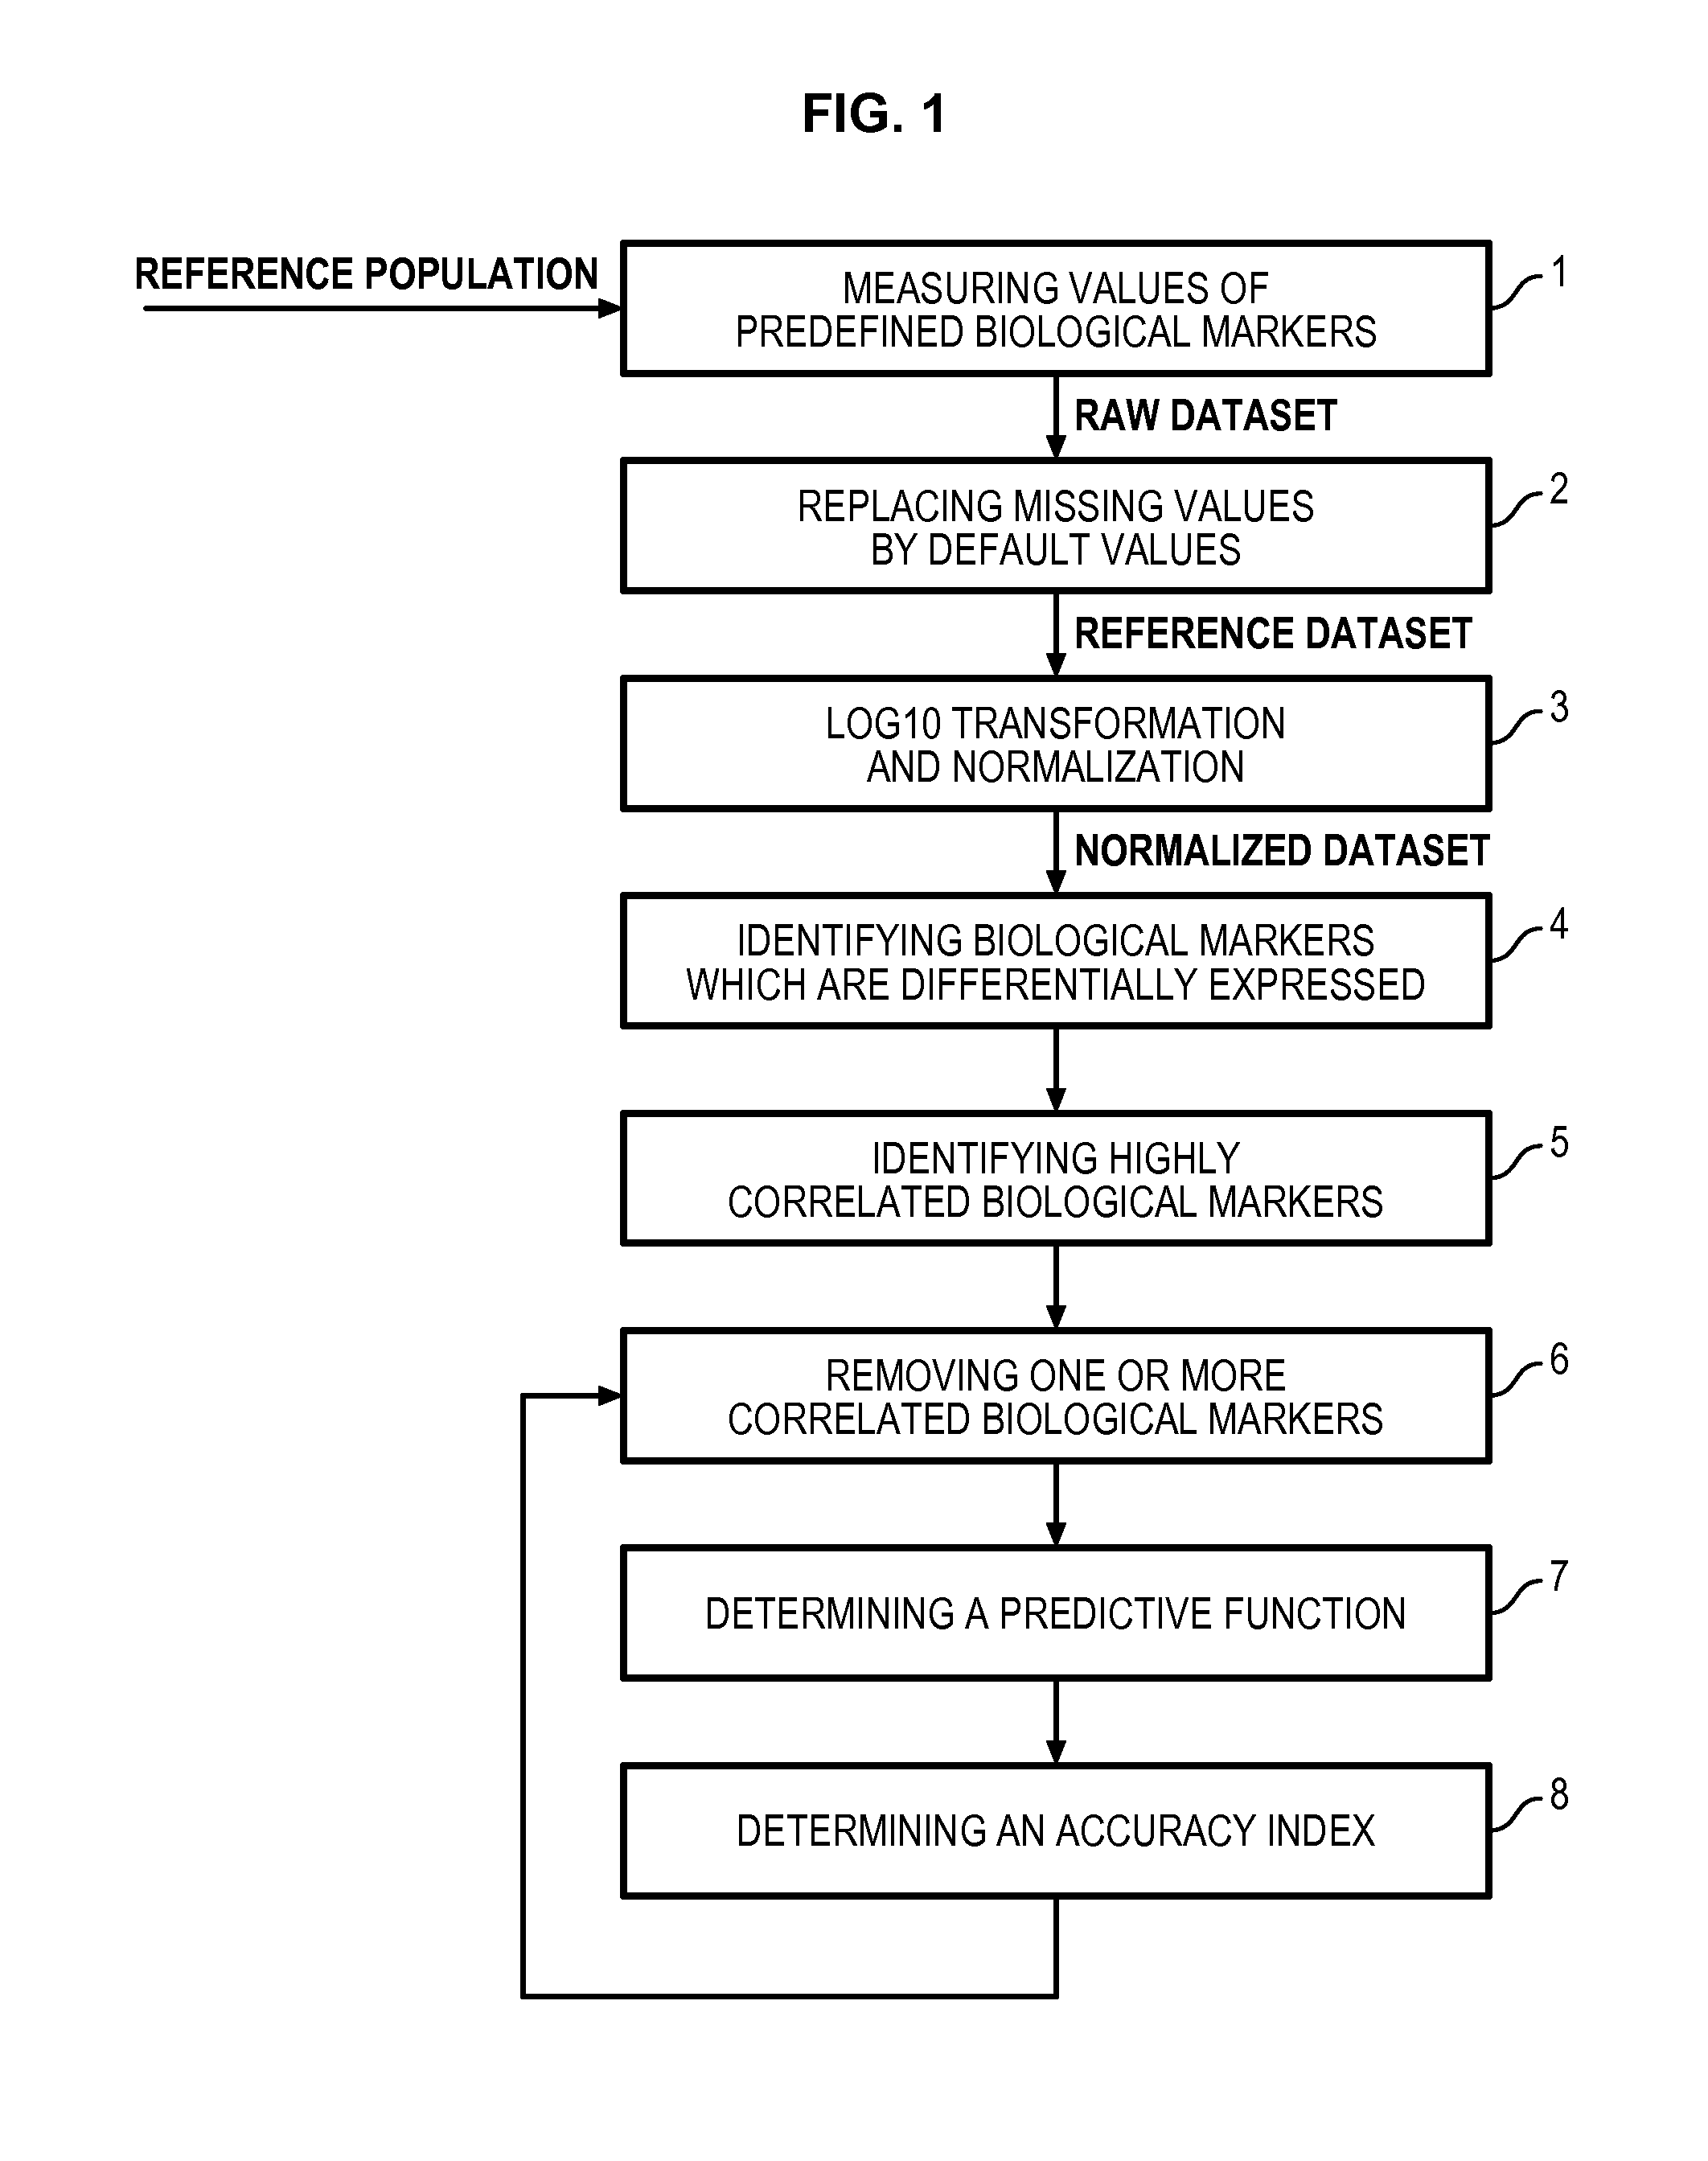
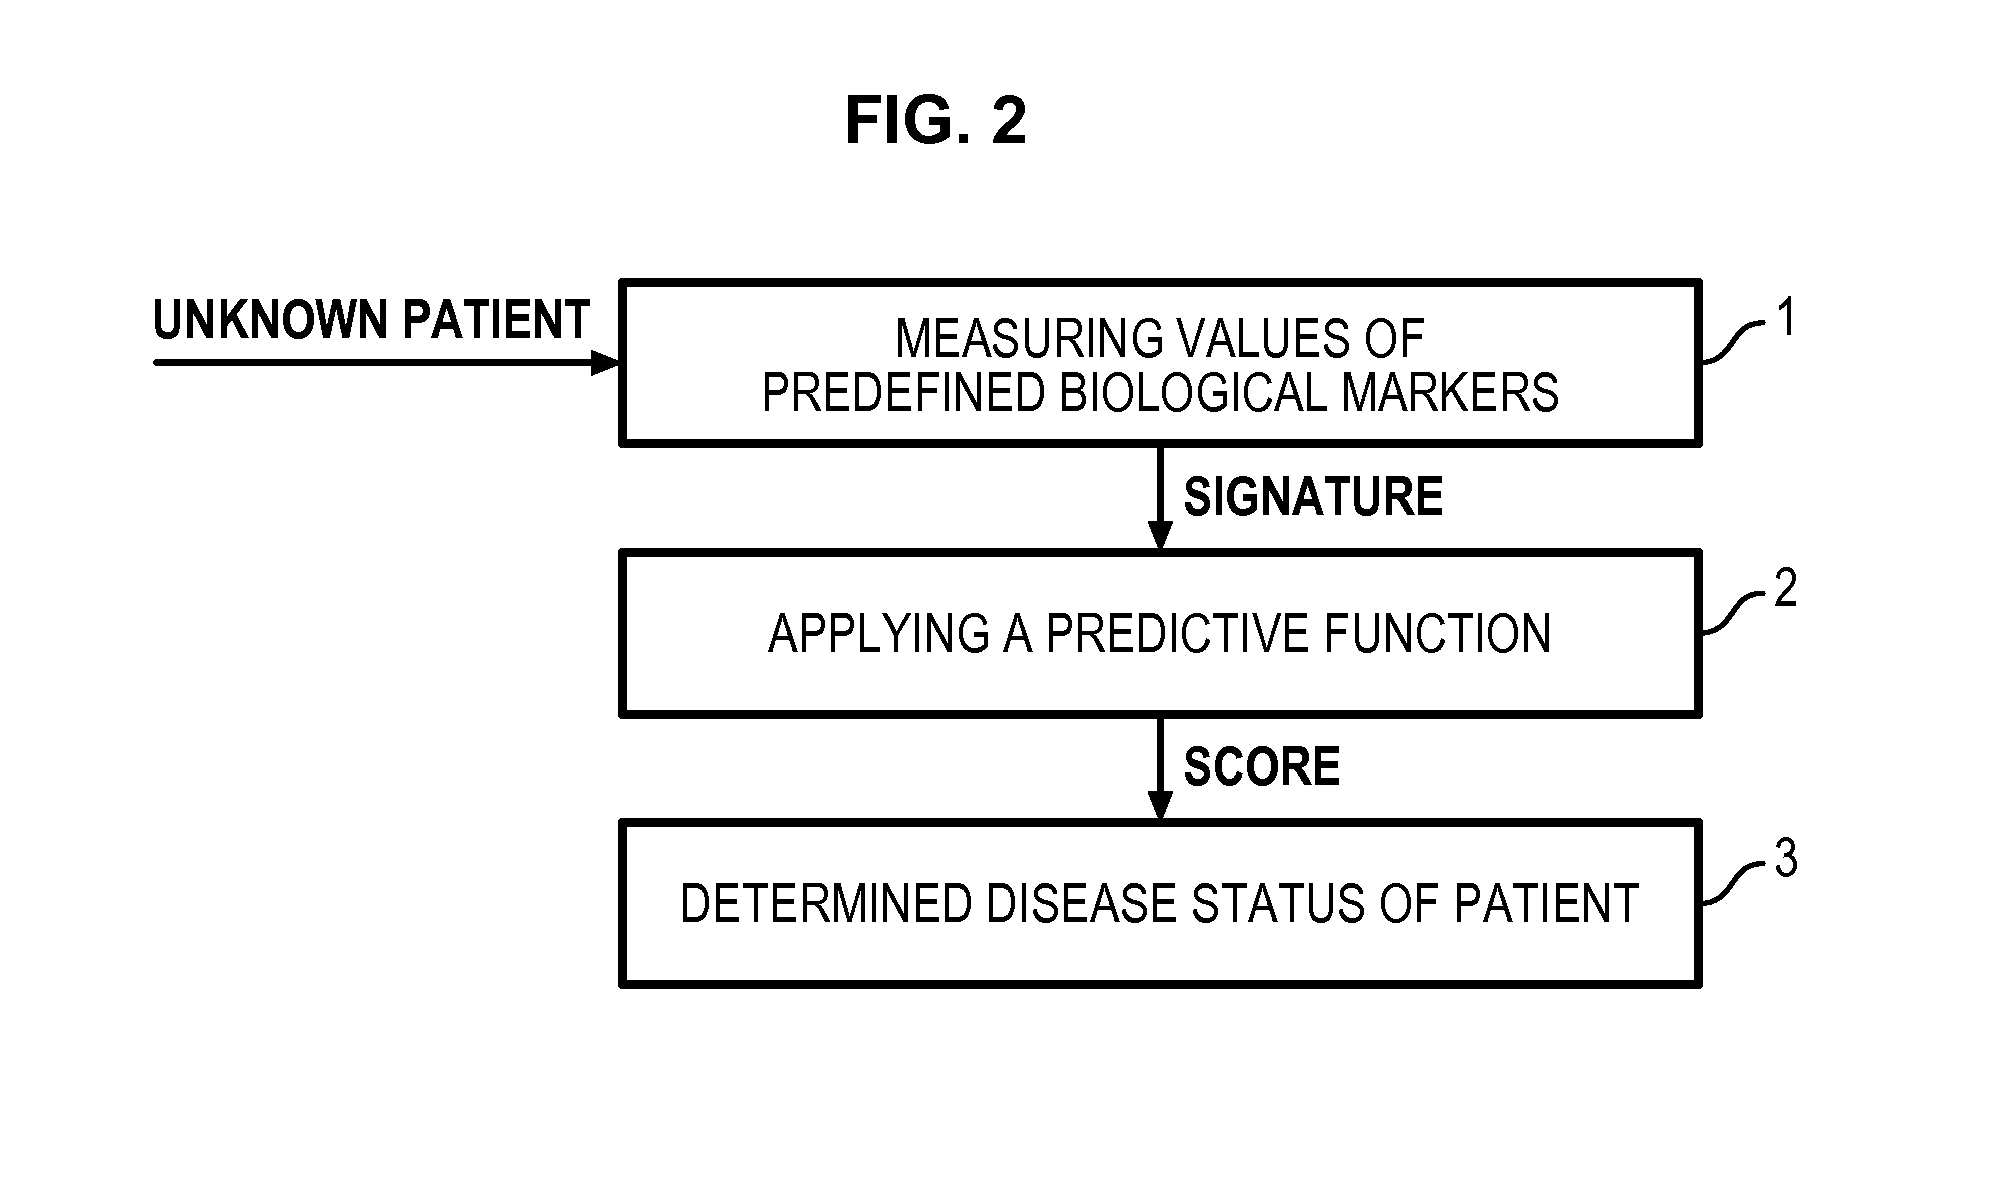
Method for determining a predictive function for discriminating patients according to their disease activity status
a disease activity and function technology, applied in the field of determining the predictive function of discriminating patients according to their disease activity status, can solve the problems of reducing the sensitivity of diagnosis, unable to determine the most relevant biological marker(s), and data which can possibly be collected from patients, so as to reduce the number of measured biological markers needed
- Summary
- Abstract
- Description
- Claims
- Application Information
AI Technical Summary
Benefits of technology
Problems solved by technology
Method used
Image

Examples
example 1
Takayasu's Arteritis
[0177]Takayasu arteritis (TA) is a large-vessel vasculitis of unknown origin. Data on predictive criteria of TA activity are lacking. One objective is to identify an immunological signature that help to discriminate active and inactive patients with TA.
[0178]Thirty TA patients (11 active untreated [aTA] and 19 treated and inactive [iTA]) fulfilling the American College of Rheumatology criteria and healthy donors (HD) were included. We measured levels of 26 cytokines (GM-CSF, IFN-α, IFN-γ, IL-1RA, IL1β, IL-2, IL-2r, IL-4, IL-5, IL-6, IL-7, IL-8, IL-10, IL-12, IL-13, IL-15, IL-17, CXCL-10 (IP-10), CCL-2 (MCP-1), CXCL-9 (MIG), CCL-3 (MIP-1α), CCL-4 (MIP-1β), CCL-5, TNF-α, Eotaxin, IL-21 and IL-23) in culture supernatants using Luminex and ELISA:
[0179]We used a multivariate analysis in order to identify a signature that discriminate active and inactive TA patients. The multivariate analysis used a Student test associated with Benjamini-Hochberg correction (q-value<0....
example 2
Giant Cell Arteritis (Horton Disease)
[0185]Giant cell arteritis is a systemic autoimmune disorder that typically affects medium and large arteries, usually leading to occlusive granulomatous vasculitis with transmural infiltrate containing multinucleated giant cells. The temporal artery is commonly involved. This disorder appears primarily in people over the age of 50. We used a multivariate analysis in order to identify an immunological signature that help to discriminate patients with active and inactive Giant cell arteritis. The multivariate analysis used a Student test associated with Benjamini-Hochberg correction (q-value<0.05).
[0186]A dataset of 26 cytokine and chemokine levels was available for a cohort of 30 patients presenting active disease (14 A) or disease in remission (16 I).
[0187]We measured levels of 26 cytokines (GM-CSF, IFN-α, IFN-γ, IL-1RA, IL1β, IL-2, IL-2r, IL-4, IL-5, IL-6, IL-7, IL-8, IL-10, IL-12, IL-13, IL-15, IL-17, CXCL-10 (IP-10), CCL-2 (MCP-1), CXCL-9 (MI...
example 3
Sporadic Inclusion Body Myositis
[0194]Sporadic Inclusion Body Myositis (sIBM) is an inflammatory myopathy characterized by CD8+ cytotoxic infiltrates and amyloid deposits. Regulatory T cells (Treg) are key regulators of immune response.
[0195]A dataset of 25 cytokines and chemokines levels was available for a cohort of 22 patients presenting active disease (22 sISBM) or controls (22 ctrls).
[0196]Quantitative determination of 25 cytokines or chemokines (GM-CSF, IFN-α, IFN-γ, IL-1RA, IL1β, IL-2, IL-2r, IL-4, IL-5, IL-6, IL-7, IL-8, IL-10, IL-12, IL-13, IL-15, IL-17, CXCL-10 (IP-10), CCL-2 (MCP-1), CXCL-9 (MIG), CCL-3 (MIP-1α), CCL-4 (MIP-1β), CCL-5 (RANTES), TNF-α and Eotaxin) was performed in sera and in supernatant of culture, using Human Cytokine 25-Plex (Invitrogen, Cergy Pontoise, France) in accordance with the manufacturer protocol. We used a multivariate analysis in order to identify a signature that discriminate active sIBM patients and controls. The multivariate analysis used ...
PUM
 Abstract
Description
Claims
Application Information