Method and Use of Metabolites for the Diagnosis and Differentiation of Neonatal Encephalopathy
- Summary
- Abstract
- Description
- Claims
- Application Information
AI Technical Summary
Benefits of technology
Problems solved by technology
Method used
Image
Examples
example 1
Hypoxia-Induced Damage of Hippocampus
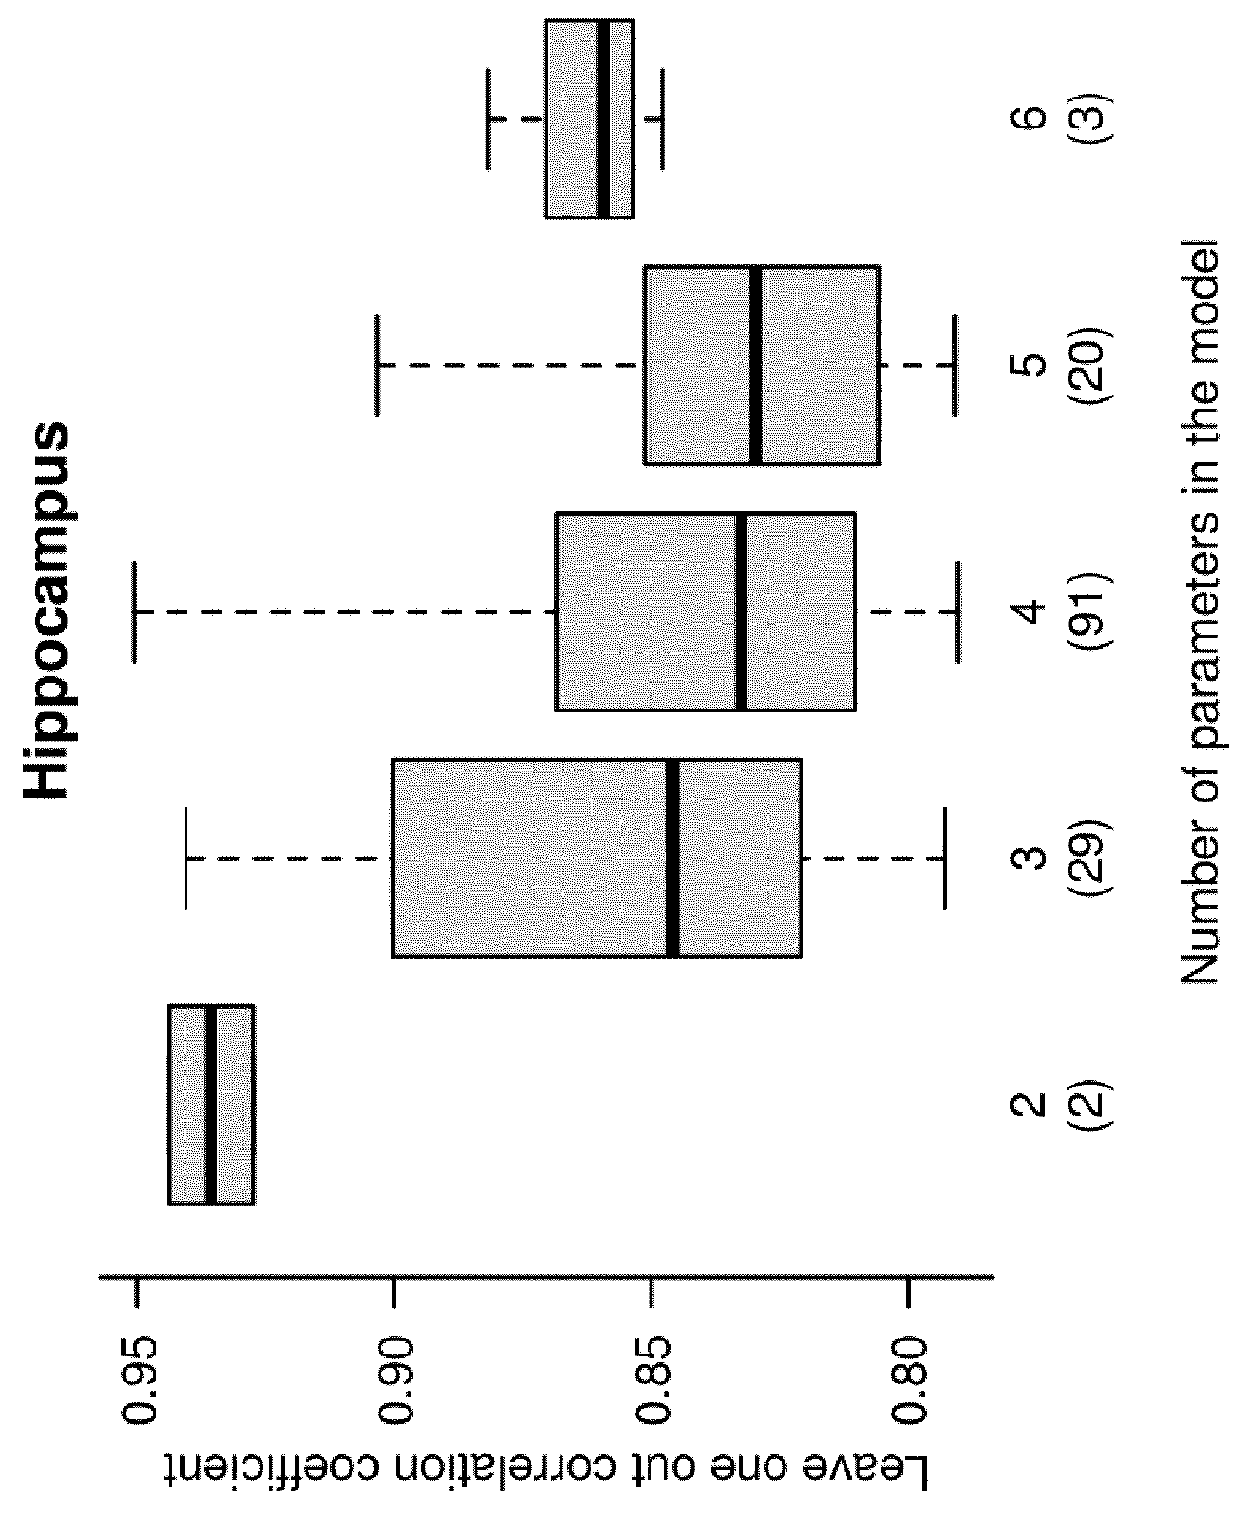
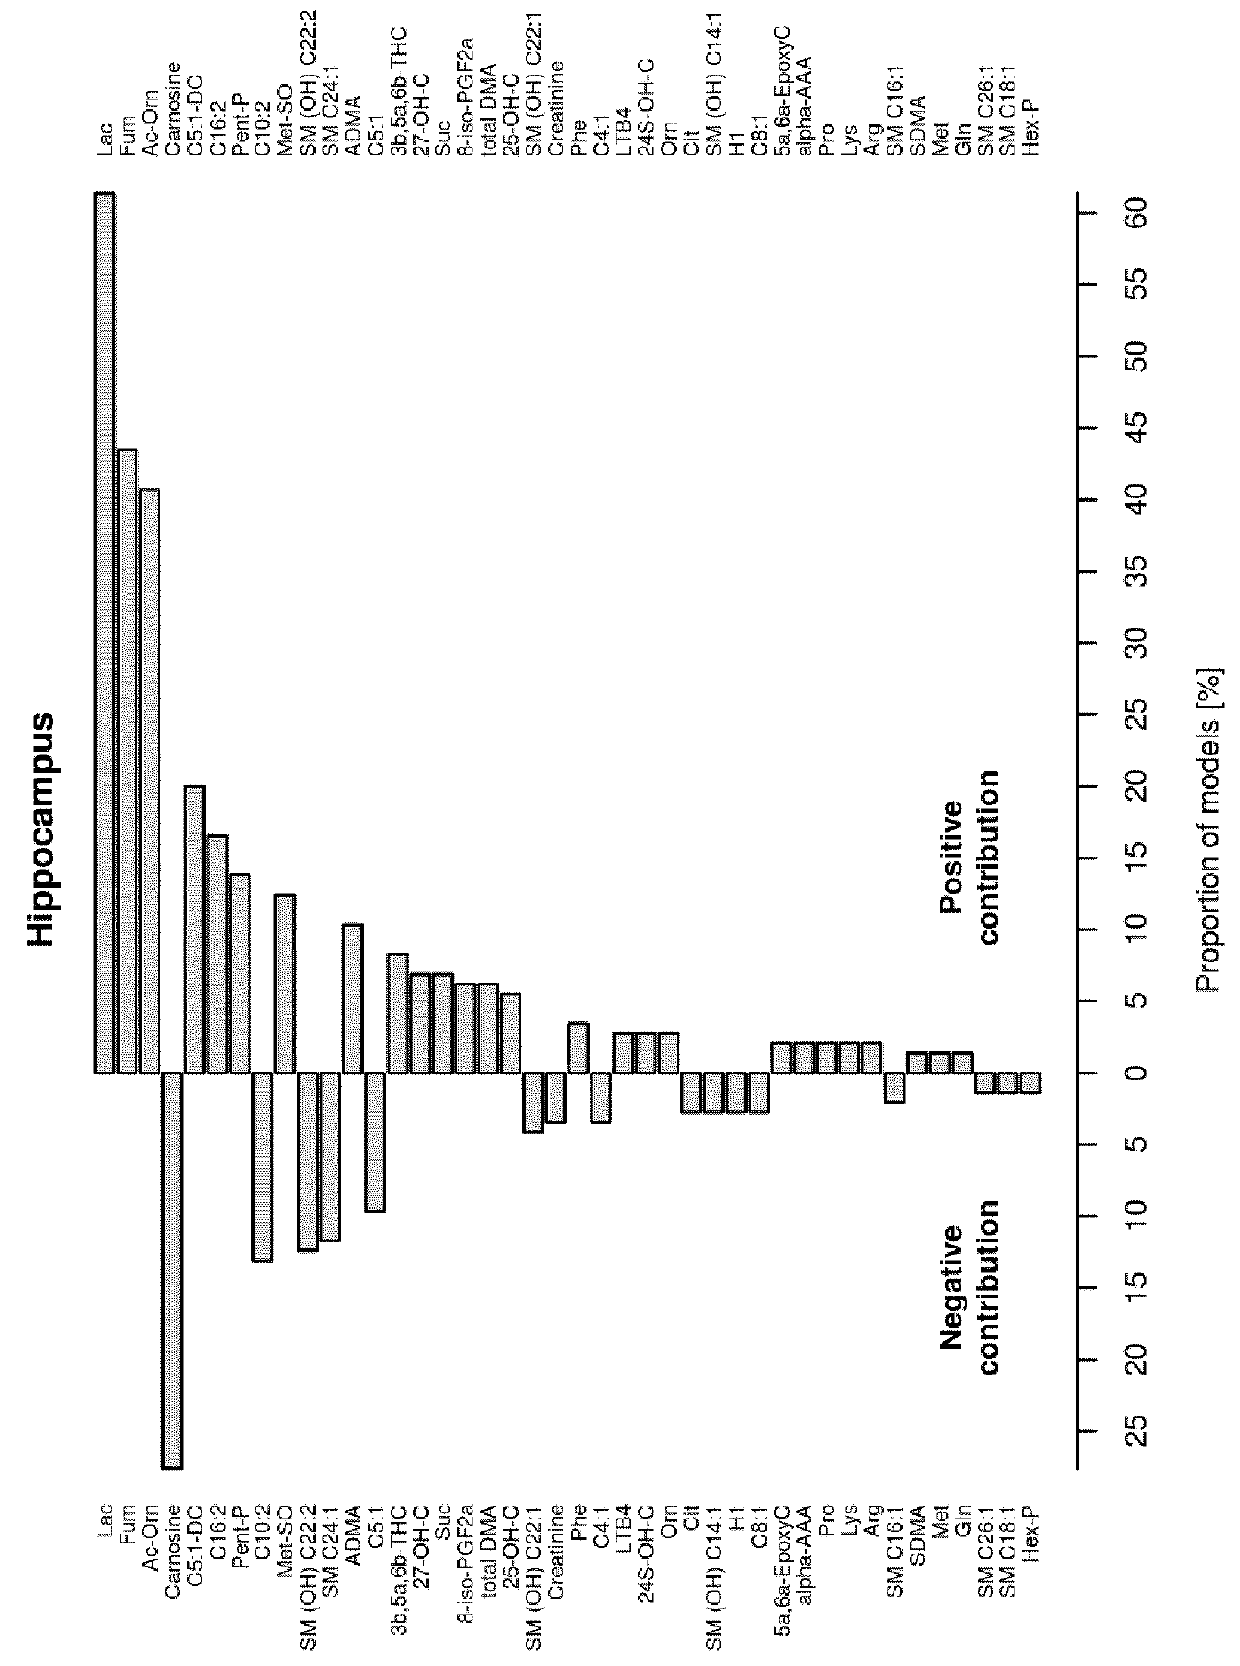
[0265]As mentioned above the lack oxygen resulted in increased apoptotic and / or necrotic cell death assessed in the brain of newborn piglets 48 hours after the lack of oxygen. Blood samples were taken 30 minutes after the period of lack of oxygen and the metabolite concentrations were analysed as described above. These metabolite concentrations were then correlated with the absolute quantitative amount of dying cell in the hippocampus. Table 5 summarises the result of univariate correlation statistics between metabolite concentration as determined in plasma 30 minutes after asphyxia and the amount of cell death in hippocampus at 48 hours after asphyxia. For each metabolite, Pearson correlation coefficient (Cor) and its corresponding p value are given alongside the coefficient of determination (Rsq). Prob designates the actual probability (in %) to enter a combination of metabolites.
TABLE 5Outcome parameter: Brain damage in hippocampusShortFull na...
example 2
Hypoxia-Induced Damage of Basal Ganglia
[0272]As mentioned above the lack oxygen resulted in increased apoptotic and / or apoptotic cell death assessed in the brain of newborn piglets 48 hours after the lack of oxygen. Blood samples were taken 30 minutes after the period of lack of oxygen and the metabolite concentrations were analysed as described above. These metabolite concentrations were then correlated with the absolute quantitative amount of dying cell in the basal ganglia. Table 6 summarises the result of univariate correlation statistics between metabolite concentration as determined in plasma 30 minutes after asphyxia and the amount of cell death in basal ganglia at 48 hours after asphyxia. For each metabolite, Pearson correlation coefficient (Cor) and its corresponding p value are given alongside the coefficient of determination (Rsq). Prob designates the actual probability (in %) to enter a combination of metabolites.
TABLE 6Outcome parameter: Brain damage in Basal gangliaSho...
example 3
Hypoxia-Induced Effect on Neurological Score
[0279]Lack oxygen resulted in alteration of the neurobehavioural score at 4 hourly time points in the first 24 hours and at 48 h. This score contains 9 items of maximal 2 points, so the maximal score is 18 points and exists of the nine neurologic items as described above. Blood samples were taken 30 minutes after the period of lack of oxygen and the metabolite concentrations were analysed as described above. These metabolite concentrations were then correlated with the neurobehavioural score. Table 7 summarizes the result of univariate correlation statistics between metabolite concentration as determined in plasma 30 minutes after asphyxia and the neurological behavioral score at 48 hours after asphyxia. For each metabolite, Pearson correlation coefficient (Cor) and its corresponding p value are given alongside the coefficient of determination (Rsq). Prob designates the actual probability (in %) to enter a combination of metabolites.
TABLE ...
PUM
| Property | Measurement | Unit |
|---|---|---|
| Time | aaaaa | aaaaa |
| Molecular weight | aaaaa | aaaaa |
Abstract
Description
Claims
Application Information
 - R&D
- Intellectual Property
- Life Sciences
- Materials
- Tech Scout
- Unparalleled Data Quality
- Higher Quality Content
- 60% Fewer Hallucinations
Browse by: Latest US Patents, China's latest patents, Technical Efficacy Thesaurus, Application Domain, Technology Topic, Popular Technical Reports.
© 2025 PatSnap. All rights reserved.Legal|Privacy policy|Modern Slavery Act Transparency Statement|Sitemap|About US| Contact US: help@patsnap.com


