Use of blood group status iii
a technology of blood group and status, applied in the field of microbial composition, can solve the problems of ineffective promotion of the desired health effect of most individuals by many probiotic supplements and products currently on the market, and little is known which genes determine or regulate the microbial composition
- Summary
- Abstract
- Description
- Claims
- Application Information
AI Technical Summary
Benefits of technology
Problems solved by technology
Method used
Image
Examples
example 1
[0116]Secretor status was determined from the blood samples by using an agglutination assay. Secretor status was determined from 59 individual and 48 were secretors and seven were non-secretors. The secretor status of four samples could not be determined; they were excluded from the further analyses.
example 2
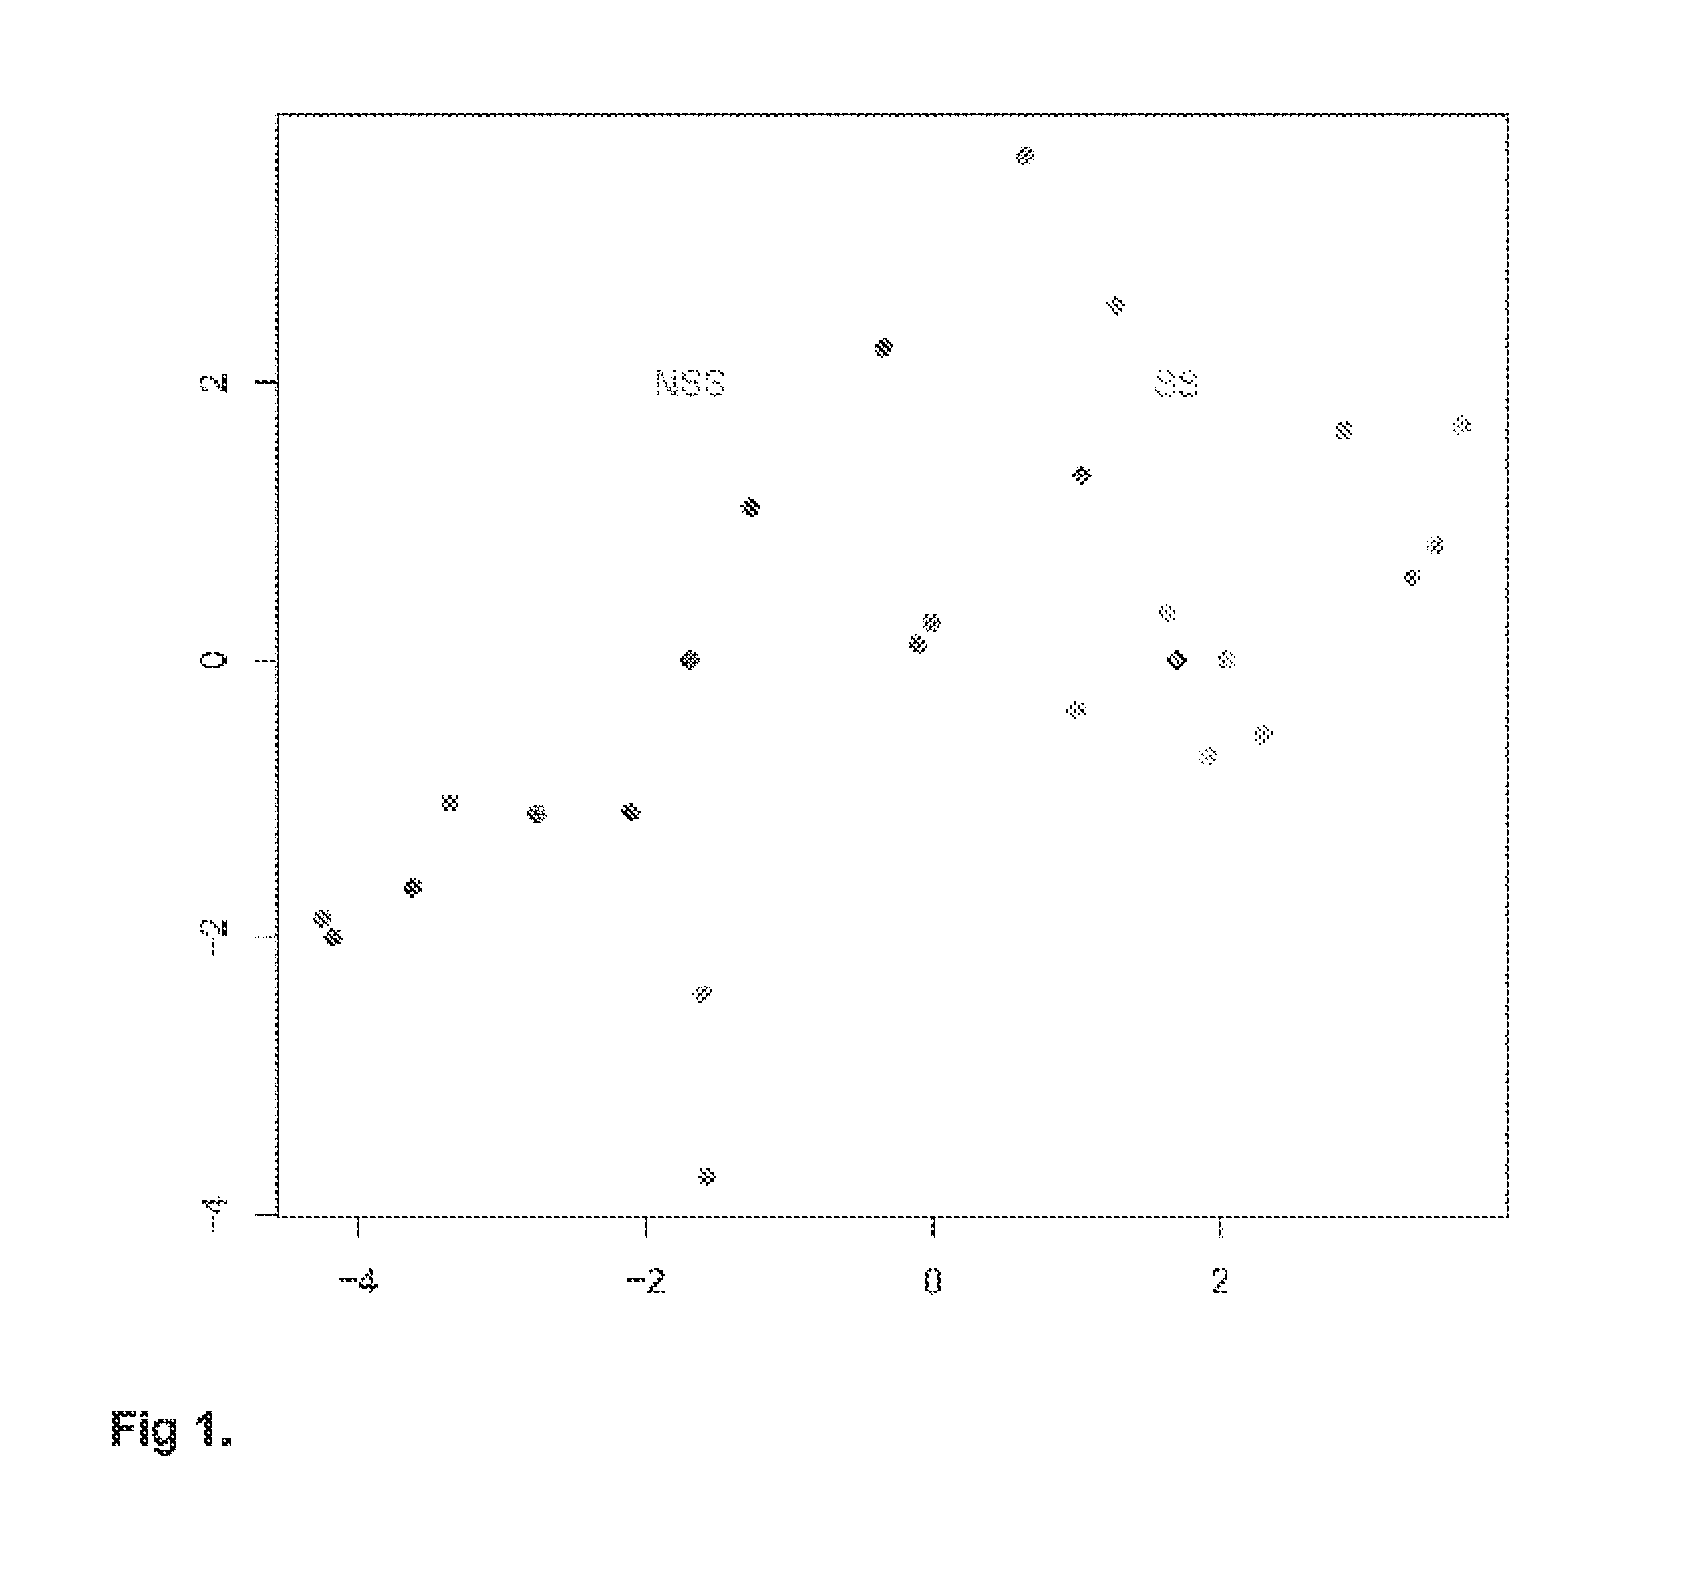
[0117]In universal DGGE analysis of dominant intestinal bacteria, several genotypes occurred statistically significantly more often or with a higher intensity in the non-secretor samples than in the secretor samples. All genotypes were 2 to 3.6 times more frequently detected in the non-secretor in comparison to secretor samples. The genotypes can be identified by the band positions on universal DGGE gel corresponding the band positions 25.30%, 26.40%, 50.40% and 56.80%. The band positions, genotypes, which differed between non-secretor and secretor individuals and their detection frequencies, are shown in Table 3.
TABLE 3Statistically significant differences on band intensities between non-secretor (NSS) and secretor (SS) samples as determined by universal-DGGE (n = 55, NSS = 7, SS = 48). Statistical tests,ANOVA (ANO) and Kruskal-Wallis (KW) were based on band intensity matrixand Fisher's exact test (F) was based on presence / absence-matrix of the bandsnumbernumberMean band# ofin NSSi...
example 3
[0118]A genotype belonging to Eubacterium rectale-Clostridium coccoides-group (EREC) and corresponding band position 60.0% in EREC-DGGE gels was clearly more common in non-secretor than in secretor samples. The genotype was more than seven times more common in the samples from non-secretor individuals than in the samples of secretor individuals. The results are shown in Table 4.
TABLE 4Statistically significant differences on band intensities between non-secretor (NSS) and secretor (SS) samples as determined by EREC-DGGE(n = 55, NSS = 7, SS = 48). Statistical tests, ANOVA(ANO) and Kruskal-Wallis (KW) were based on band intensity matrix andFisher's exact test (F) was based on presence / absence-matrix of the bandsp-valuenumbernumberMean band(ANO / # ofin NSSin SSintensity inGenotypeTestKW / F)hits(%)(%)NSS / in SS60.00%ANO / 0.00002 / 6 (10)3 (43)3 (6)30 / 11KW / F0.0006 / 0.04
PUM
| Property | Measurement | Unit |
|---|---|---|
| pH | aaaaa | aaaaa |
| concentration | aaaaa | aaaaa |
| spectrum | aaaaa | aaaaa |
Abstract
Description
Claims
Application Information
 - R&D
- Intellectual Property
- Life Sciences
- Materials
- Tech Scout
- Unparalleled Data Quality
- Higher Quality Content
- 60% Fewer Hallucinations
Browse by: Latest US Patents, China's latest patents, Technical Efficacy Thesaurus, Application Domain, Technology Topic, Popular Technical Reports.
© 2025 PatSnap. All rights reserved.Legal|Privacy policy|Modern Slavery Act Transparency Statement|Sitemap|About US| Contact US: help@patsnap.com

