Method and apparatus for low complexity spectral analysis of bio-signals

a biosignal and low complexity technology, applied in the field of signal analysis, can solve the problems of large and even prohibitive quality distortion, difficult to reduce complexity, etc., and achieve the effects of reducing complexity, large energy savings, and reducing complexity

Active Publication Date: 2015-08-06
ECOLE POLYTECHNIQUE FEDERALE DE LAUSANNE (EPFL)
View PDF0 Cites 22 Cited by
  • Summary
  • Abstract
  • Description
  • Claims
  • Application Information

AI Technical Summary

Benefits of technology

[0015]There are many algorithms in which it is difficult to reduce the complexity and thus the energy without incurring large and even prohibitive quality distortions. The main idea of the invention is to express signals within a target application in a basis in which they exhibit an approximately-sparse representation, thus enabling complexity reduction with minor distortions even in cases that this was not possible before. Specifically, an approximately sparse transformation exposes the significant signal components and allows for the identification and pruning of less-significant computations in subsequent operations in the new basis. Subsequently, this leads to large energy savings with minimum distortions since only the less-significant operations / data that affect the output quality to a minor degree are being pruned.

Problems solved by technology

There are many algorithms in which it is difficult to reduce the complexity and thus the energy without incurring large and even prohibitive quality distortions.
In addition, experiments with numerous cardiac samples of various patients show that such energy savings come with a quality loss which does not affect the system detection capability of sinus-arrhythmia.

Method used


Image

  • Method and apparatus for low complexity spectral analysis of bio-signals
  • Method and apparatus for low complexity spectral analysis of bio-signals
  • Method and apparatus for low complexity spectral analysis of bio-signals

Examples


Embodiment Construction

1.4.1 Complexity Reduction Through Alternative Signal Representations

[0123]Changing substantially existing algorithm formulations by considering signal representations in domains where the signal may be (approximately) sparse could allow for a reduction of algorithmic complexity and thus energy.

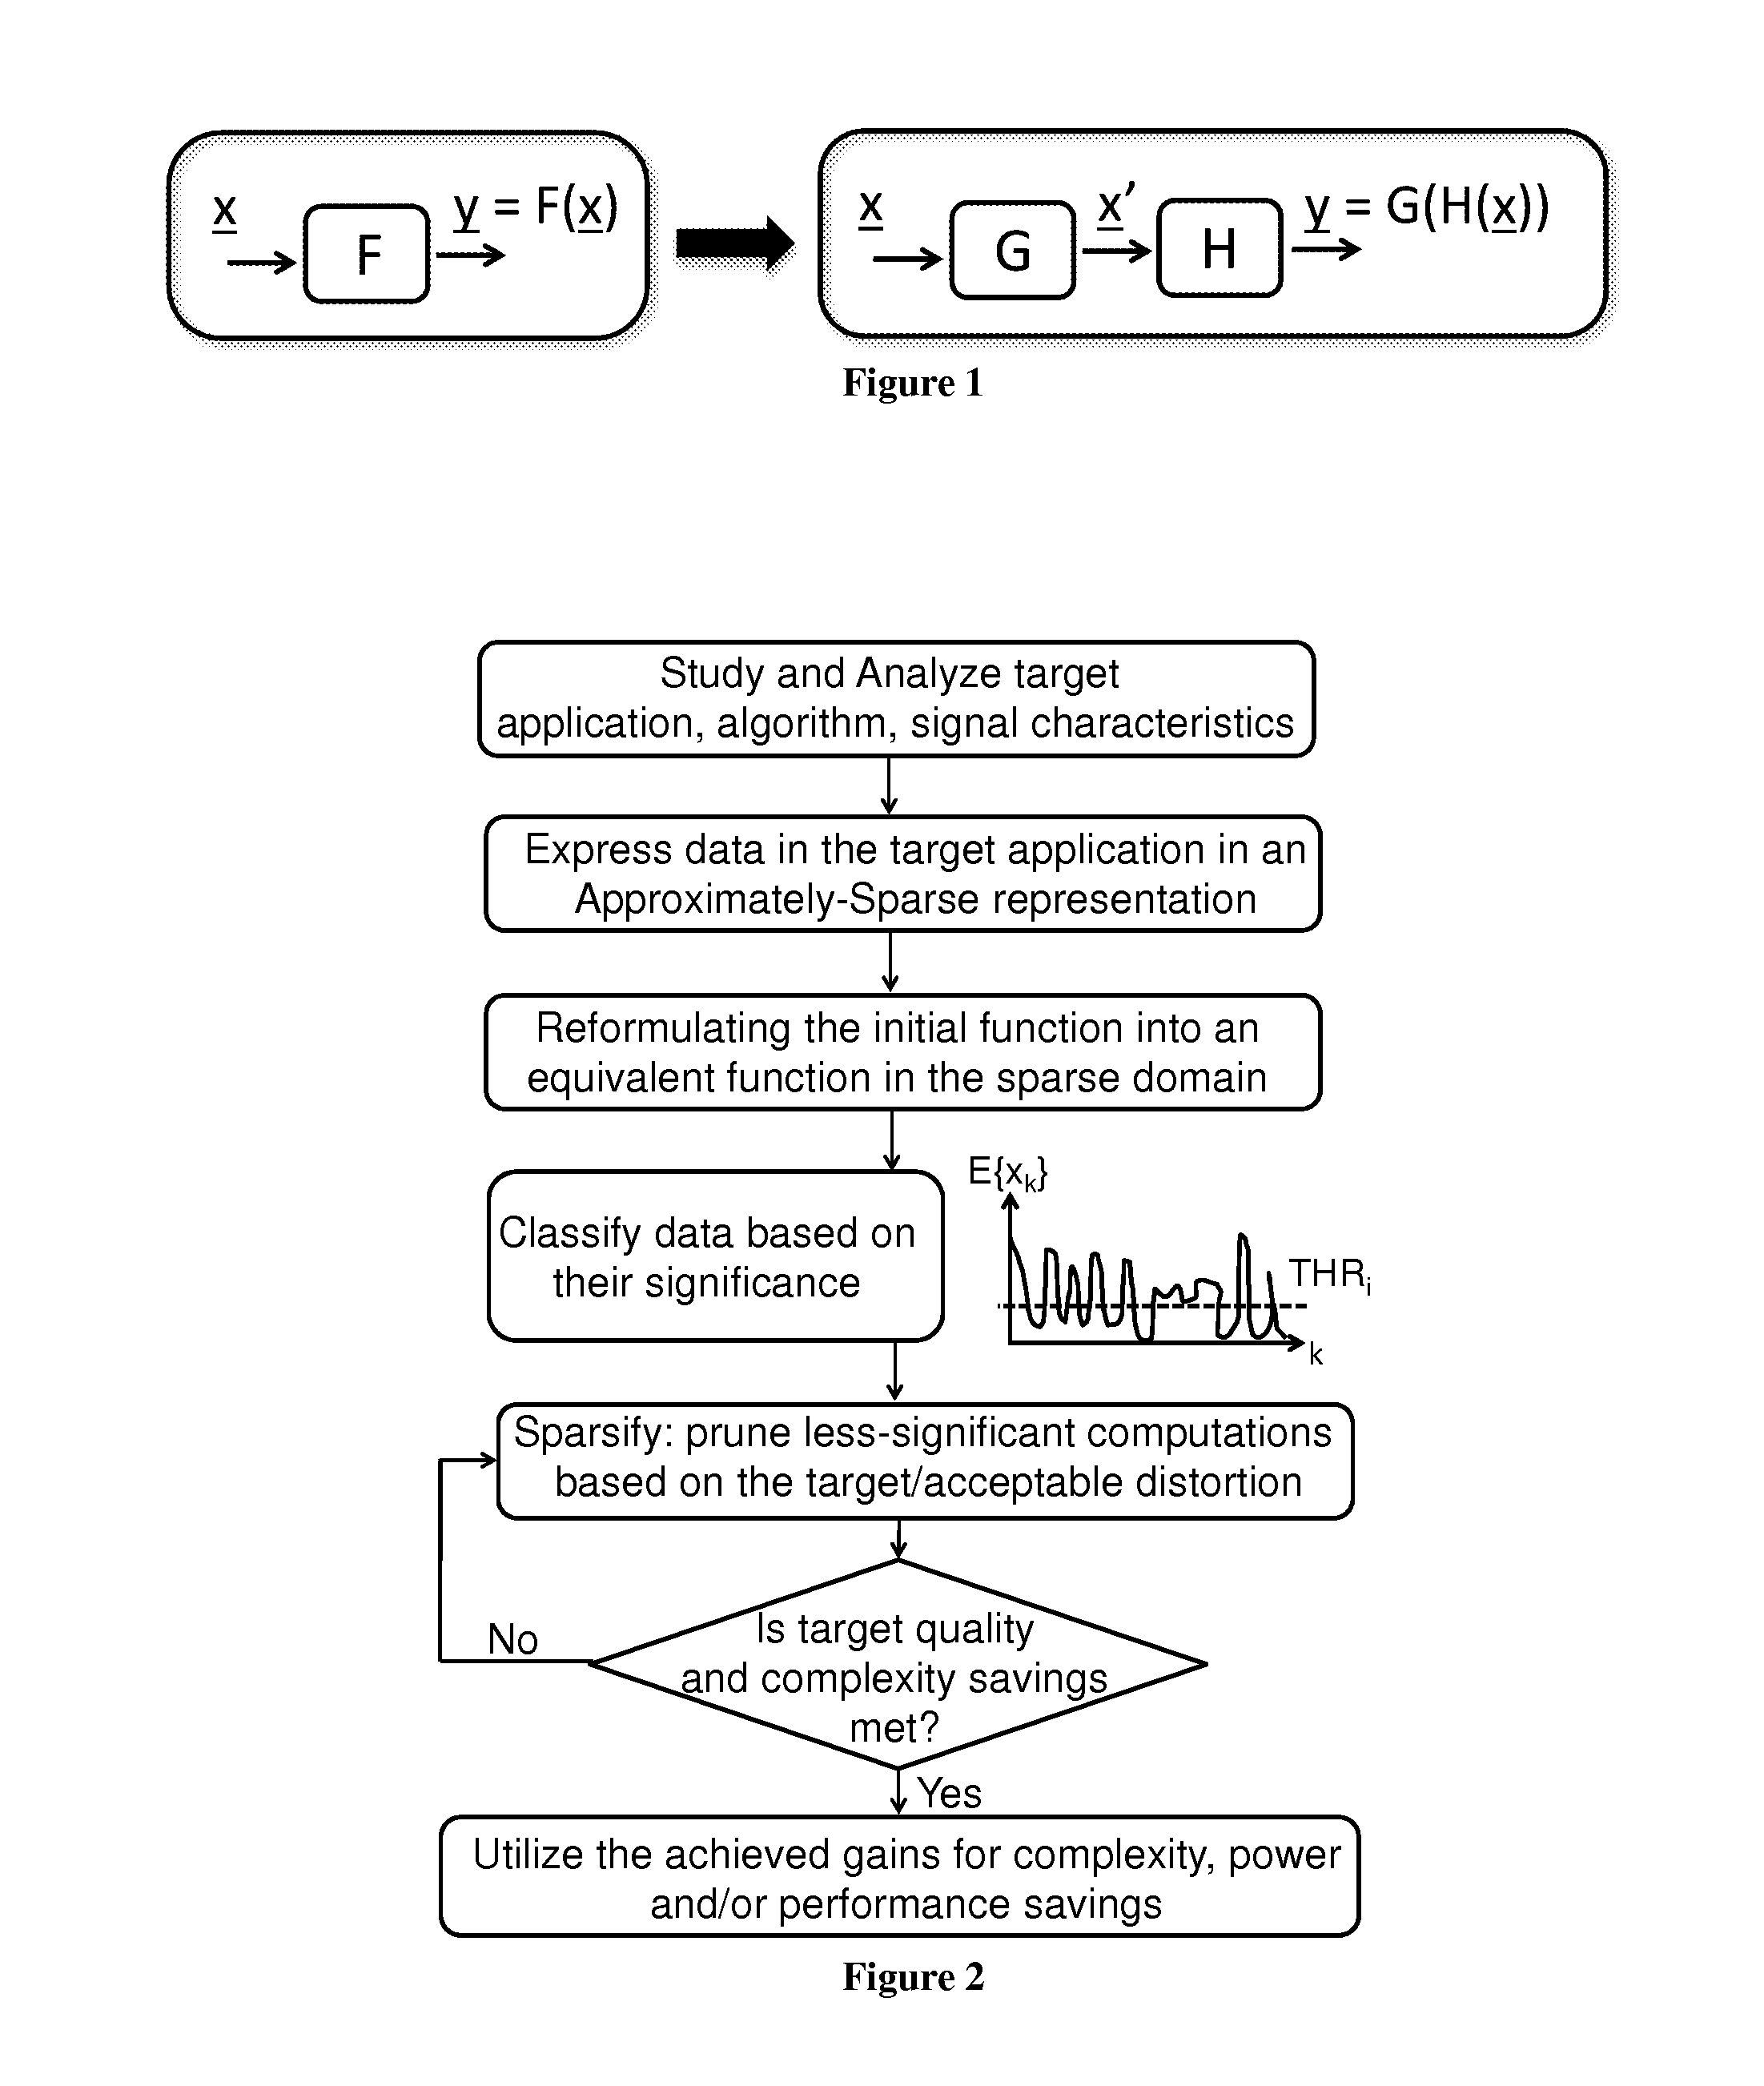
[0124]The main idea of the proposed approach is illustrated in FIG. 1. Starting from a function F and a signal x the objective is to find a function G that transforms the input signal x to a new, equivalent representation x′, where the signal is approximately-sparse. By approximately-sparse we mean that in the new signal x′ only few signal components carry most of its energy. Therefore these few components are also most important for the overall signal quality, while other signal components and the associated computations can often be skipped for a significant complexity reduction. In other words, the transformation G not only exposes the unequal significance of different signal components bu...


PUM


Abstract

A method and device for reducing the computational complexity of a processing algorithm, of a discrete signal, in particular of the spectral estimation and analysis of bio-signals, with minimum or no quality loss, which comprises steps of (a) choosing a domain, such that transforming the signal to the chosen domain results to an approximately sparse representation, wherein at least part of the output data vector has zero or low magnitude elements; (b) converting the original signal in the domain chosen in step (a) through a mathematical transform consisting of arithmetic operations resulting in a vector of output data; (c) reformulating the processing algorithm of the original signal in the original domain into a modified algorithm consisting of equivalent arithmetic operations in the domain chosen in step (a) to yield the expected result with the expected quality quantified in terms of a suitable application metric; (d) combining the mathematical transform of step (b) and the equivalent mathematical operations introduced in step (c) for obtaining the expected result within the original domain with the expected quality; (e) selecting a threshold value based on the difference in the mean magnitude value of the elements of the output data vector of the transform said in step (b) and the preferred complexity reduction and degree of output quality loss that can be tolerated in the expected result within the target application; (f) pruning a number of elements the magnitude of which is less than the threshold value selected in step (e); and/or eliminating arithmetic operations associated with the pruned elements of step (f) either in the mathematical transform of step (b) and/or in the equivalent algorithm of step (c).

Description

0 TECHNICAL FIELD[0001]The present invention relates generally to the analysis of signals and more specifically, to the field of power spectral analysis of bio-signals.1 BACKGROUND[0002]Power spectrum density (PSD) is a positive real function of a frequency variable associated with a stationary stochastic process describing how the power of a signal or time series is distributed with frequency [1]. The analysis of PSD known as Power Spectral Analysis (PSA) provides a non-invasive means of accessing the physiological and pathological status of a person and is becoming a ubiquitous tool in the diagnosis, prediction and monitoring of various cardiac and brain malfunctions [2-6]. Usually the total low frequency power (LFP) between 0.04 and 0.15 Hz and the total high frequency power (LFP) between 0.15 and 0.4 Hz of cardiac spectra along with their ratio (HFP:LFP) are used as quantitative indicators of various cardiac diseases (i.e., episodic hypertension, sinus tachycardia, bradyarrhythm...

Claims


Application Information

Patent Timeline
Patent Type & Authority Applications(United States)
IPC IPC(8): G06F17/14G06F17/16
CPCA61B5/726A61B5/02405G06F17/141G06F17/16A61B5/7257A61B5/7253G06F17/142G06F17/148
Inventor KARAKONSTANTIS, GEORGIOSSANKARANARAYANAN, AVIINAASHBURG, ANDREASMURALI, SRINIVASANATIENZA ALONSO, DAVID
Owner ECOLE POLYTECHNIQUE FEDERALE DE LAUSANNE (EPFL)
Why Eureka
Try Eureka