Visualization of nucleic acid sequences

a nucleic acid sequence and visualization technology, applied in the field of computer-aided analysis of bioinformatics data, can solve the problems of difficult sequence analysis, burdensome sequence analysis task, and difficult analysis of the resulting sequence, so as to improve the quality of sequencing data

Inactive Publication Date: 2015-11-19
ZHENG DALI
View PDF0 Cites 0 Cited by
  • Summary
  • Abstract
  • Description
  • Claims
  • Application Information

AI Technical Summary

Benefits of technology

[0010]The methods provided herein allow ready analyses of a large amount of sequence information. By visually displaying the nucleotide sequence data in the form of curves (“sequence spectra”), one can readily identify characteristic curve patterns (such as peaks and / or peak clusters) that correspond to a particular nucleotide sequence, i.e., a sequence of particular nucleotide combination. By way of example, the rise of the curve in some embodiments correlates (and reflects) the density of AG contained within the nucleotide sequence. The fall of the curve in some embodiments correlates (and reflects) the density of TC contained within the nucleotide sequence. The sequence spectra thus in some embodiments allow one to visually determine the relative AG or TC contents within a specific portion of the nucleotide sequence. These curve patterns can be further labeled or annotated, showing a featured sequence map (e.g. gene, tRNA, rRNA, Alu, repeat sequences, SNP, Methylation etc. Distribution Map) on top of the sequence spectra to provide more informative display. The present application further provides methods of associating one or more portions of the sequence spectrum with a name (i.e., naming a portion of the sequence spectrum), for example for easy identification of a portion of the nucleotide sequence having a characteristic sequence pattern.
[0011]The methods provided herein also allow ready identification of sequence similarities among large chunks of nucleotide sequences (for example different chromosomes). By comparing the different sequence spectra and searching for curve patterns with same or similar shapes, one can readily identify regions within different nucleotide sequences that share sequence similarities. This makes it possible to readily compare different sets of nucleotide sequences especially nucleotide sequences of large sizes, for example, chromosomal sequences, and identify sequence similarities among those sequences.
[0012]The methods provided herein can also be used to find large chunks of sequence repeats within a given nucleotide sequence, for example by comparing different portions of the same sequence spectrum. This allows one to readily identify repeat sequences within a given nucleotide sequence. This also allows one to conduct quality control for a sequencing project (for example a genome sequencing project) which involves assembly of a large amount of sequence information. By determining the occurrence and frequency of artificial sequence repeats within a single nucleotide sequence, one would be able to assess the occurrence and frequency of sequence artifacts during the sequencing project and evaluate the quality of the sequencing data.

Problems solved by technology

While processes have been developed to sequence DNA, analysis of the resulting sequences is difficult due to the nature of data contained within a DNA sequence.
For example, it is difficult for a scientist to view a long chain of A, T, C, and G nucleotides and extract the information that it represents.
Additionally, the large volume of data contained within a DNA sequence makes the sequence analysis a burdensome task.
Analysis of data of this magnitude is extremely difficult and time-consuming.
And even more difficult is that there is currently no effective way if observing and comparing different species on macroscopic DNA sequence analysis level.

Method used


Image

  • Visualization of nucleic acid sequences
  • Visualization of nucleic acid sequences
  • Visualization of nucleic acid sequences

Examples


Embodiment Construction

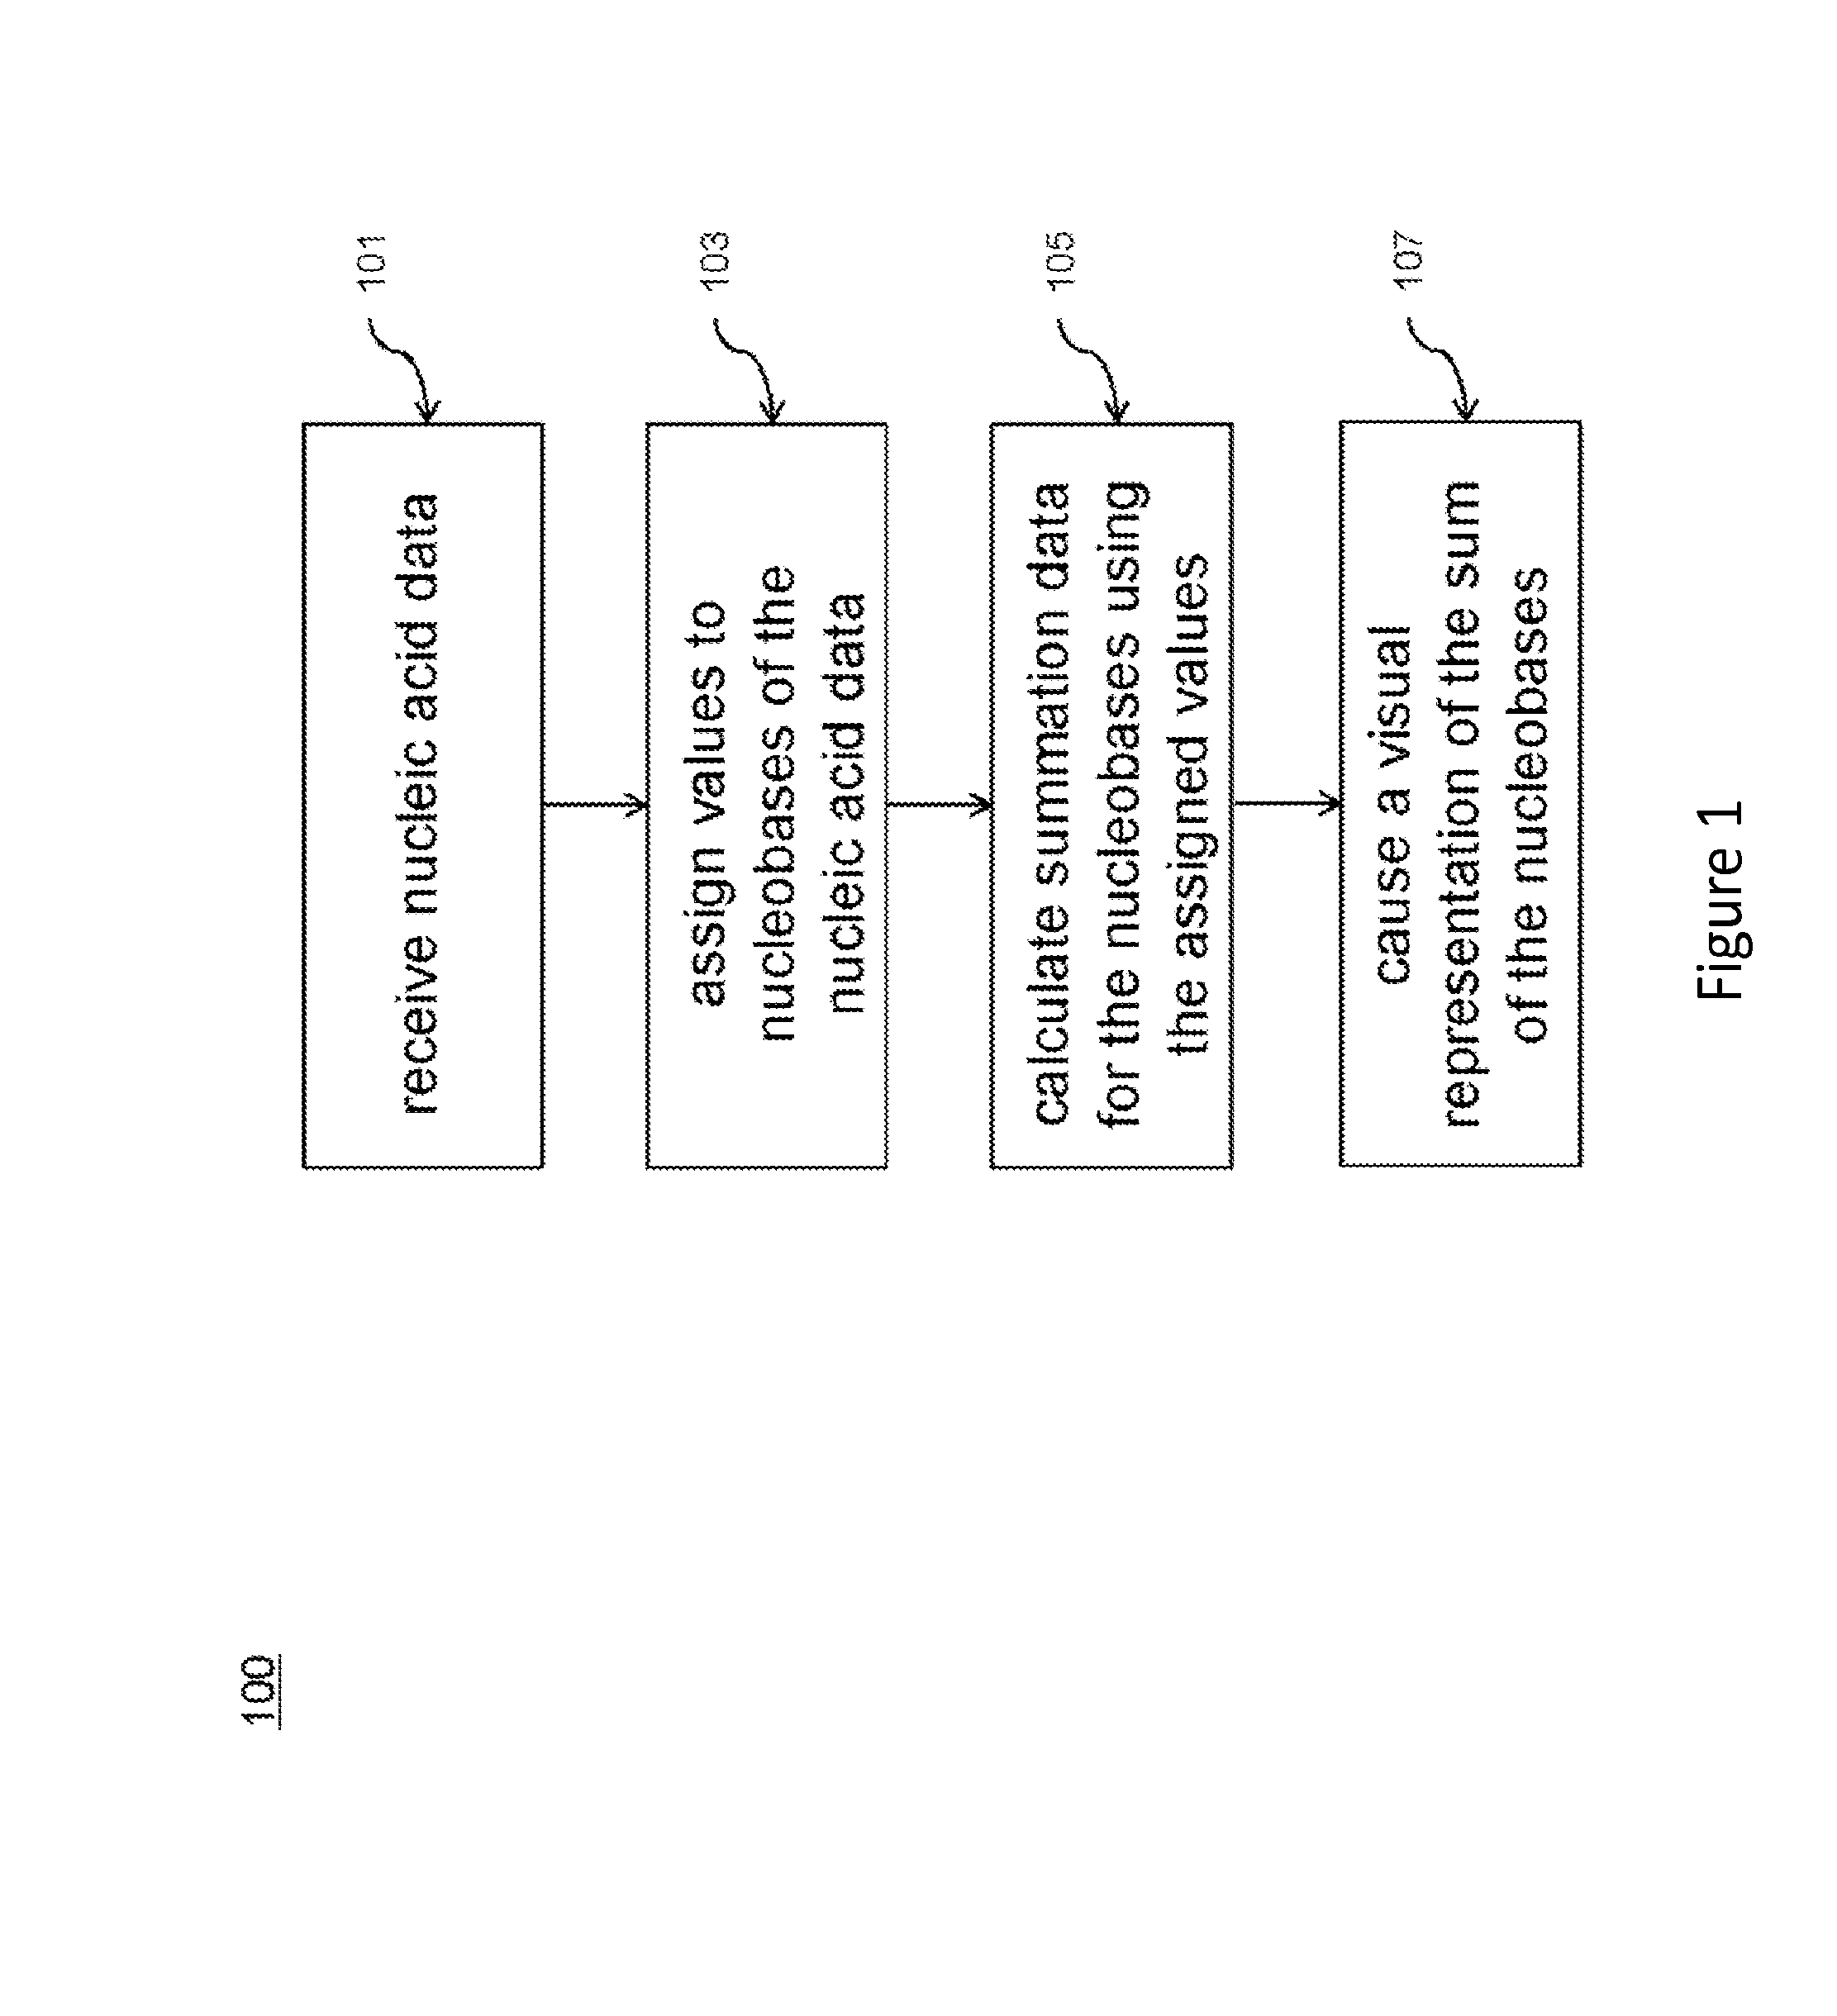
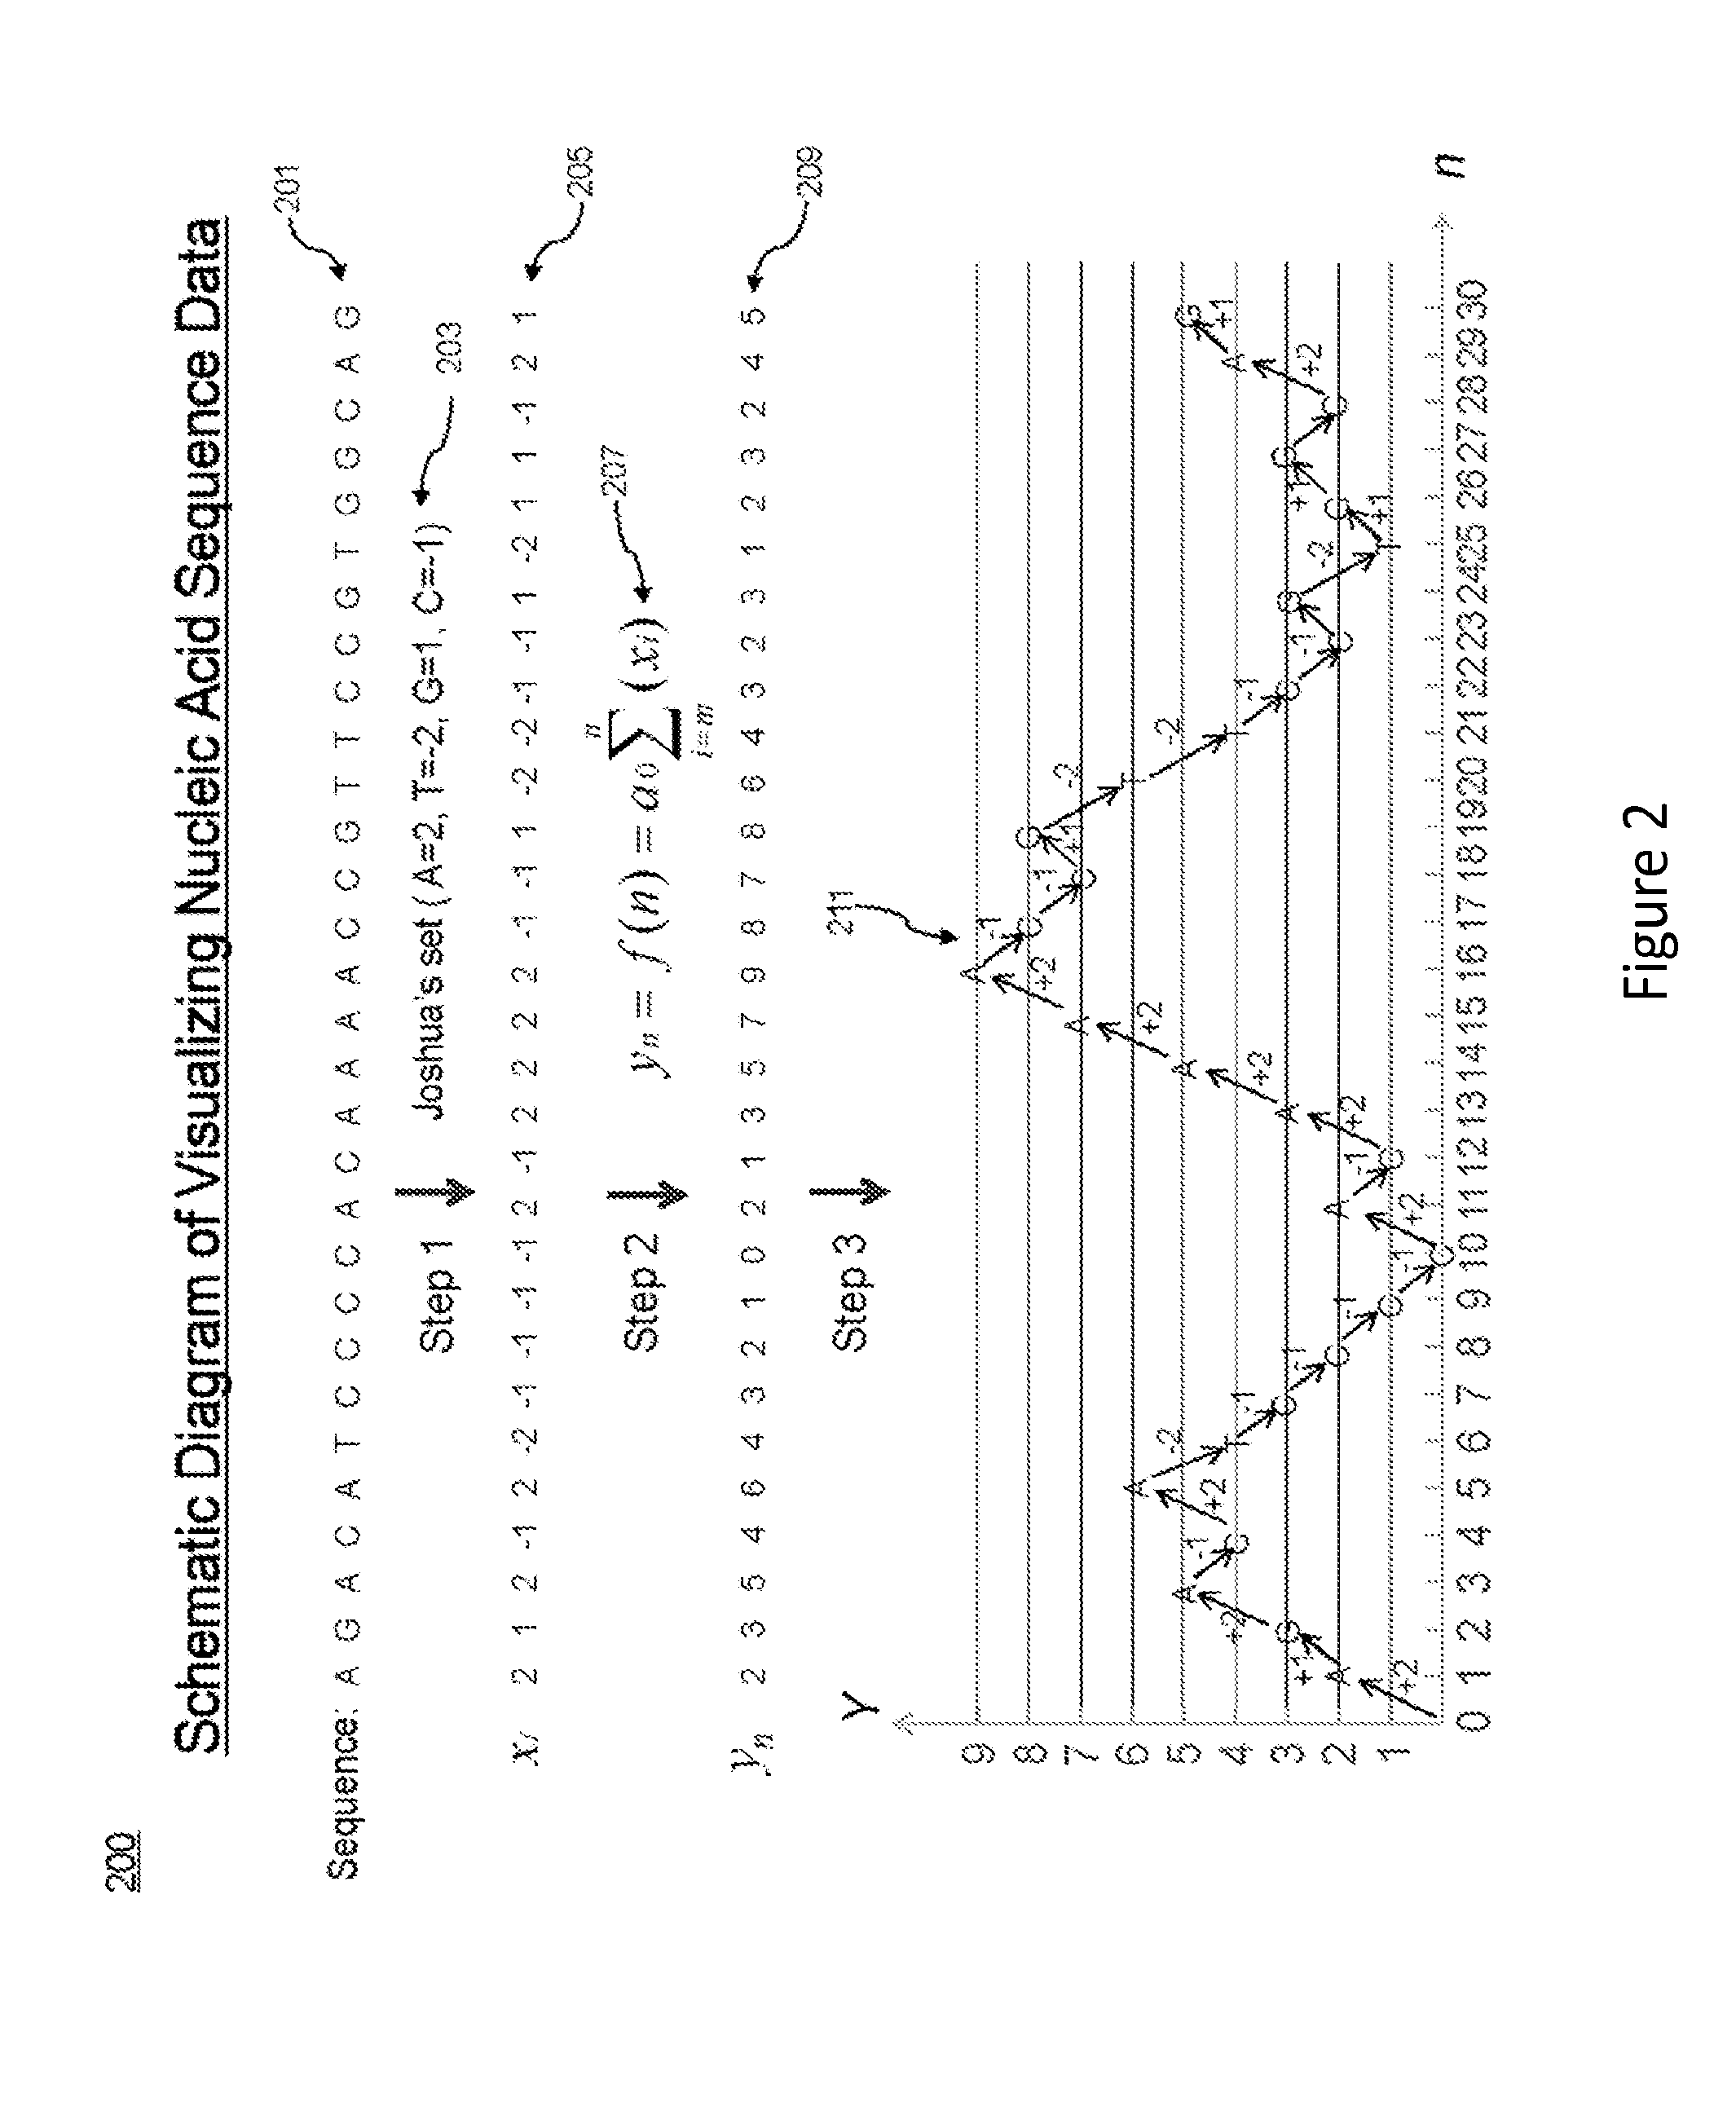
[0036]The present application provides methods (such as computer-implemented methods, including systems and processes) for analyzing nucleic acid data. An exemplary method includes receiving a nucleotide sequence. Individual nucleobases within the nucleotide sequence are assigned numerical values. Using these assigned values, sums can be calculated for each position within the nucleotide sequence. The resulting sums can then be displayed in various ways, for example in the form of curves (also termed as “sequence spectra”).

[0037]The methods provided herein allow ready analyses of a large amount of sequence information. By visually displaying the nucleotide sequence data in the form of curves (“sequence spectra”), one can readily identify characteristic curve patterns (such as peaks and / or peak clusters) that correspond to a particular nucleotide sequence, i.e., a sequence of particular nucleotide combination. By way of example, the rise of the curve in some embodiments correlates (a...


PUM


Abstract

A system and process are provided for analyzing nucleic acid data. An example process can include receiving nucleic acid data including a set of sequence data. The nucleotides of the sequence data can be assigned numerical values. Using these assigned values, partial sums can be calculated for each position in the set of sequence data. The resulting sums can then be displayed in form of Charts or Maps which is so called sequence spectrum to make it easy to navigate and analyze the whole data set. In some examples, patterns or similar/identical sequence segments can be identified within a single set of sequence data or between different sets of sequence data in the spectrum.

Description

[0001]This application claims the benefit of and priority to U.S. Provisional Application Ser. No. 61 / 757,007, filed Jan. 25, 2013, the disclosure of which is hereby incorporated by reference in its entirety.BACKGROUND[0002]1. Field[0003]This disclosure relates generally to computer-aided analysis of bioinformatics data and, more specifically, to computer-aided analysis of nucleic acid sequences.[0004]2. Related Art[0005]Deoxyribonucleic acid (DNA) molecule contains the genetic code used in the development and functioning of living organisms. These instructions are encoded in two anti-parallel strands of nucleotides that make up the DNA molecule. Specifically, the instructions are stored in the nucleotides as a chain of four different nucleotides (adenine (A), cytosine (C), guanine (G), and thymine (T)). The specific sequence of the nucleotides defines all physical characteristics of the organism.[0006]To better understand how DNA sequences affect living organisms, a process called ...

Claims


Application Information

Patent Timeline
Patent Type & Authority Applications(United States)
IPC IPC(8): G06F19/26G16B45/00
CPCG06F19/26G16B45/00
Inventor ZHENG, DALI
Owner ZHENG DALI
Why Eureka
Try Eureka