Identifying visual storm signatures from satellite images

a satellite image and visual storm technology, applied in the field of weather prediction, can solve the problems of large differences in predictions, insufficient accuracy or reliability of long-term severe storm prediction, and significant damage every year worldwide, so as to eliminate false positives and improve the accuracy of prediction.

Active Publication Date: 2016-04-14
PENN STATE RES FOUND
View PDF2 Cites 38 Cited by
  • Summary
  • Abstract
  • Description
  • Claims
  • Application Information

AI Technical Summary

Benefits of technology

[0012]The extracted visual features and the historical meteorological data are used to identify candidate storm cells. As such, machine learning techniques are preferably used to classify the candidate cells into storm and stormless cells, using only candidates classified as storm cells to predict storms so as to eliminate “false positives.” Other meteorological data and / or prediction models, and / or expert opinions, may be integrated into the system to improve the accuracy of the prediction.

Problems solved by technology

Extreme weather events, such as thunderstorms, hails, hurricanes, and tornadoes, cause a significant amount of damage every year worldwide.
Though meteorologists dedicate to making accurate weather forecasts with advanced computational technologies, the long-term prediction of severe storms is still not sufficiently accurate or reliable.
Due to the nonlinear and chaotic nature of numerical models, some tiny noises in the initial values can result in large differences in the predictions.
As a result, although nowadays powerful computers are used to run complex numerical models, it is difficult to get accurate predictions, especially in mid-to-long-teini forecasting.
However a major drawback of such methods is that they do not interpret the data from a global point of view at a high cognitive level.
Numerical methods do not capture such high-level clues.
Additionally, historical weather records provide valuable references for making weather forecasts, but numerical methods do not make good use of them.

Method used


Image

  • Identifying visual storm signatures from satellite images
  • Identifying visual storm signatures from satellite images
  • Identifying visual storm signatures from satellite images

Examples


case study

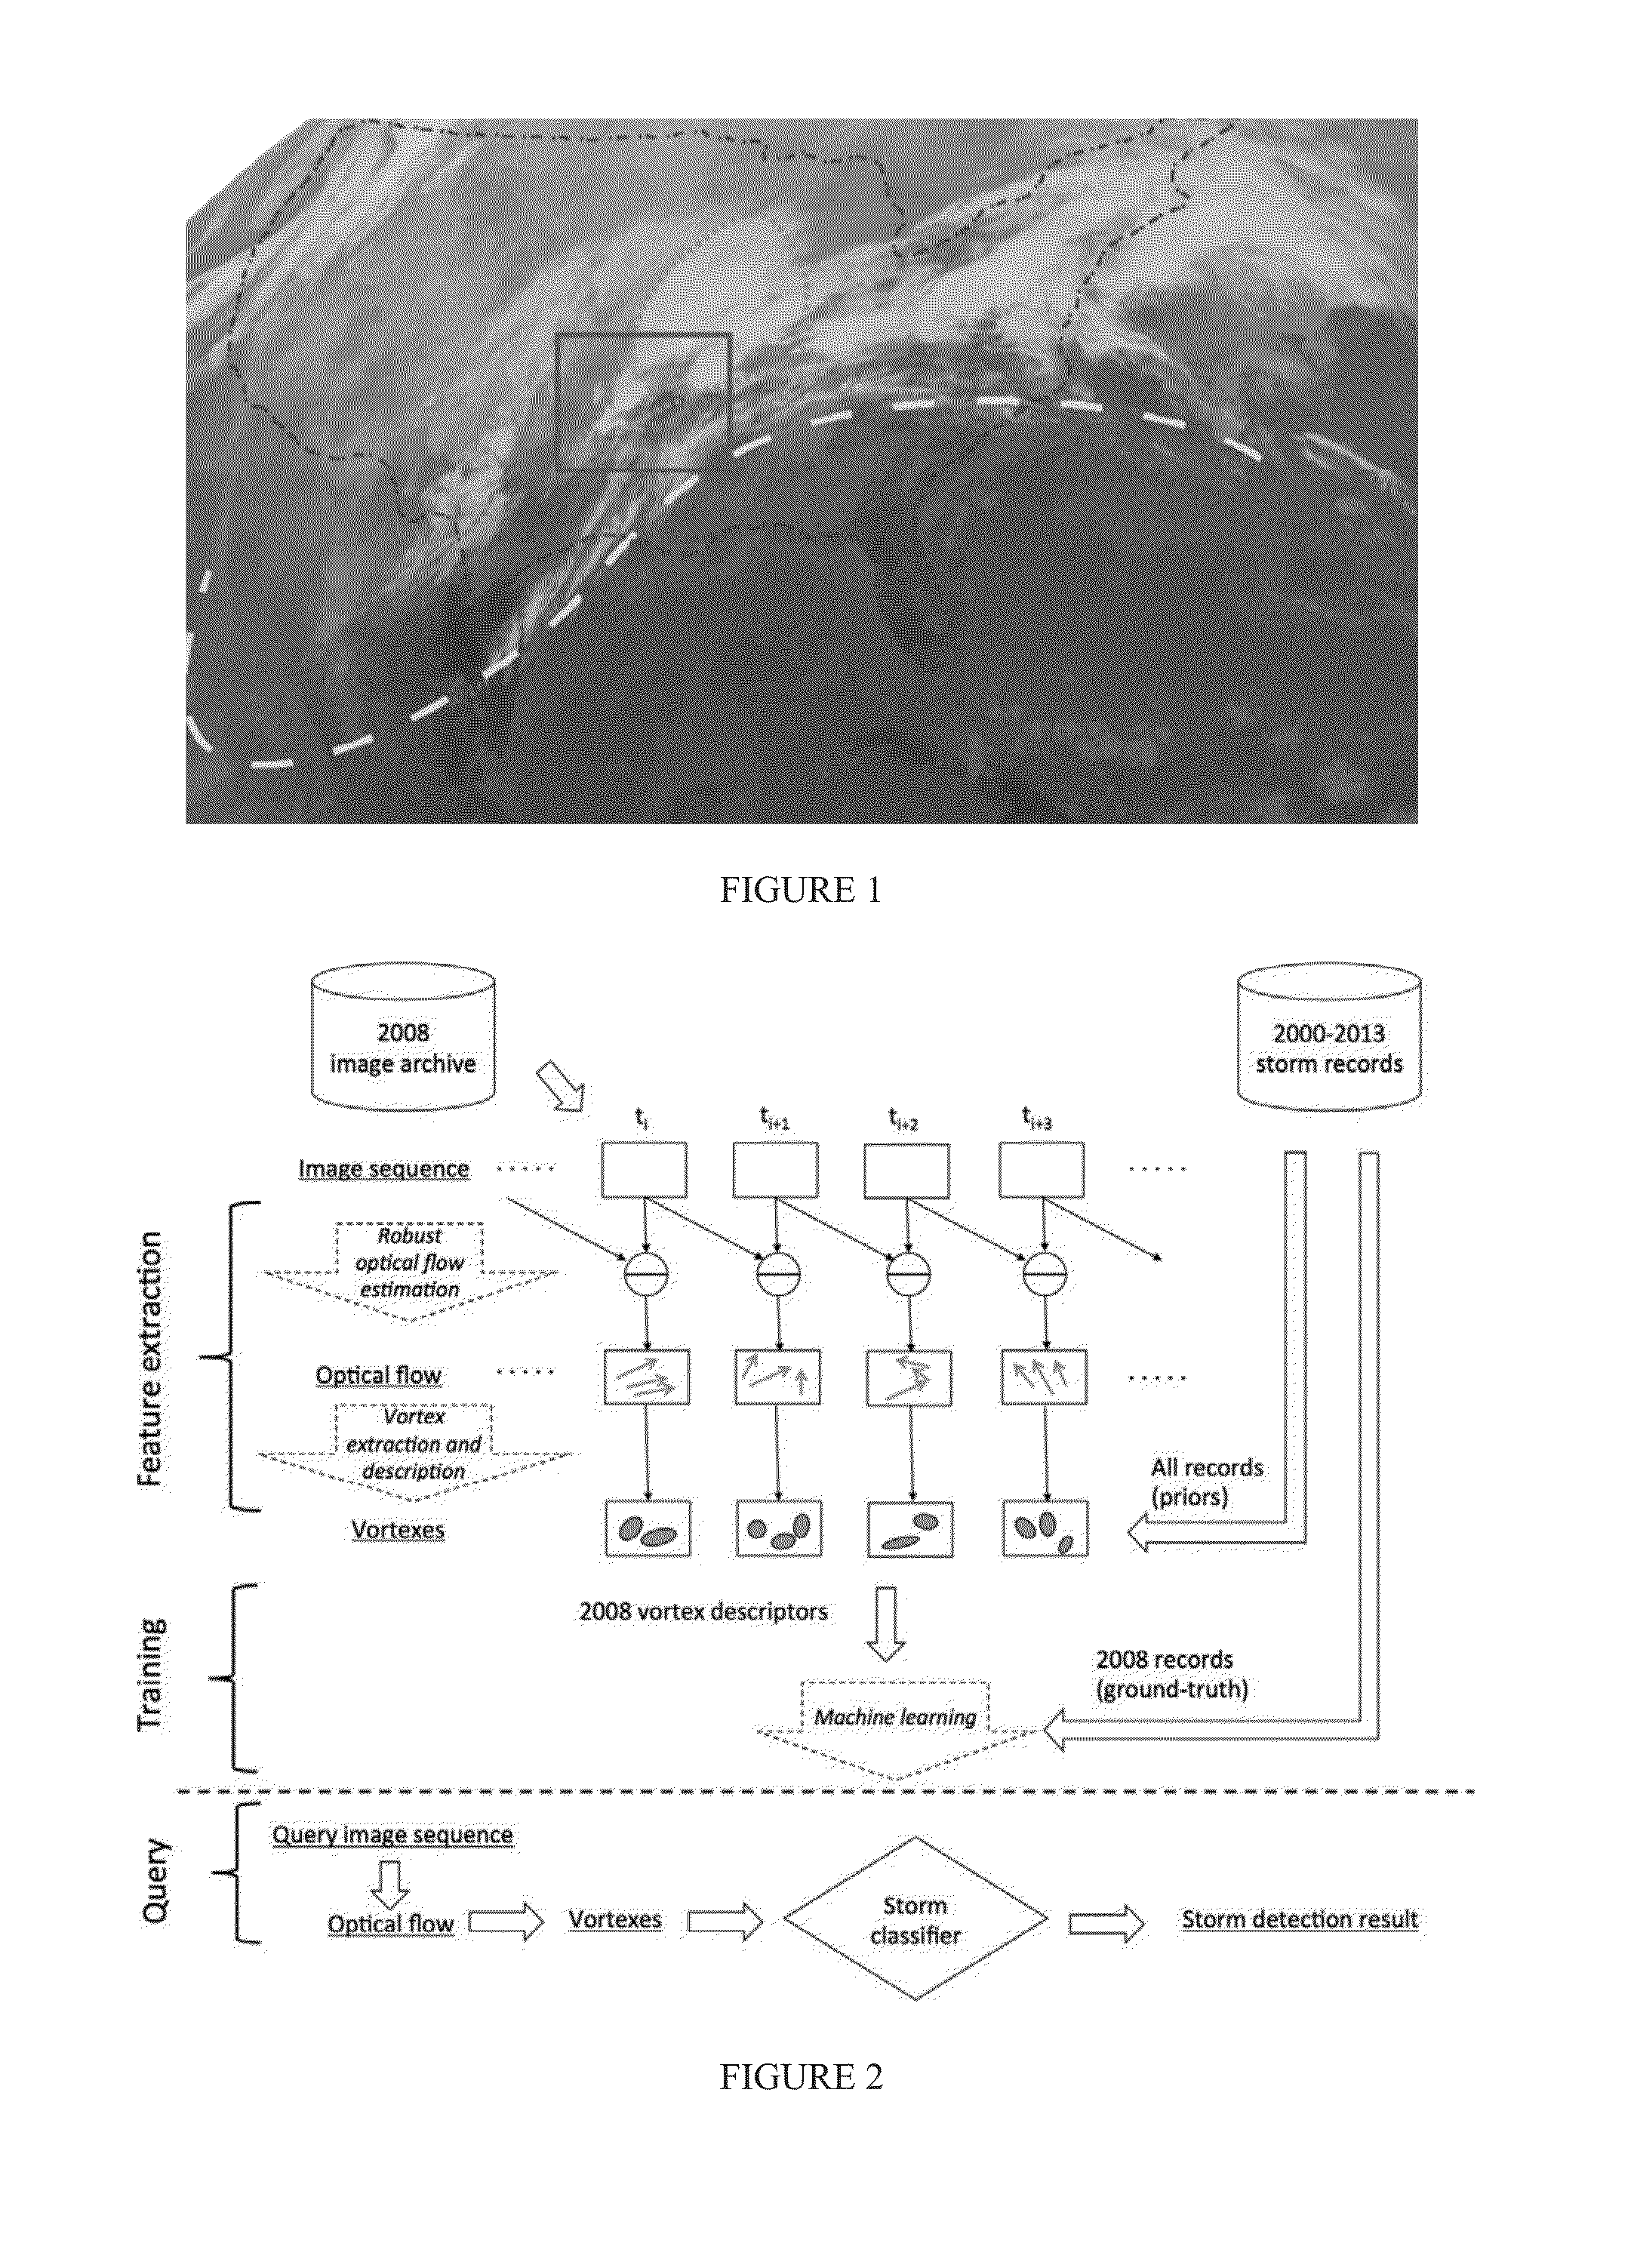
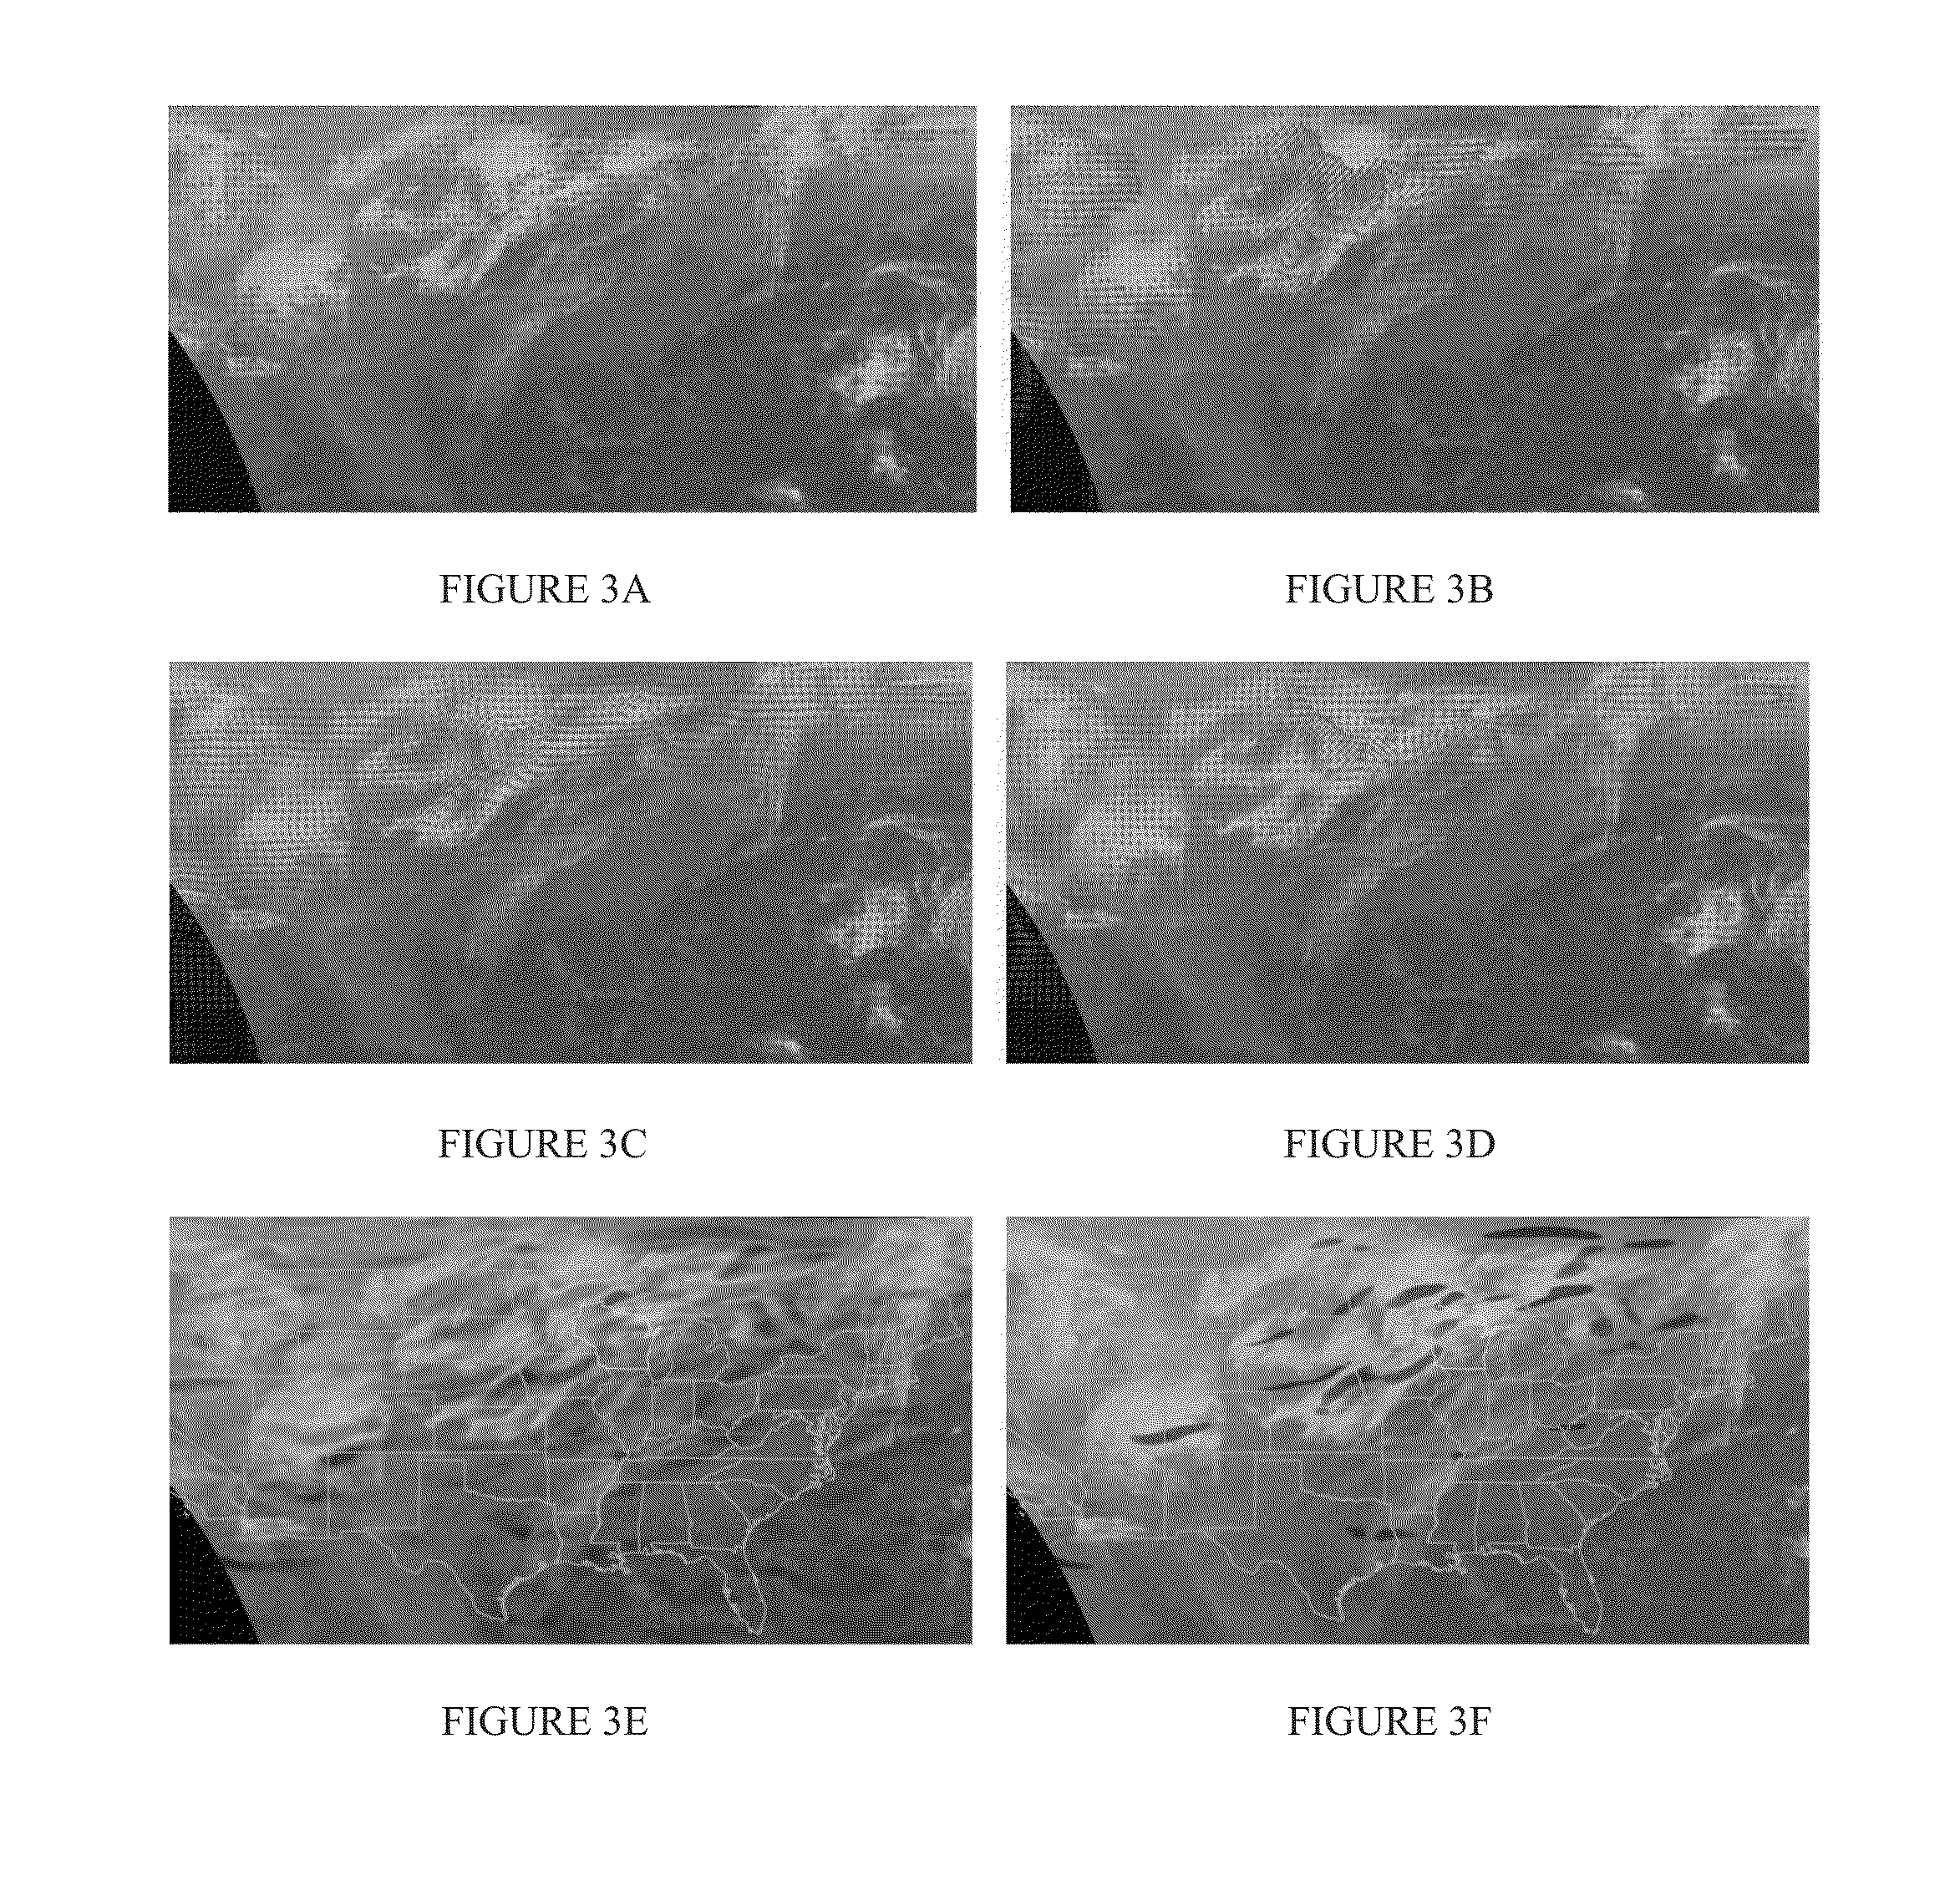
[0064]Using the vortex core extraction algorithm introduced in Section II and the classifier trained above, we can automate the process of storm detection from satellite image sequences. Here we present three case studies to show the effectiveness of this approach in different scenarios.

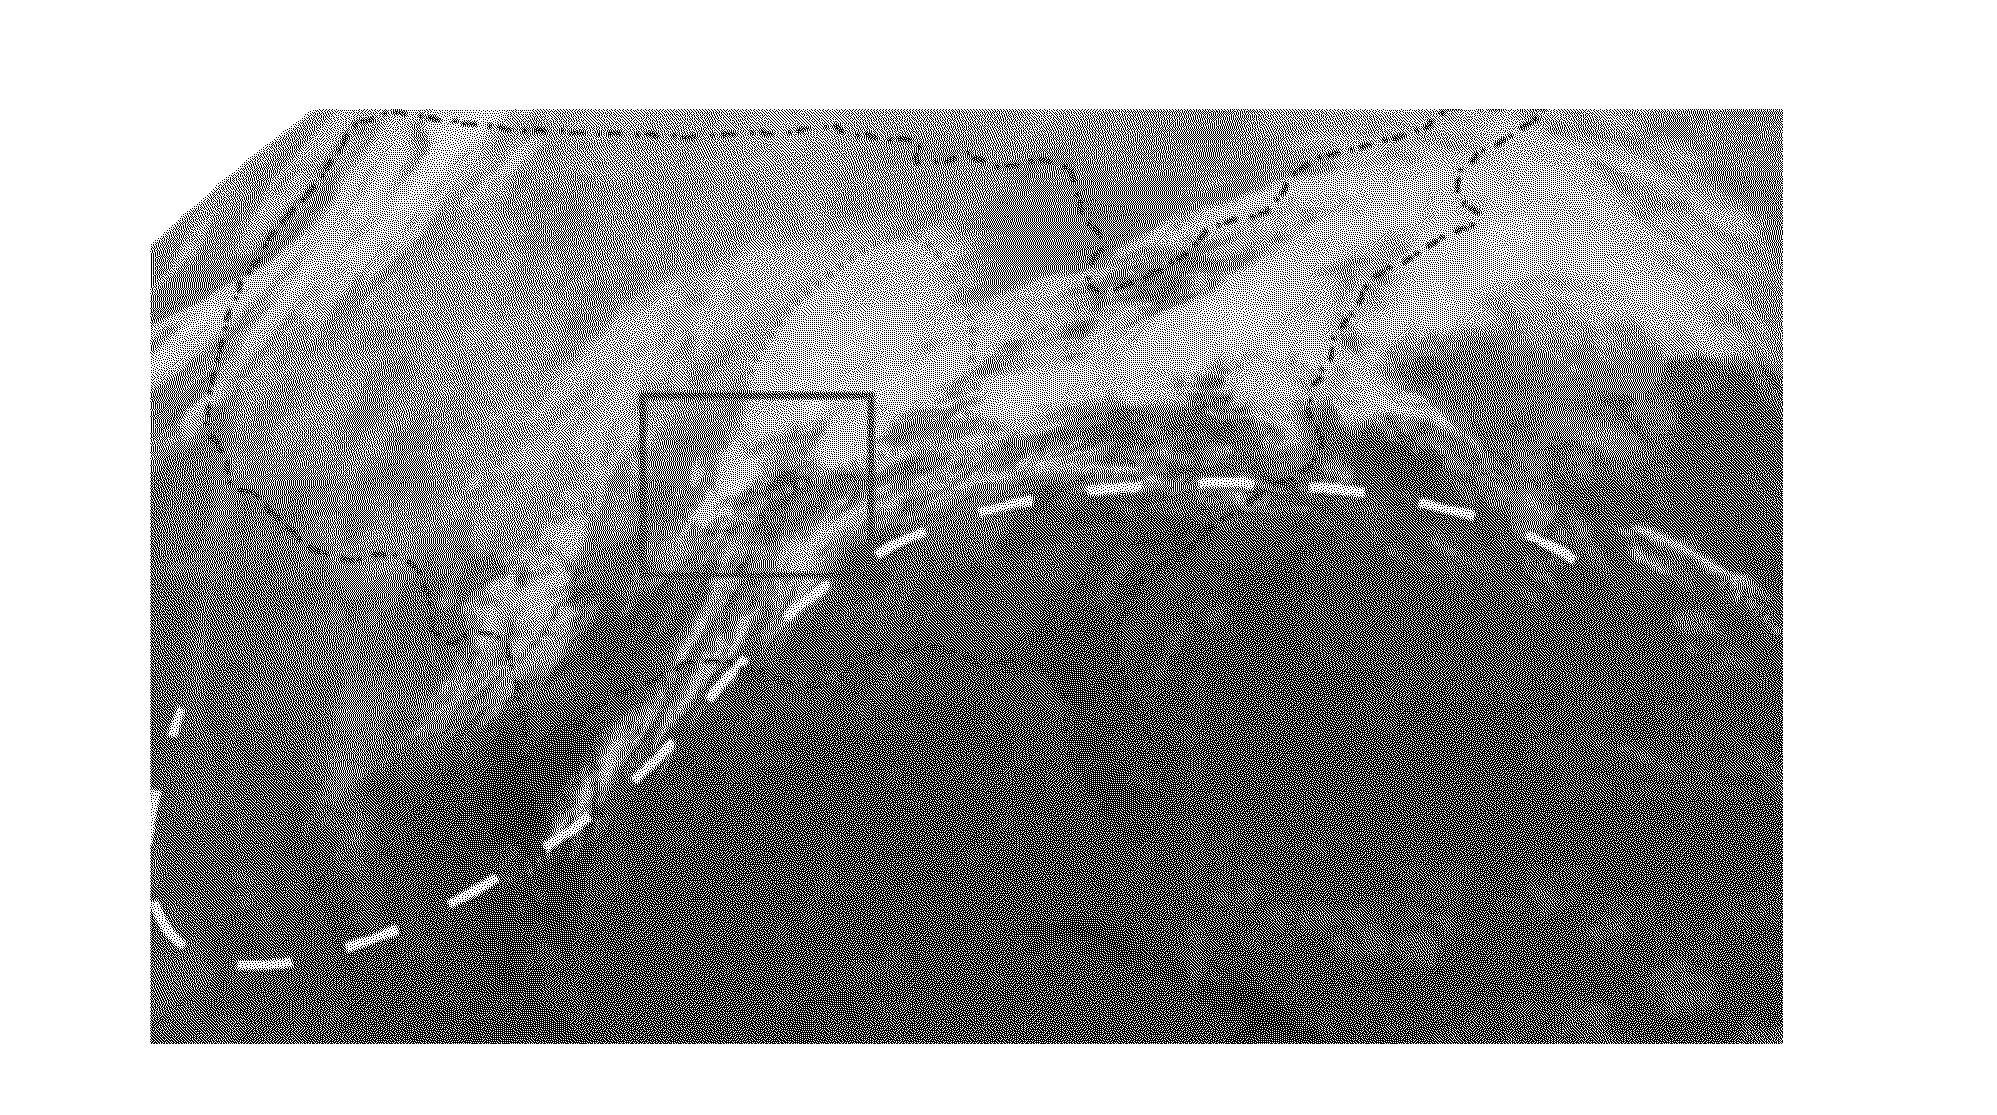
[0065]We choose satellite image sequences from three dates for case studies10. For all cases, the first three consecutive frames of storm detection results are shown in FIG. 5A-5I. The results are consistent along the following frames in all cases, hence these three frames are sufficient to demonstrate the result for each case. On the displayed images, detected storm systems are filled in red or green color (based on the vorticity vectors' directions). Those vortex regions which are detected from the images but classified as negative samples are not filled in color but stroked in blue lines. 10All dates are not used for training the classifier

[0066]The first example shown in FIGS. 5A-5C was from Jun....


PUM


Abstract

Satellite images from vast historical archives are analyzed to predict severe storms. We extract and summarize important visual storm evidence from satellite image sequences in a way similar to how meteorologists interpret these images. The method extracts and fits local cloud motions from image sequences to model the storm-related cloud patches. Image data of an entire year are adopted to train the model. The historical storm reports since the year 2000 are used as the ground-truth and statistical priors in the modeling process. Experiments demonstrate the usefulness and potential of the algorithm for producing improved storm forecasts. A preferred method applies cloud motion estimation in image sequences. This aspect of the invention is important because it extracts and models certain patterns of cloud motion, in addition to capturing the cloud displacement.

Description

REFERENCE TO RELATED APPLICATION[0001]This application claims priority to U.S. Provisional Patent Application Ser. No. 62 / 062,622, filed Oct. 10, 2014, the entire content of which is incorporated herein by reference.GOVERNMENT SUPPORT[0002]This invention was made with government support under Grant No. OCI1027854, awarded by the National Science Foundation. The Government has certain rights in the invention.FIELD OF THE INVENTION[0003]This invention relates generally to weather prediction and, in particular, to the prediction of severe storms based on the processing and analysis of current and past satellite image data.BACKGROUND OF THE INVENTION[0004]Extreme weather events, such as thunderstorms, hails, hurricanes, and tornadoes, cause a significant amount of damage every year worldwide. In the United States, it is reported by the National Climate Data Center (NCDC)1 that there are eleven extreme weather events with at least a billion dollars' loss in 2012, causing a total of 377 d...

Claims


Application Information

Patent Timeline
Patent Type & Authority Applications(United States)
IPC IPC(8): G06K9/66G06K9/46G06T7/20G06K9/00G06V20/13
CPCG06K9/66G06K9/0063G06T2207/10032G06T7/20G06T2207/30192G06K9/46G01W1/00G06V40/20G06V20/13
Inventor WANG, JAMES Z.ZHANG, YUWISTAR, STEPHENSTEINBERG, MICHAEL A.LI, JIA
Owner PENN STATE RES FOUND
Why Eureka
Try Eureka