Method of Predicting Risk for Type 1 Diabetes
a type 1 diabetes and risk prediction technology, applied in the field of molecular diagnostics, can solve the problems of breakdown of self-tolerance, difficult to predict the onset of clinical disease,
- Summary
- Abstract
- Description
- Claims
- Application Information
AI Technical Summary
Benefits of technology
Problems solved by technology
Method used
Image
Examples
example 1
Transcriptional Signatures in Children Genetically at-Risk of T1D
Methods
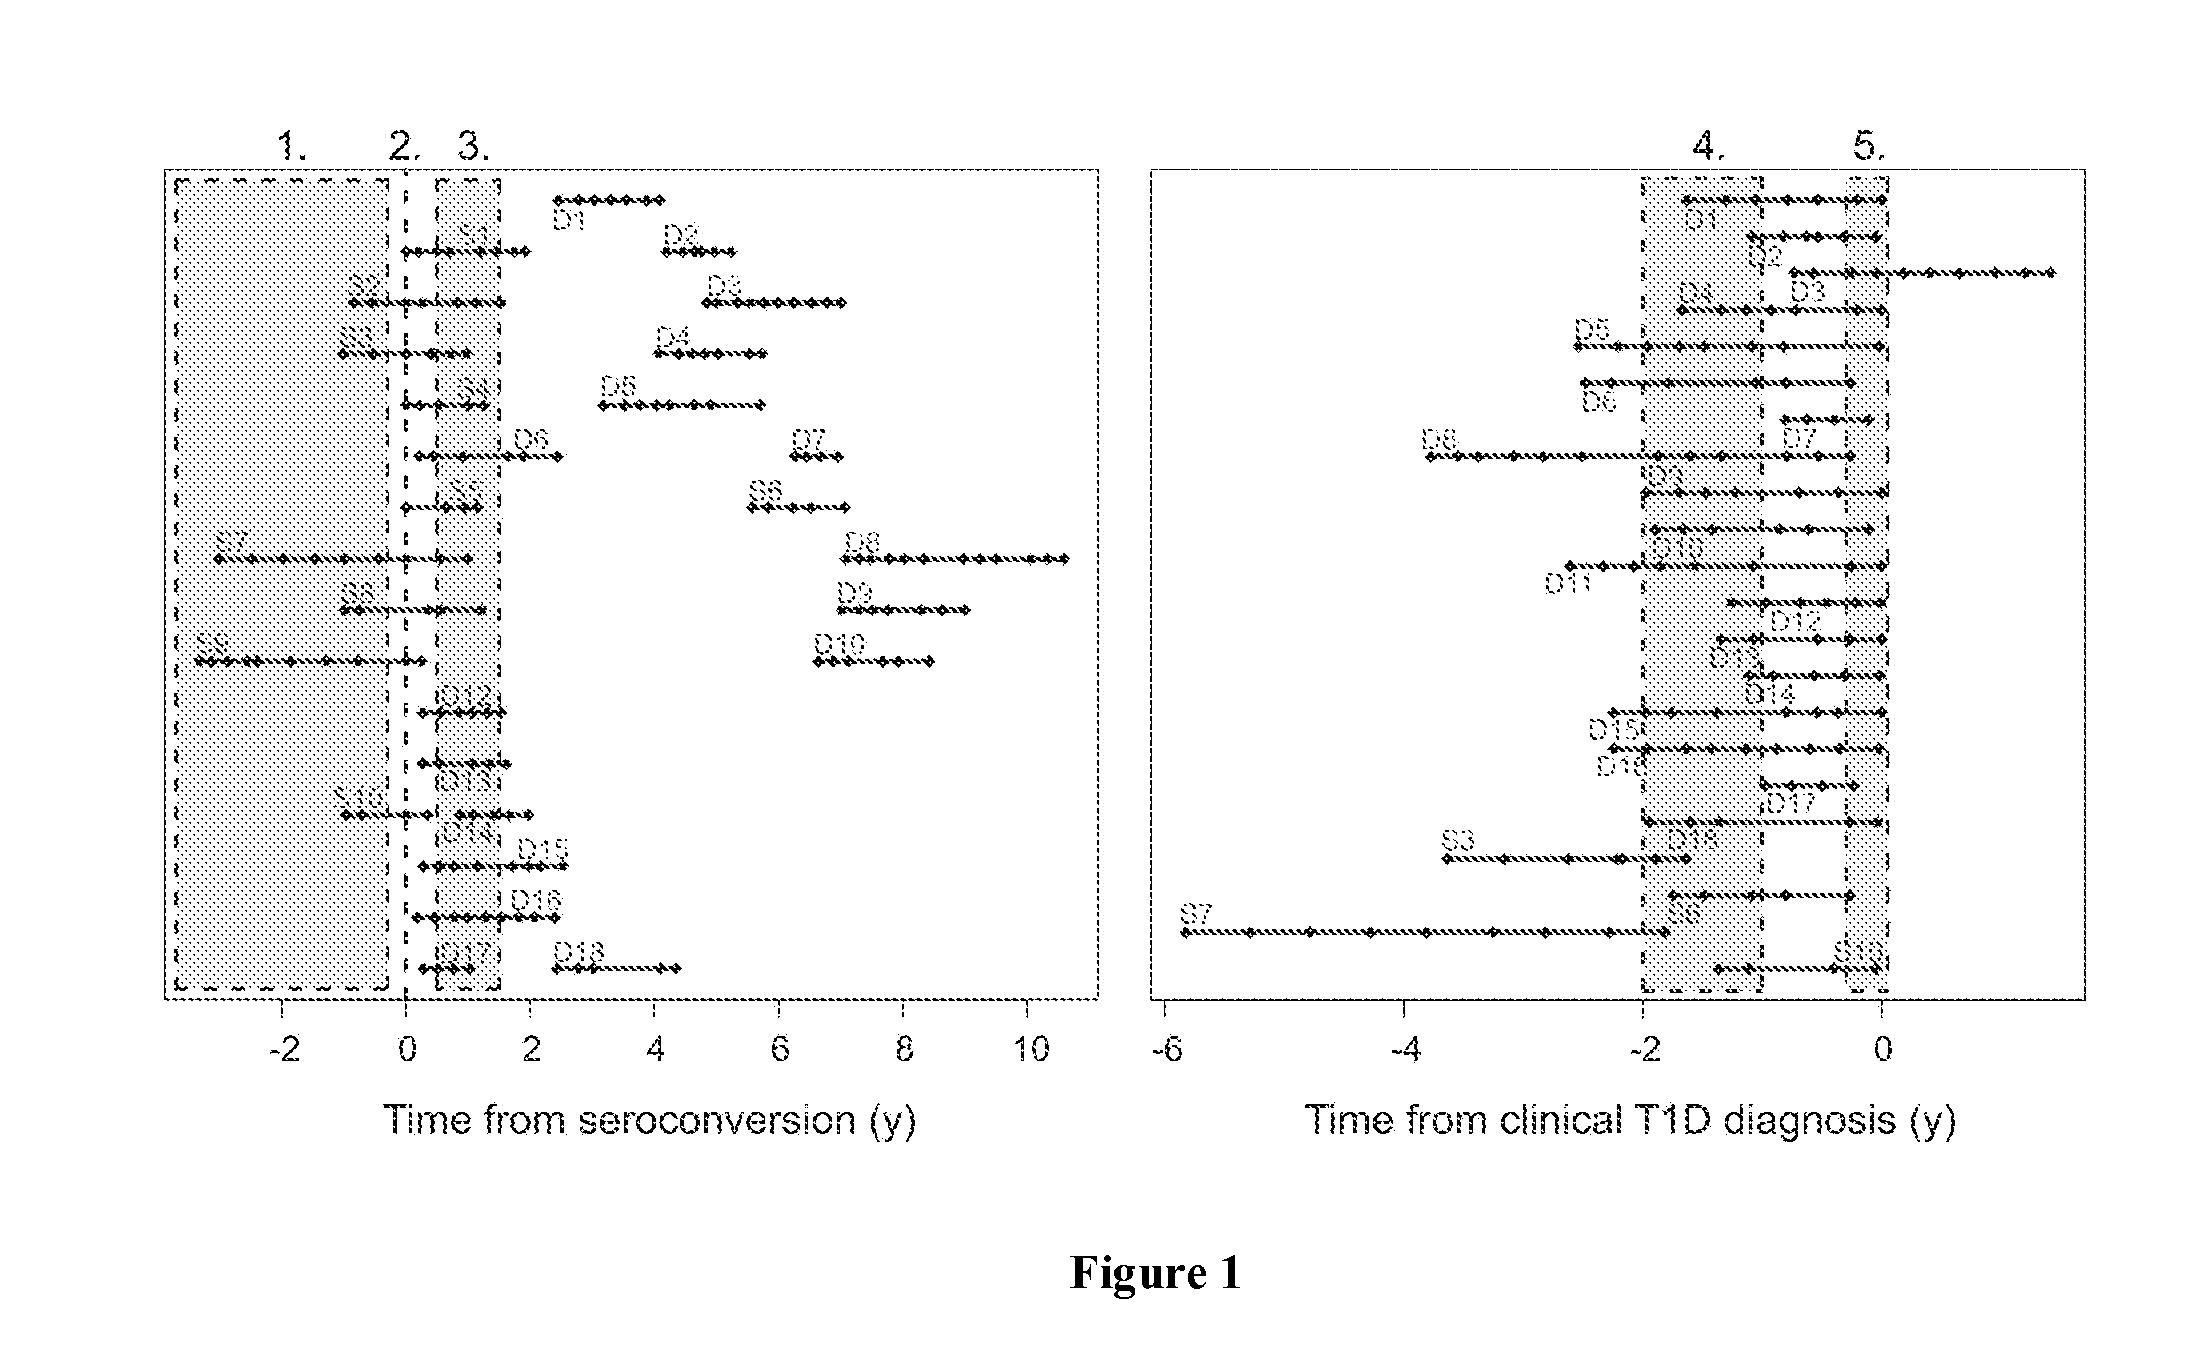
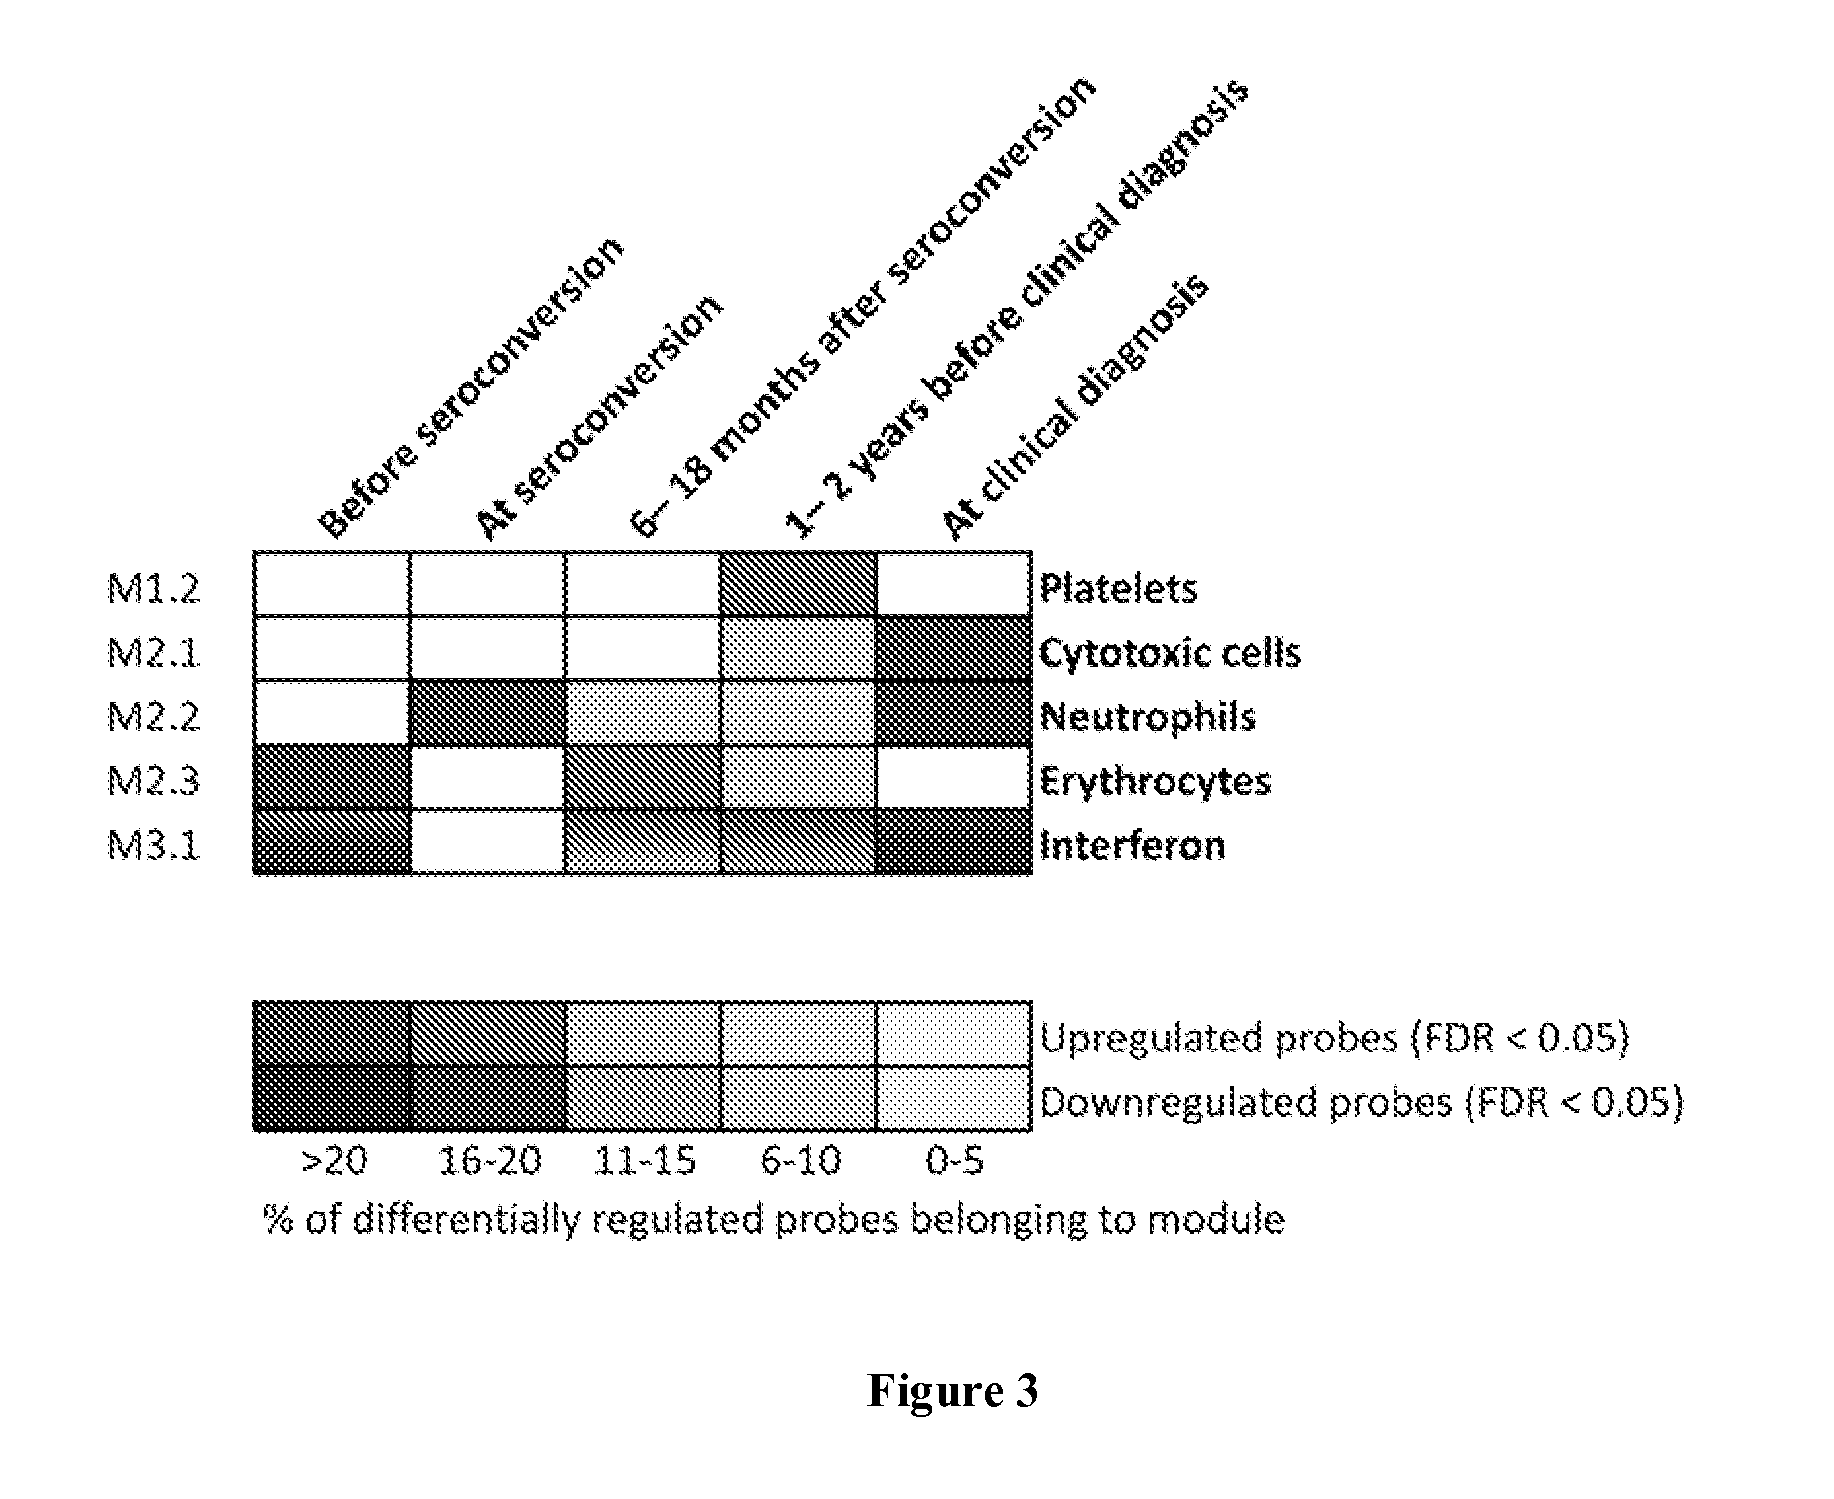
[0056]All children studied were participants in the Finnish Type 1 Diabetes Prediction and Prevention Project (DIPP). Subjects identified as at risk for T1D based on their HLA haplotype were followed prospectively from birth. The protocol of the DIPP study has been approved by the Ethical Committees of the University Hospitals of Turku, Oulu and Tampere, and a written consent according to the Declaration of Helsinki was obtained from all study subjects and / or their parents. At the time of sample collection, 2.5 ml of venous blood was drawn into PAXgene Blood RNA tubes (PreAnalytix) at the DIPP study clinic, in Turku, Finland. The samples were incubated for 2 hours at room temperature and then stored at −70° C. until analyzed. Islet cell autoantibodies (ICA), insulin autoantibodies (IAA) and autoantibodies to glutamic acid decarboxylase 65 (GAD-65), islet antigen-2 (IA-2), and zinc transporter 8 ...
example 2
Additional Transcriptional Signatures in Children Genetically at-Risk of T1D
[0085]Another cohort of seroconverted and T1D DIPP children were analyzed (unpublished). Samples were collected as in Example 1. Of 16 subjects in this study, all were sampled starting before the time of the appearance of autoantibodies (seroconversion). Out of these, three children progressed to T1D. A persistently autoantibody negative control child was matched with each case, based on the date and place of birth, gender and HLA-DQB1 genotype (data not shown). In all, 183 blood samples were processed for genome-wide transcriptional analysis with GeneChip Human Genome U219 array plates as in Example 1. Data was analyzed as in Example 1, focusing on the time-window before seroconversion.
example 3
Comparison to Other Available Data
[0086]The publicly available dataset of Ferreira et al. was preprocessed and analyzed for differential expression similarly as in Example 1. A total of 19,310 transcripts with a gene symbol in Ingenuity Knowledge base were identified from the dataset after removing multiple transcripts mapping to the same gene by selecting the representative transcript with largest IQR across all samples.
[0087]Each case child with samples before seroconversion (n=20) was matched with a healthy control child with the same gender and time of birth. For each gene, the maximum and minimum signal log ratio (SLR) between case samples before seroconversion and controls was calculated using linear inter / extrapolation. Differentially expressed genes were identified using rank product test corrected for multiple testing. Using a false discovery rate (FDR) cutoff <0.05 and SLR of 1 and −1 (at least 2-fold change resulted in 23 up-regulated and 1 down-regulated genes that overl...
PUM
| Property | Measurement | Unit |
|---|---|---|
| temperature | aaaaa | aaaaa |
| concentration | aaaaa | aaaaa |
| time | aaaaa | aaaaa |
Abstract
Description
Claims
Application Information
 - R&D
- Intellectual Property
- Life Sciences
- Materials
- Tech Scout
- Unparalleled Data Quality
- Higher Quality Content
- 60% Fewer Hallucinations
Browse by: Latest US Patents, China's latest patents, Technical Efficacy Thesaurus, Application Domain, Technology Topic, Popular Technical Reports.
© 2025 PatSnap. All rights reserved.Legal|Privacy policy|Modern Slavery Act Transparency Statement|Sitemap|About US| Contact US: help@patsnap.com


