Diet Quality Photo Navigation

a photo navigation and diet technology, applied in the field of diet quality photo navigation, can solve the problems of affecting the accuracy laborious for both the client and the consumer, and the inability to accurately represent the individual's dietary pattern, etc., and achieve the effect of accurate representation of the individual's habitual dietary pattern

Inactive Publication Date: 2017-08-24
KATZ DAVID L
View PDF8 Cites 7 Cited by
  • Summary
  • Abstract
  • Description
  • Claims
  • Application Information

AI Technical Summary

Benefits of technology

[0016]It is an object of the present invention to obtain an accu

Problems solved by technology

Conventional dietary intake measures, including, for example, food frequency questionnaires, food diaries, dietary recall, are notoriously prone to inaccuracies despite being very labor-intensive.
They are, in fact, labor intensive for both the “client” and the professionals (i.e., dietitians, nutrition researchers) who rely on them for data.
Because they are tedious, cumbersome, and not user-friendly, they are ill-suited to consumer-facing applications that are intended to be “inviting” or fun to use, such as apps on smart phones or other wearable technology (e.g. smart watches).
Even then, the result is notoriously prone to inaccuracies due to the need to estimate intake of diverse foods, and choose representative foods from the inventory provided.
Food diaries and 24-hour diet recall require the recording of foods at the time of consumption, or depending on memory, and involve writing down details about foods and quantities and again require considerable time.
Such photograph-based methods still depend on food-by-food and meal-by-meal information capture; are labor intensive and time consuming for the consumer, requiring n-of-1 data entry; are labor intensive and time consuming for researchers and health professionals, requiring n-of-1 data analysis to determine nutrient intake levels, salient food factors, and objective measures of overall diet quality.
Furthermore, while existing methods are suitable for individuals, they are not readily adapted to the level of whole households.
In addition, application to children is historically very difficult.
The errors in such methods are of a magnitude that some have deemed them altogether invalid.
Methods in the pipeline do not promise reliably to fix these problems.
The technology on which they depend introduces new potential problems, including but not limited to: need for Internet access; need for expensive hardware; need for reliable light fo

Method used


Image

  • Diet Quality Photo Navigation
  • Diet Quality Photo Navigation
  • Diet Quality Photo Navigation

Examples


example 1

Populating the Matrix

[0170]1) A well-known, validated measure of diet quality is selected to establish an ordinal scale for the range of scores (e.g., quintiles)

[0171]2) Some number of dietary variants are defined, meaning a composition of routinely consumed foods and beverages, representative of each level of quality in the matrix. In other words, diets can vary in both character and quality. A variation in character would be the distinction between a vegetarian diet, and a Paleo diet. A variation in quality would be a high-quality vegetarian diet versus a low-quality vegetarian diet.

[0172]In order to provide any given user of the method with sufficient images to find a close match to their baseline and goal diets, these variations in both character and quality are represented by a suite of foods / drinks captured in a photograph. The ideal representation of, for instance, a “poor quality” vegetarian diet versus a “good quality” vegetarian diet is based on real-world reporting in die...

example 2

Closest Approximation of Baseline Diet

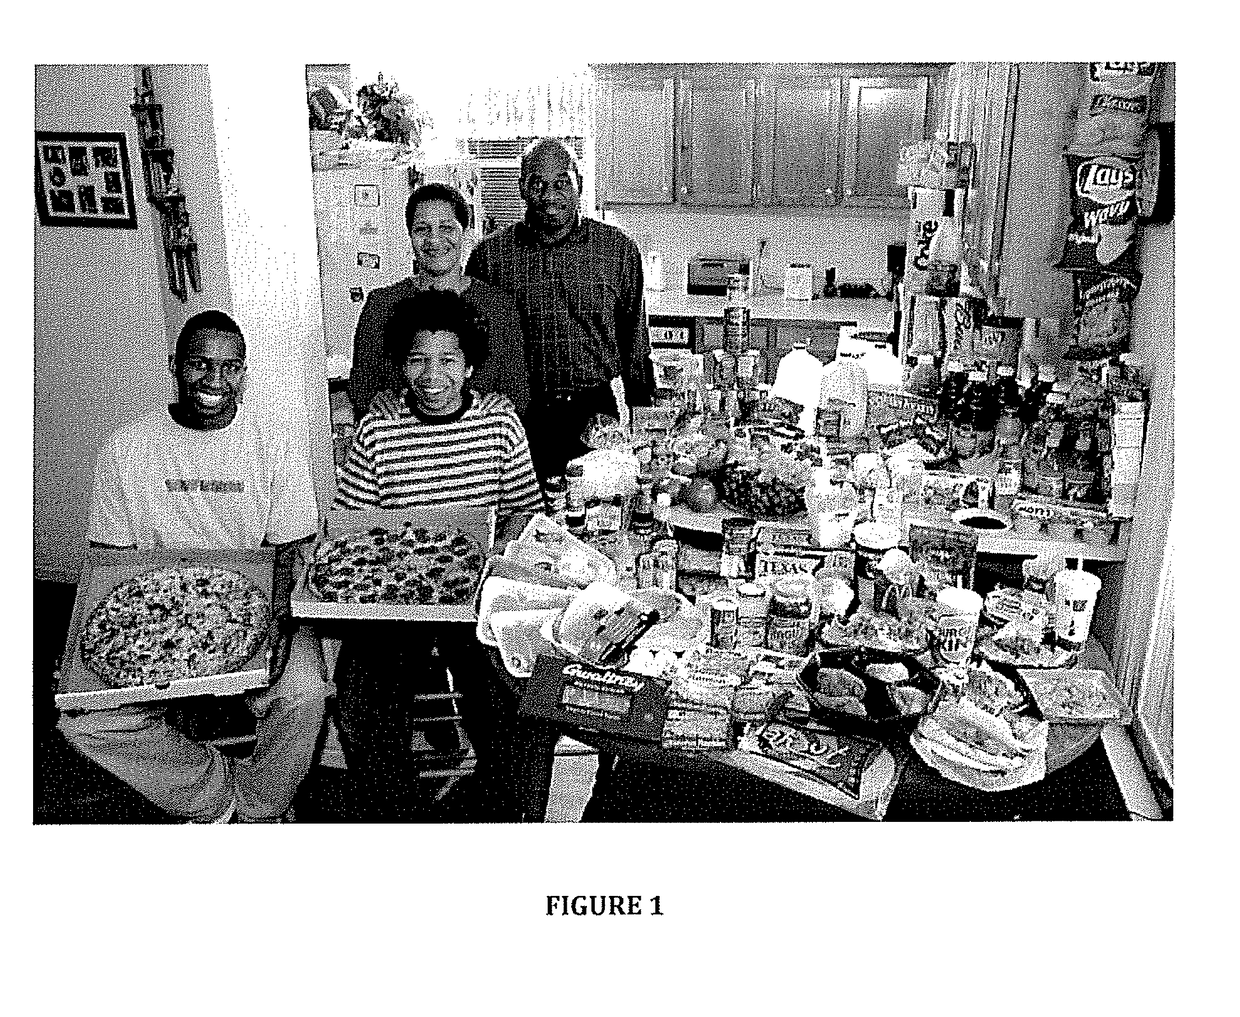
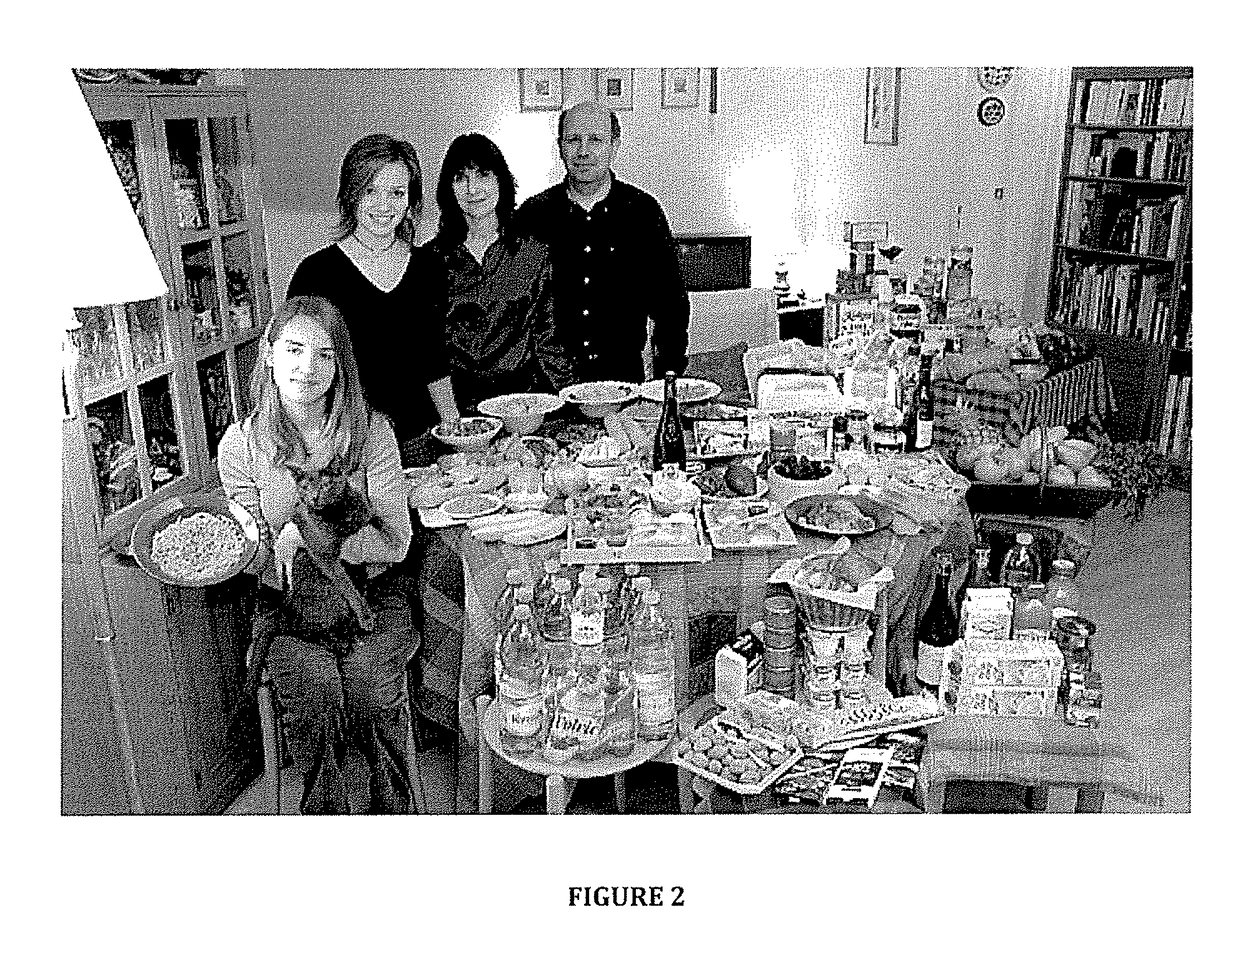
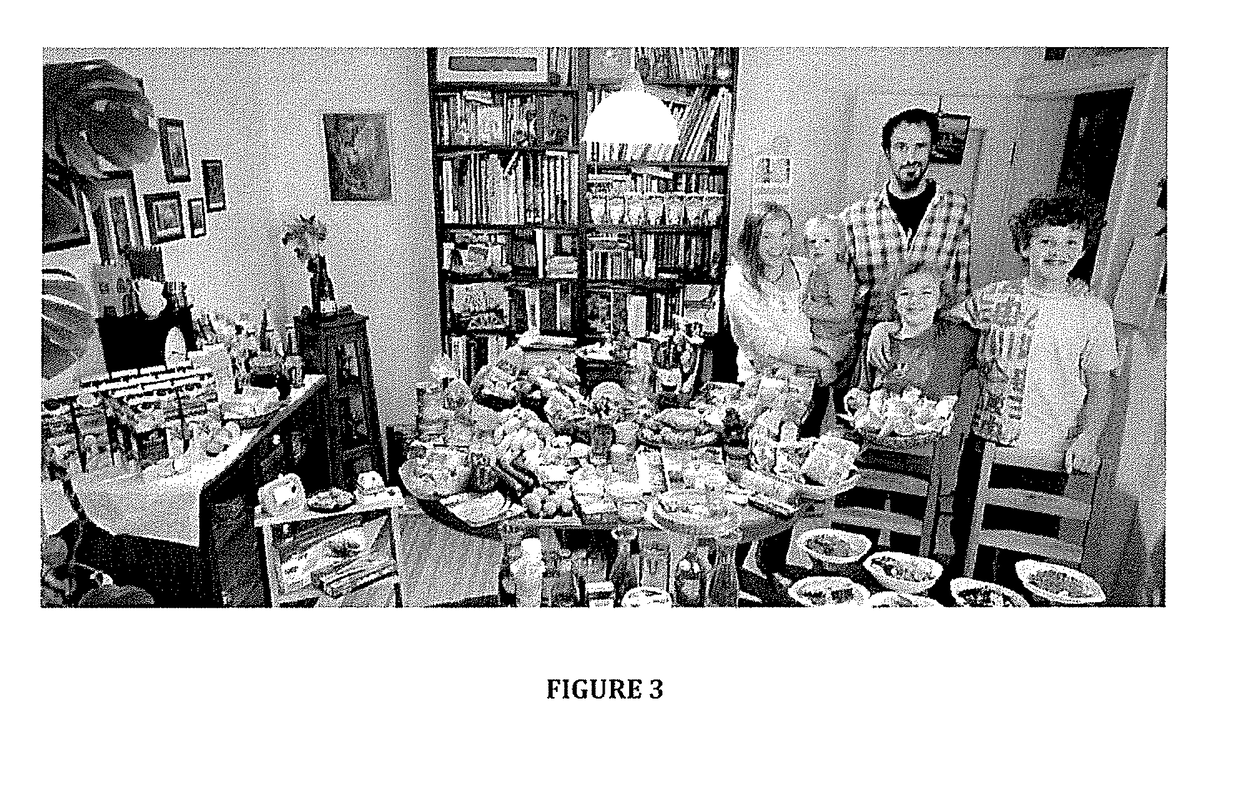
[0180]1) A subject is shown images from a photograph library and asked to choose the closest approximation of baseline diet for a period of time (i.e., one week); the images are VERY distinct. For example, the photograph library may include photographic representations of a ‘typical American diet,’ including meat, soda, and fast food; and an ‘optimal vegetarian diet’ showing no soda, no meat, no fast food, and in their place fresh vegetables, fruits, whole grains, a pitcher of water, etc.

[0181]2) Whichever image is chosen is then subjected to an EXPLODE function, in which N new food photographs, representing much more closely related variants of that dietary pattern are shown; and the subject is once again prompted to choose the closest approximation of baseline diet, in order to get an even closer fit. It is noted that N may be any number. In some embodiments, N is 2 or 3 or 4 or more. While there is no upper limit to N, too many photographs wo...


PUM


Abstract

A method for translating levels of diet quality into photographic representations of dietary pattern. The method includes the steps of (a) using a diet quality measure to identify a plurality of dietary patterns that each represent a level of diet quality for a period of time; (b) assigning a dietary score to each of the plurality of dietary patterns; (c) converting the plurality of dietary patterns into representative dietary patterns; and (d) converting the representative dietary patterns into food photographs. The food photographs depict the photographic representation of the dietary patterns for the period of time. The photographic representations of dietary patterns can be used to establish an individual or household's dietary pattern and can be incorporated into programs to navigate a user from a current dietary pattern to a more optimal dietary pattern.

Description

FIELD OF THE INVENTION[0001]The present invention relates generally to a method for capturing baseline diet composition, goal (desired) diet composition, and providing step-by-step guidance from baseline to goal via a customized, preferred “route”—experienced by the user.BACKGROUND OF THE INVENTION[0002]Good diet quality is a major contributing factor to the health and well-being of individuals and families. However, in order to evaluate diet quality, it is necessary to obtain information regarding current dietary intake of the individual and / or household.[0003]Conventional dietary intake measures, including, for example, food frequency questionnaires, food diaries, dietary recall, are notoriously prone to inaccuracies despite being very labor-intensive. They are, in fact, labor intensive for both the “client” and the professionals (i.e., dietitians, nutrition researchers) who rely on them for data. Because they are tedious, cumbersome, and not user-friendly, they are ill-suited to ...

Claims


Application Information

Patent Timeline
IPC IPC(8): G09B19/00G09B29/00G16B45/00
CPCG09B29/00G09B19/0092
Inventor KATZ, DAVID L.
Owner KATZ DAVID L
Why Eureka
Try Eureka