Method of determining the de-aliased range rate of a target

a target and range rate technology, applied in the direction of instruments, measurement devices, using reradiation, etc., can solve the problems of inability to support velocity estimation, inability to compute complexity, and cancellation of range measuremen

Active Publication Date: 2018-12-13
APTIV TECH LTD
View PDF0 Cites 17 Cited by
  • Summary
  • Abstract
  • Description
  • Claims
  • Application Information

AI Technical Summary

Problems solved by technology

Computational complexity and the requirement to solve an optimization problem are the major drawbacks of the proposed approach, especially when an application in a production embedded system is to be considered.
Notice that range measurement is cancelled in the above equation and does not support the velocity estimation.

Method used


Image

  • Method of determining the de-aliased range rate of a target
  • Method of determining the de-aliased range rate of a target
  • Method of determining the de-aliased range rate of a target

Examples


example 1

Step 1

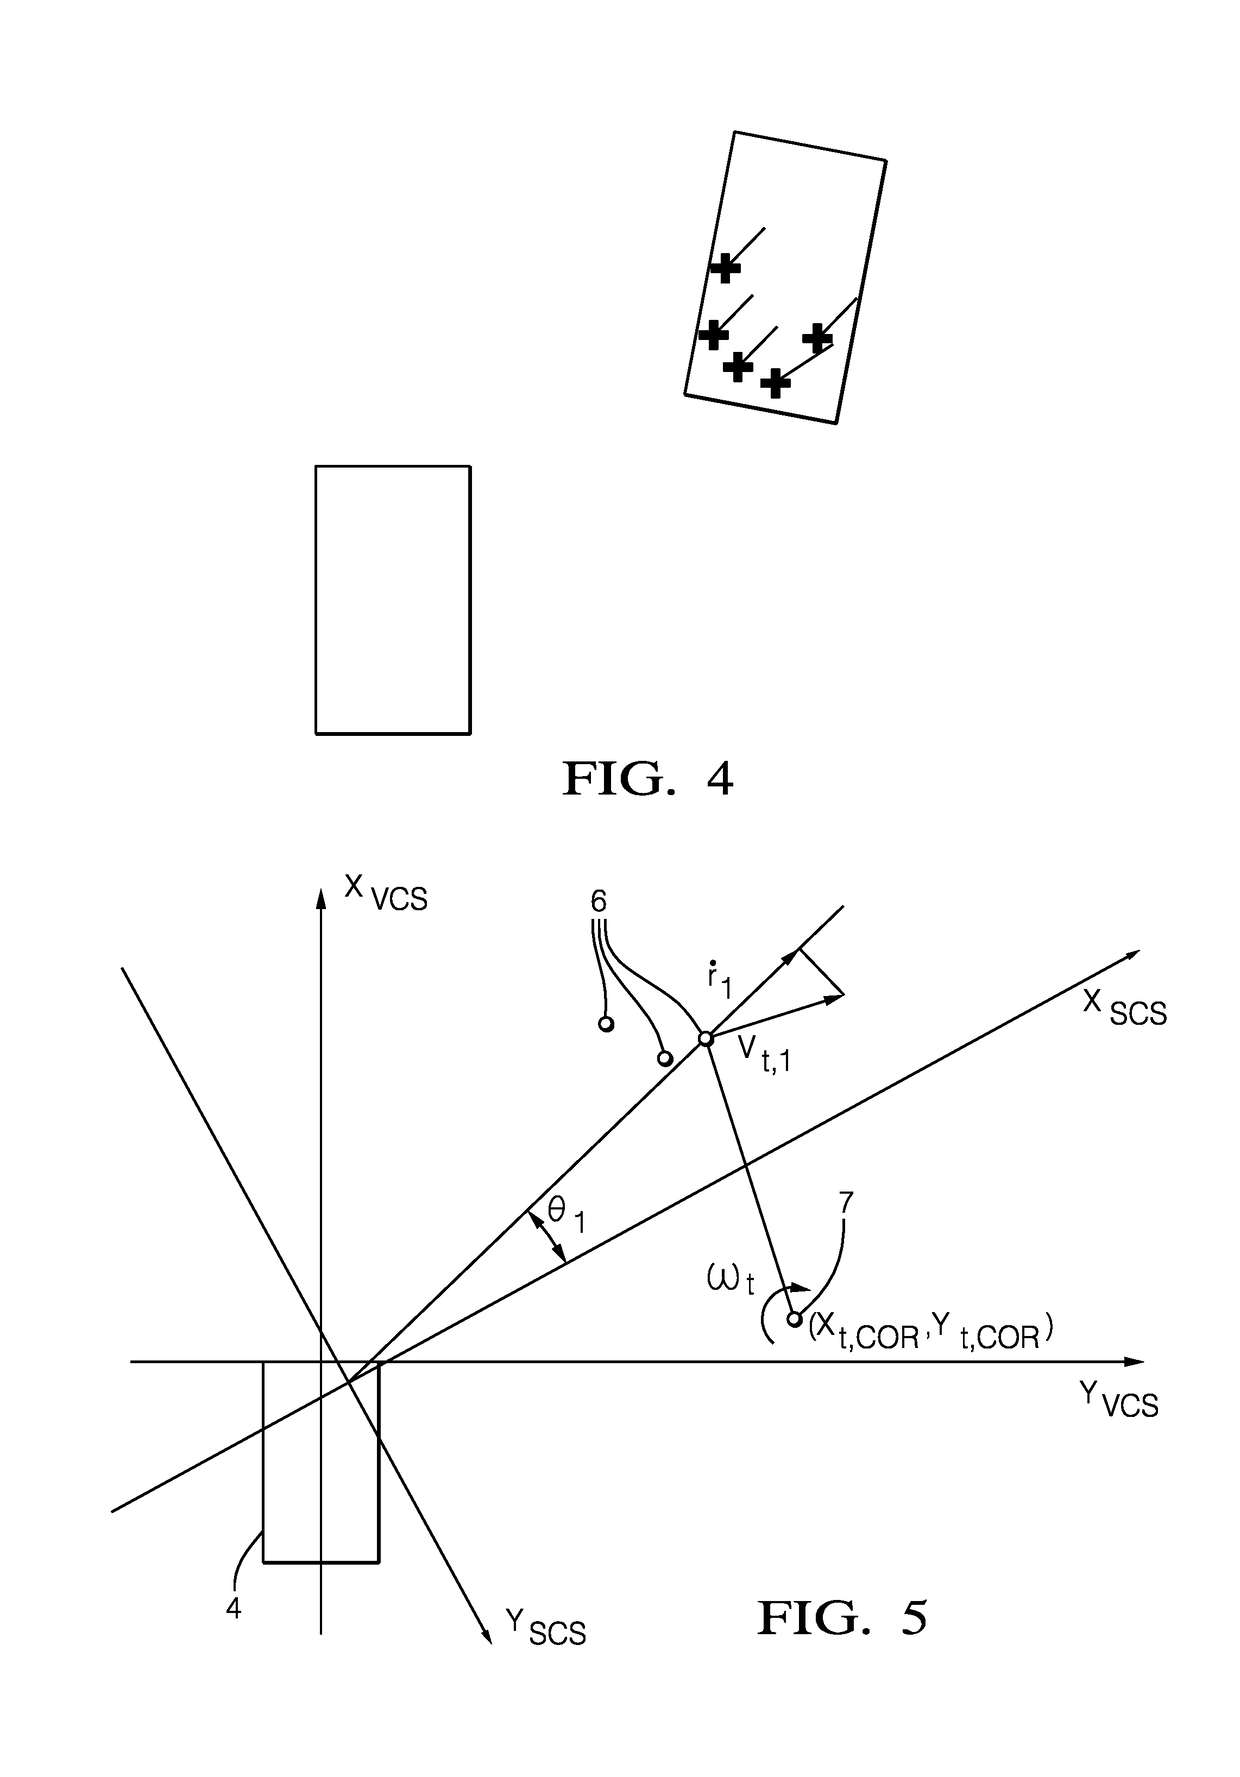
[0065]In an initial step the method comprises emitting a radar signal at a single time-point instance and determining from a plurality (m) of point radar detections measurements therefrom captured from said radar sensor unit in a said single radar measurement instance the values for each point detection of azimuth and range rate; [θi, {dot over (r)}i]Thus there are several point detections captured by the Doppler radar from a single target (such target is usually referred to as a distributed target) as shown in FIG. 4.

Step 2

[0066]In the next step range rate compensated by sensor speed is calculated {dot over (r)}i,cmp={dot over (r)}i+us cos θi+vs sin θi, where {dot over (r)}i—raw range rate (or radial velocity); θi— raw azimuth angle; {dot over (r)}i,cmp—range rate compensated; and us—host vehicle or sensor longitudinal velocity; vs—host vehicle or sensor lateral velocity.

Step 3

[0067]In the next step a plurality of plausible velocity profile hypotheses is calculated / determined...

implementation example

[0081]The methodology according to examples has been implemented and used verifying the de-alias status of a velocity profiles. This was applied when such verification is not available from a Tracker algorithm (de-aliasing in time). In Object Hypotheses implementation only one (j=0) velocity profile hypothesis is considered with two plausibility checks (7b, 7c).

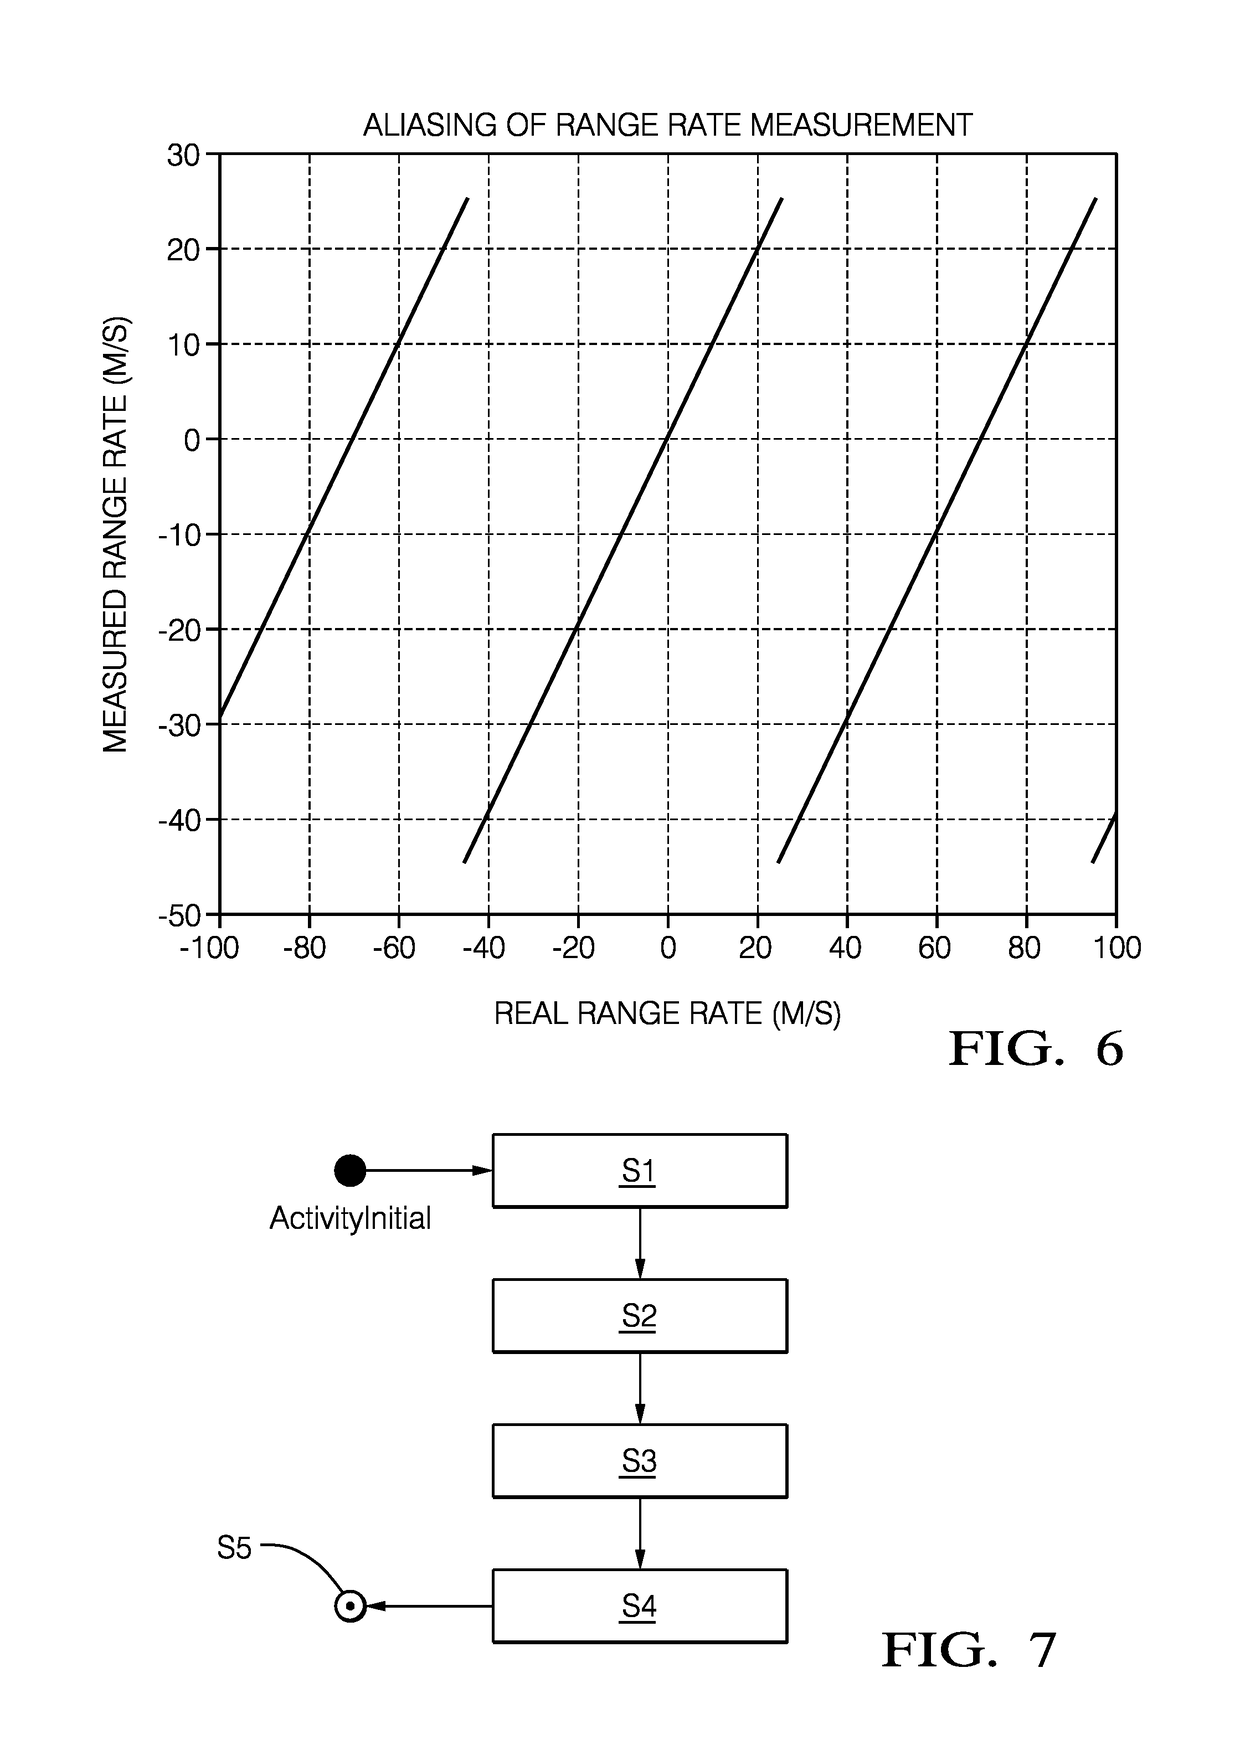
[0082]FIG. 7 shows a flow chart of the basic methods steps. The method starts and in step S1 where the velocity profiles are hypothesized. In step S2 the detections are analysed. In step S3 the de-aliasing parameter(s) are analysed for the velocity profiles and detection data. In step S4 the variance is calculated and Step S5 the final results are determined.

[0083]FIG. 8 shows the execution path of the OH De-Alias By Velocity Profile component. The process starts at step S10. As step S11 the de-alias status of the detection group is determined. If it is determined that it is not de-aliased the process moves to step S12 where ...

example i

)

[0089]In this scenario, the target vehicle is overtaking the host vehicle 31, as seen in FIG. 9a. FIGS. 9b and 9c show diagrammatic representations of five velocity profile hypotheses in relation to FIG. 9a. The box 31 is the reference object (measured with the differential GPS) having the velocity vector specified for the center of the front bumper (dashed line 32). The lines 34 represent different hypotheses of velocity vector estimators. The crosses 35 represent raw detections from the distributed target.

[0090]Table 1 below shows the experimental results for the example 1.

Hypothesis index (j)−2−1012{tilde over (c)}t, j [m / s]−131.4−69.1−6.655.8118.3{tilde over (s)}t, j [m / s]44.628.311.9−4.42−20.7{circumflex over (σ)}{dot over (r)}, j [m / s]3.861.950.131.93.81


PUM


Abstract

A method of determining the de-aliased range rate of a target in a horizontal plane by a host vehicle equipped with a radar system, said radar system including a radar sensor unit adapted to receive signals emitted from said host vehicle and reflected by said target, comprising: emitting a radar signal at a single time-point instance and determining from a plurality (m) of point radar detections measurements therefrom captured from said radar sensor unit, the values for each point detection of, azimuth and range rate; [θi, {dot over (r)}i]; for each point detection determining a range rate compensated value ({dot over (r)}i,cmp); c) determining a plurality (j) of velocity profile hypotheses; for each (j-th) hypothesis determining modified compensated hypothesis range rates ({dot over (r)}i,j,cmp) in respect of each point detection on the target, based on the values of range rate compensated ({dot over (r)}i,cmp); for each j-th hypothesis, determining values of the longitudinal and lateral components of the range rate equation of the target {tilde over (c)}t,j and +{tilde over (s)}t,j; for each j-th hypothesis and for each point detection determining a velocity profile estimator range rate ({dot over ({circumflex over (r)})}i,j,cmp); for each hypothesis, for one or more point detections, determining a measure of the dispersion of, or variation between the velocity profile estimator range rates ({dot over ({circumflex over (r)})}i,j,cmp) for each velocity profile hypothesis and their respective modified range rates ({dot over ({circumflex over (r)})}i,j,cmp) from step d), or the dispersion of, or variation between, one or both of the velocity profile components {tilde over (c)}t,j and {tilde over (s)}t,j for each velocity profile hypothesis, and selecting the velocity profile where said measure of dispersion or variation is the lowest; setting the de-aliased range rate as the velocity of the velocity hypothesis selected.

Description

TECHNICAL FIELD OF INVENTION[0001]This disclosure relates to an on-board vehicle method of determining de-aliased range rates of a target such as another vehicle.BACKGROUND OF INVENTION[0002]Typically, (host) vehicles may be equipped with radars systems used to classify the environment in the vicinity of the vehicle such as to e.g. detect moving or static objects around the vehicle. Such systems are used to for example, to estimate the motion state of other vehicles for automotive perception systems and can be used in Active Safety, Driver Assistance and Autonomous Driving applications.[0003]Typically, such systems may include Doppler radar methodology where reflected radar signals are detected and analyzed in the frequency domain, typically by applying Fast Fourier Transform methodology. So, Doppler radar measurements are usually extracted by applying the Fast Fourier Transform to the baseband signal captured from the environment. Typically results are divided into a number of freq...

Claims


Application Information

Patent Timeline
Patent Type & Authority Applications(United States)
IPC IPC(8): G01S7/295G01S13/58G01S13/931
CPCG01S7/295G01S13/581G01S13/426G01S7/2921G01S13/58G01S13/588G01S13/931G01S13/42G01S13/582G01S13/584G01S13/589G01S13/726G01S2013/93271G01S2013/932
Inventor STACHNIK, MATEUSZCIESLAR, DARIUSZKOGUT, KRZYSZTOF
Owner APTIV TECH LTD
Why Eureka
Try Eureka