Generating a Yield Map for an Agricultural Field Using Classification and Regression Methods

Active Publication Date: 2019-03-14
FARMERS EDGE INC
View PDF0 Cites 13 Cited by
  • Summary
  • Abstract
  • Description
  • Claims
  • Application Information

AI Technical Summary

Benefits of technology

The patent describes a system that helps create a map that shows how well a crop is doing in an agricultural field. This system includes different parts like a client system, a network system, a measurement system, and an observation system. The client system runs a model that uses data from the measurement system and the observation system to create the map. The system measures the crop yield in the field and observes its growth. It then puts these measurements on a map and generates a visual representation of the yield for the operator to see. The technical effect of this system is that it helps create a more precise map that can help guide farmers on what to do to improve their crop yield.

Problems solved by technology

However, while the technology for measuring, observing, and storing agricultural data continues to improve, it is not always possible to measure a data set completely, or with perfect accuracy.
In particular, agricultural data pertaining to crop yield generally includes erroneous data points.
However, because continuous functions use agricultural data that includes erroneous data points, determination of crop yield based on that agricultural data are inaccurate.

Method used


Image

  • Generating a Yield Map for an Agricultural Field Using Classification and Regression Methods
  • Generating a Yield Map for an Agricultural Field Using Classification and Regression Methods
  • Generating a Yield Map for an Agricultural Field Using Classification and Regression Methods

Examples


Embodiment Construction

I. Introduction

[0020]This method seeks to generate a yield map for an agricultural field using a yield model that leverages indicators obtained from field measurement and observation systems. A yield map is a visual representation of yield values for a number of areas of the agricultural field. Herein, a yield value is a quantification of yield for an area of the field, such as, for example, bushels harvested per acre, or dollars per acre. The yield model generates a yield map from a data structure that includes a number of data cells where each data cell represents an area of the field. The yield model populates each data cell with a yield value using machine learning algorithms that utilize the indicators obtained from the measurement and observation systems.

II. System Environment

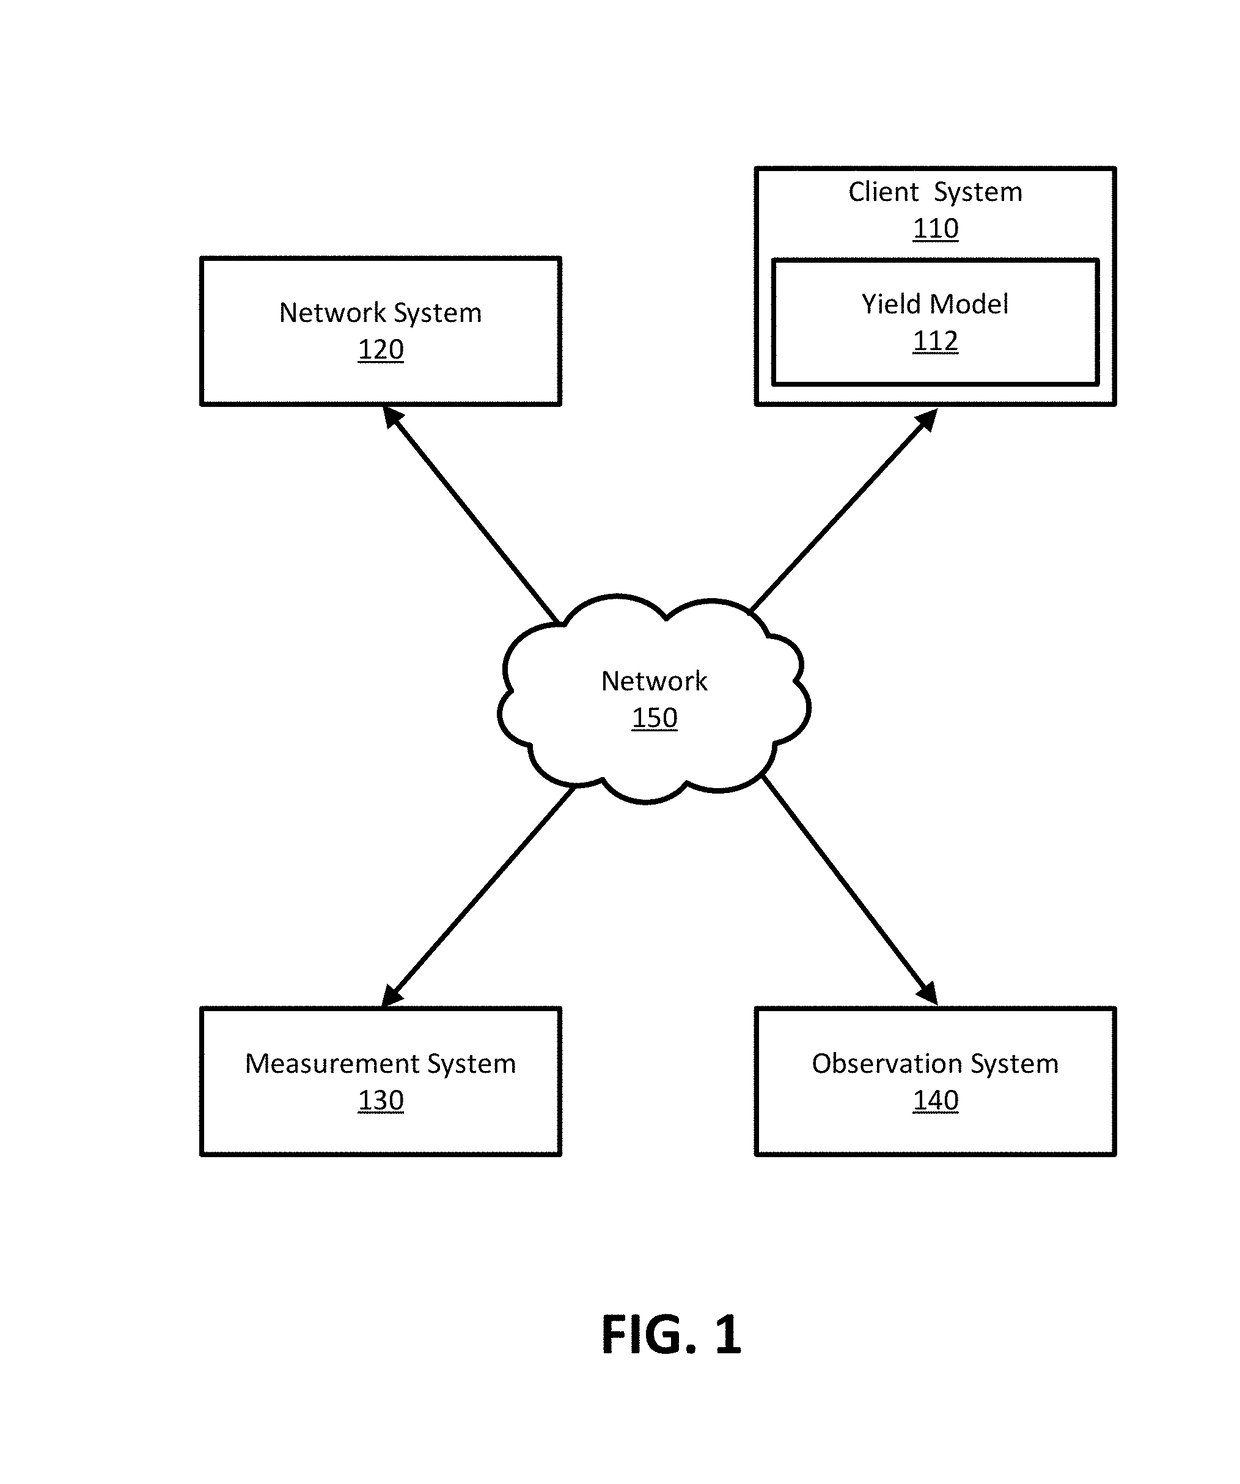
[0021]FIG. 1 illustrates a system environment 100 for generating a yield map for an agricultural field. Within the system environment 100, a client system 110 generates a yield map using a yield model 112...


PUM


Abstract

A yield model generates a yield map for an agricultural field. A measurement system generates measured indicators that are a measurement or quantification of crop yield in the agricultural field. An observation system generates observed indicators that are spatial agricultural datasets describing observed characteristics of the agricultural field. To generate the yield map, the yield model generates a field array representing the agricultural field. The yield model generates an input array and a yield array by mapping the observed indicators and measured indicators to cells of the field array, respectively. The yield model determines a yield value for each cell of the yield array not including a mapped indicator using information included in the corresponding cells of the input array. The yield model generates a yield map using the determined yield values and the yield values in the yield array.

Description

CROSS REFERENCE TO RELATED APPLICATIONS[0001]This application claims the benefit of priority to U.S. Provisional Application No. 62 / 556,975, filed Sep. 11, 2017 which is incorporated herein by reference in its entirety for all purposes.TECHNICAL FIELD OF INVENTION[0002]This invention relates generally to generating a yield map for an agricultural field, and more specifically to using a yield model including current measurements and previous observations as indicators for the yield model.BACKGROUND[0003]Advances in the data technology including ubiquitous connectivity, cheap storage, and cloud-computing power have made data, including agricultural data, accessible for analysis. However, while the technology for measuring, observing, and storing agricultural data continues to improve, it is not always possible to measure a data set completely, or with perfect accuracy. In particular, agricultural data pertaining to crop yield generally includes erroneous data points.[0004]In an ideal ...

Claims


Application Information

Patent Timeline
IPC IPC(8): A01D41/127G01N33/02G06K9/00G06Q50/02
CPCA01D41/1272G01N33/02G06K9/00657G06Q50/02A01B79/005G06V20/188G06V20/17
Inventor DUKE, GUY DIONGRANT, KEVIN JOHN
Owner FARMERS EDGE INC
Why Eureka
Try Eureka