Systems and Methods for Measuring Binding Kinetics of Analytes in Complex Solutions
- Summary
- Abstract
- Description
- Claims
- Application Information
AI Technical Summary
Benefits of technology
Problems solved by technology
Method used
Image
Examples
example 1
Measuring Binding Kinetic Parameters of Complex Samples with GMR Sensors
[0169]GMR sensors were used to measure binding kinetic parameters. Sensor surfaces were prepared by applying native human TSH proteins at different concentrations, from which an optimal condition (concentration) was selected for kinetic analysis.
[0170]Commercial TSH antibodies were individually conjugated to the magnetic nanoparticles (MNPs). Both the sensor surface and modified MNPs were blocked following conventional methods to prevent non-specific interactions.
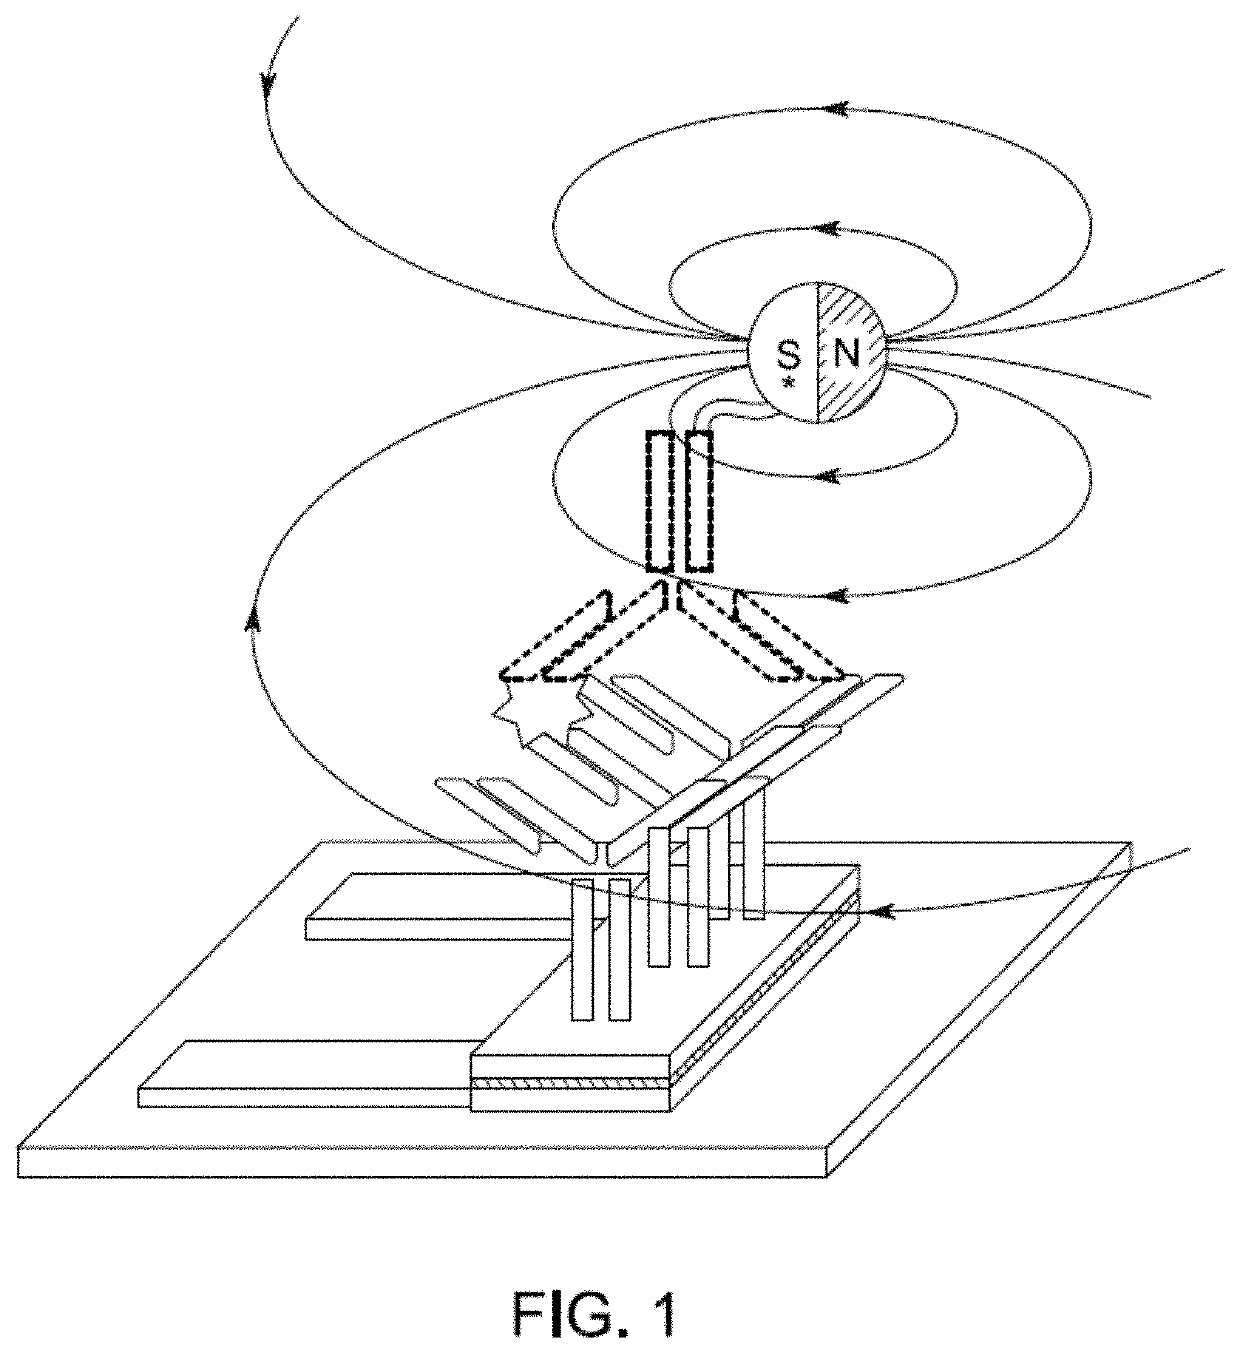
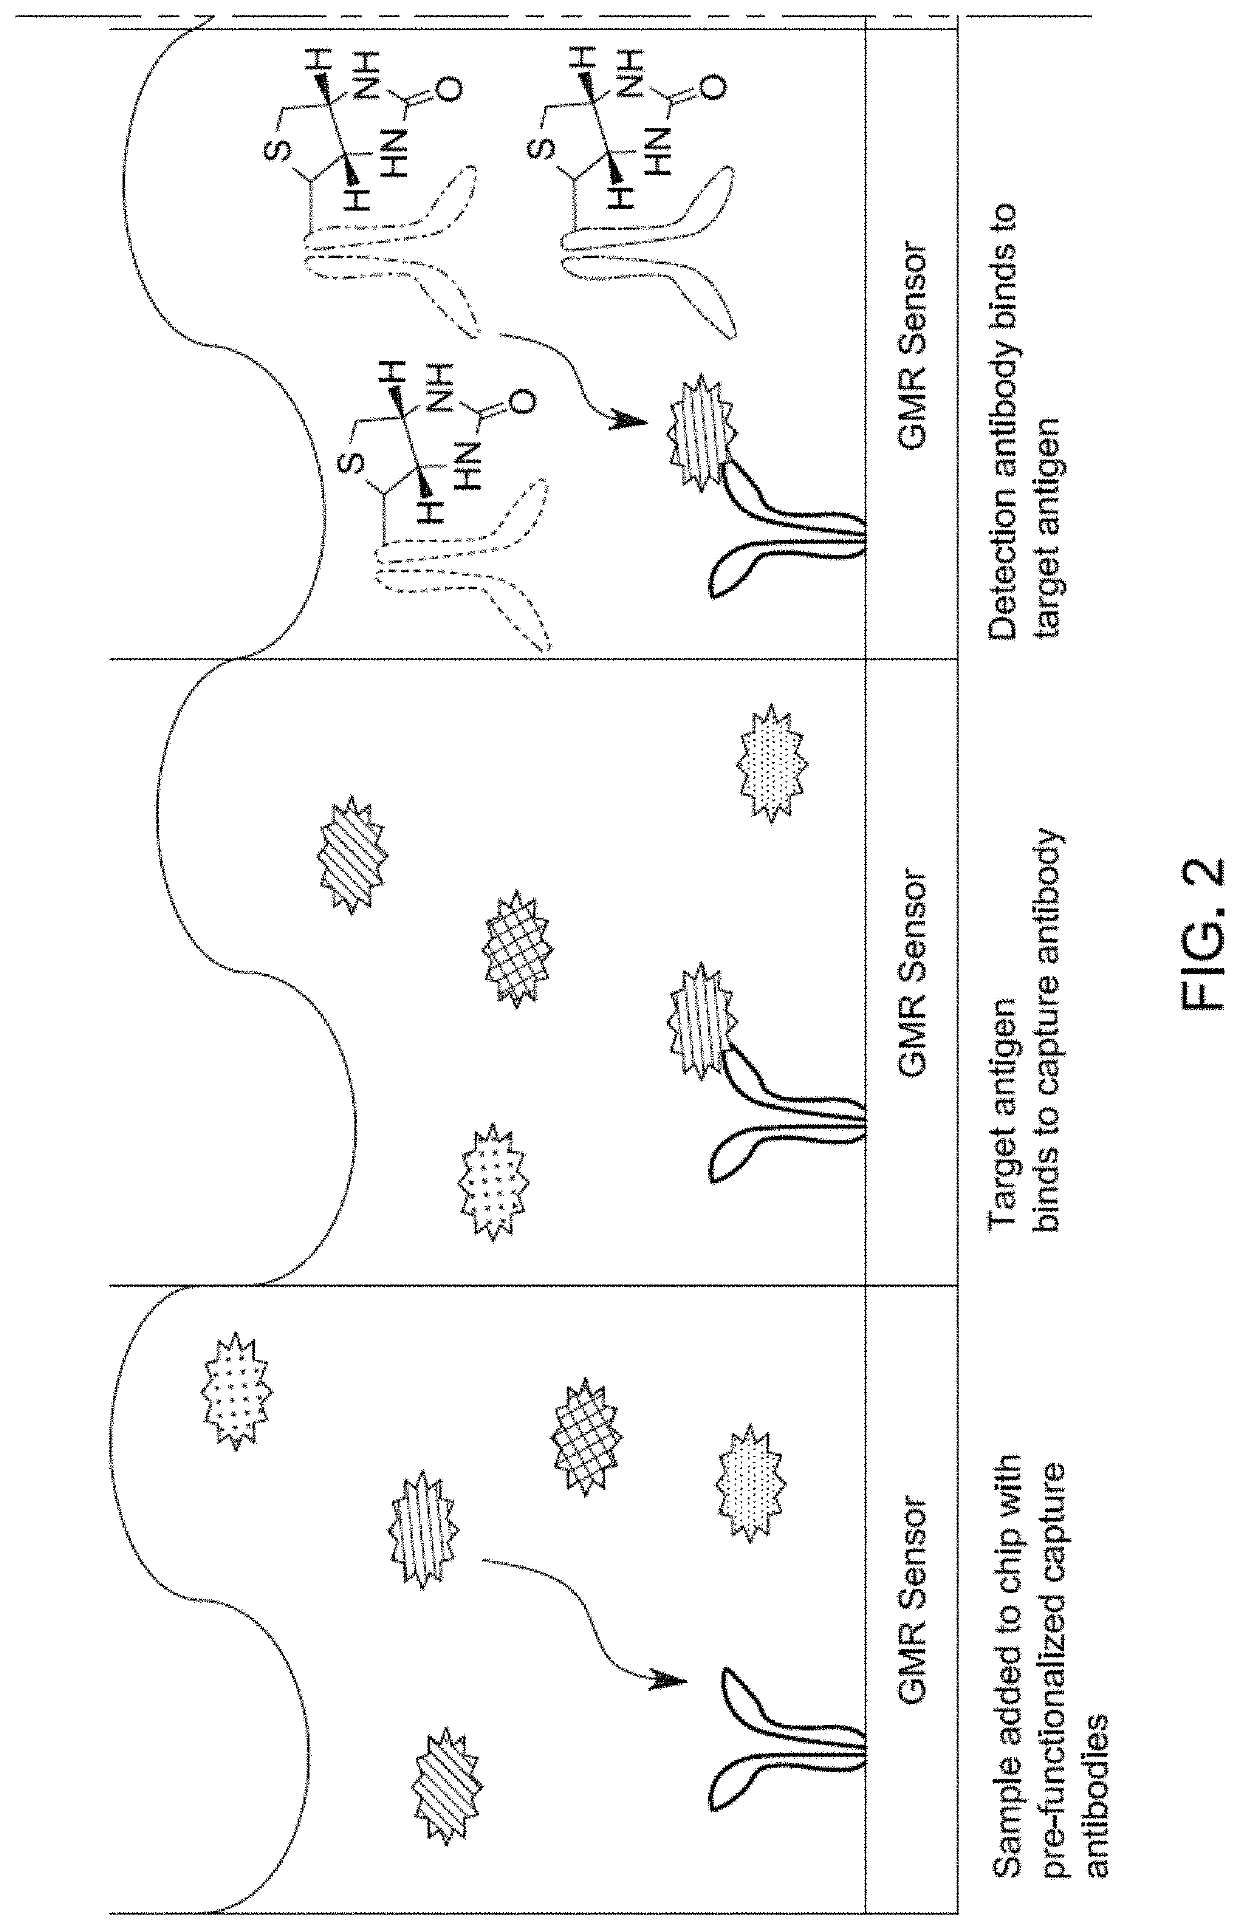
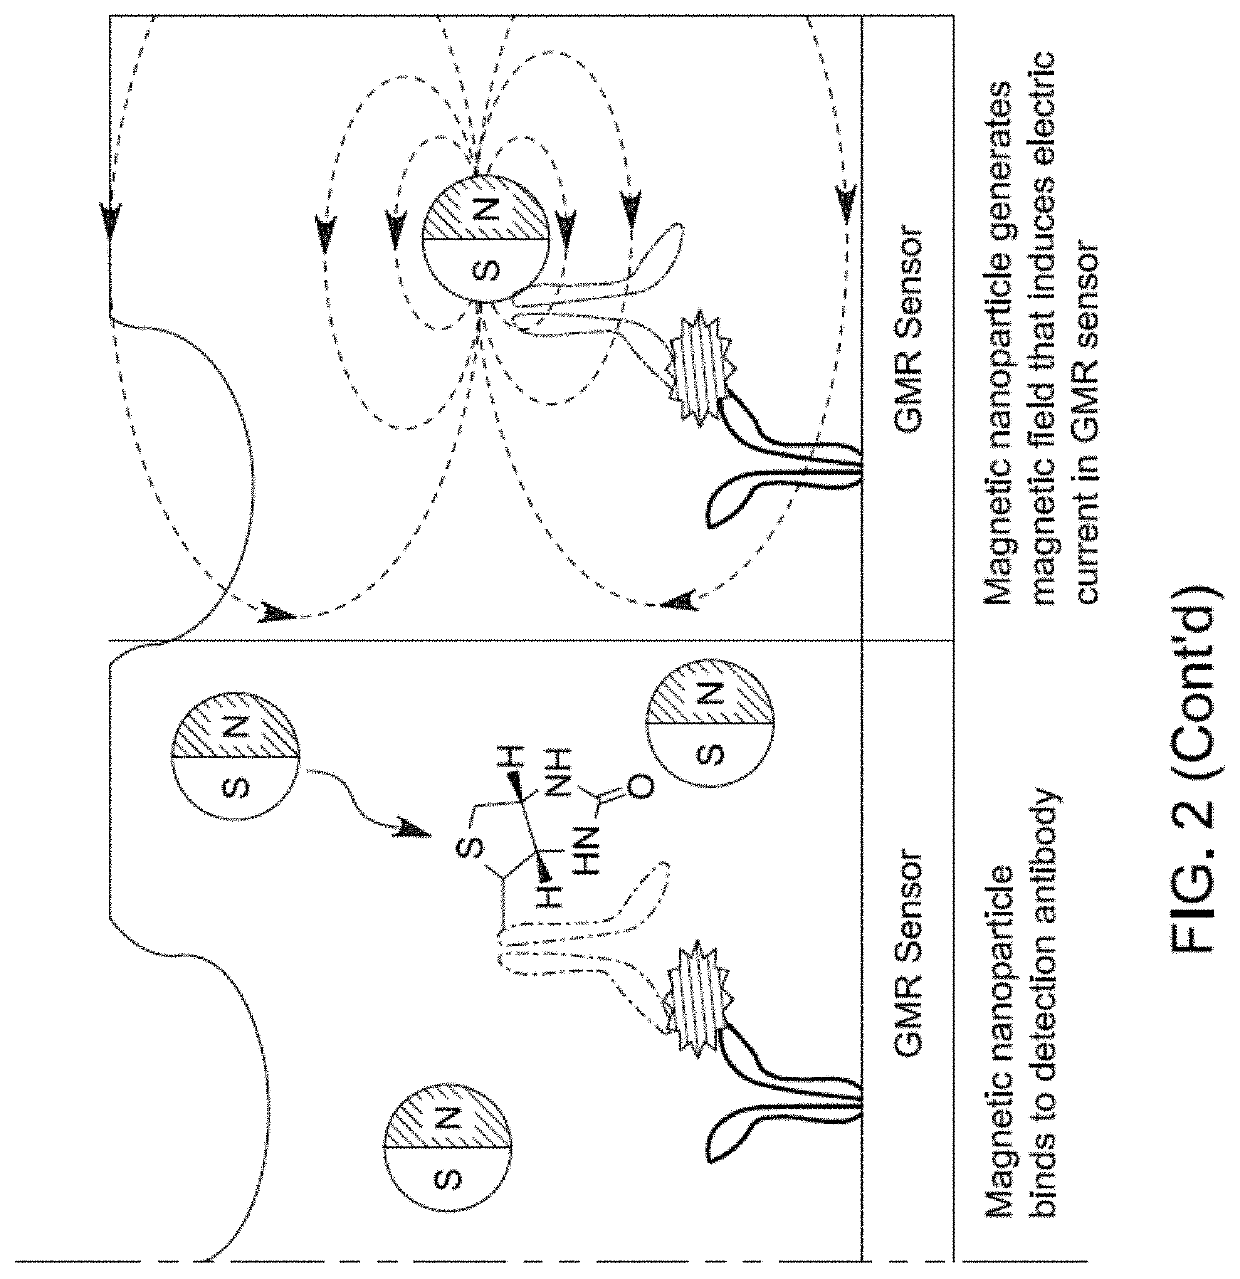
[0171]The real-time reading of the binding signals was realized by applying the modified MNPs to the sensors directly. Since only proximity signals are detected, they only reflect the specific binding of MNPs and the surface proteins. The mechanism of the interaction is shown in FIG. 1 and FIG. 2.
[0172]TSH protein and antibody interactions were studies wherein the assay mixture included: (i) simple solution with buffer but no blood sample; (ii) a comple...
example 2
Comparing Parameters Obtained with Complex Samples and GMR Sensors to Literature Values
[0175]The binding kinetic parameters calculated in Example 1 have previously been measured using simple solutions and Surface Plasmon Resonance (SPR), i.e. the “literature values”. Table 2 (see FIG. 8) shows that the parameters calculated from the measurements of Example 1 were always within a 1-fold difference of the literature values, and usually significantly closer. Hence, the calculated parameters of Example 1 were in agreement with the literature values.
example 3
Measuring Binding Kinetic Parameters of Complex Samples with SPR Sensors
[0176]Next, the same binding kinetic parameters of Example 1 were measured, but with the Biacore X100 instrument, which employs Surface Plasmon Resonance (SPR) instead of a GMR sensor. The same TSH proteins and antibodies were employed as in Example 1. The buffer was BSA at concentrations of 0%, 0.01%, 0.1%, 1%, and 10%.
[0177]However, as shown in FIGS. 5A and 5B, the measurement with the Biacore X100 instrument showed significant differences based upon the concentration of BSA. Thus, such significant differences using a showed that the presence of the
[0178]BSA buffer interfered with the accurate measurement of binding kinetic parameters when using an SPR instrument.
[0179]Such negative interferences from components other than the components of interest can be assessed in several manners. In some cases, the negative interferences will cause the derivative of the smoothed real-time data to have more than a single c...
PUM
 Abstract
Description
Claims
Application Information
 - R&D
- Intellectual Property
- Life Sciences
- Materials
- Tech Scout
- Unparalleled Data Quality
- Higher Quality Content
- 60% Fewer Hallucinations
Browse by: Latest US Patents, China's latest patents, Technical Efficacy Thesaurus, Application Domain, Technology Topic, Popular Technical Reports.
© 2025 PatSnap. All rights reserved.Legal|Privacy policy|Modern Slavery Act Transparency Statement|Sitemap|About US| Contact US: help@patsnap.com


